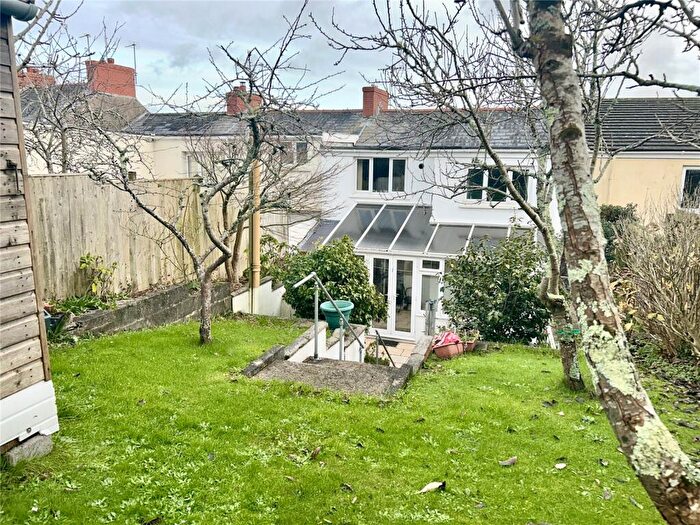
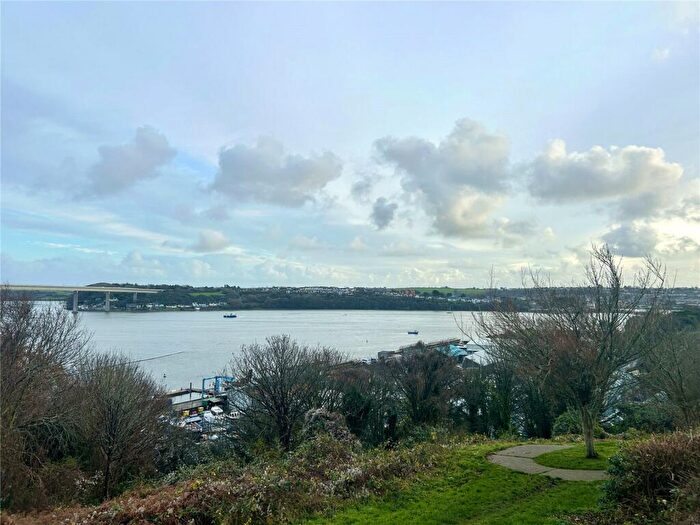
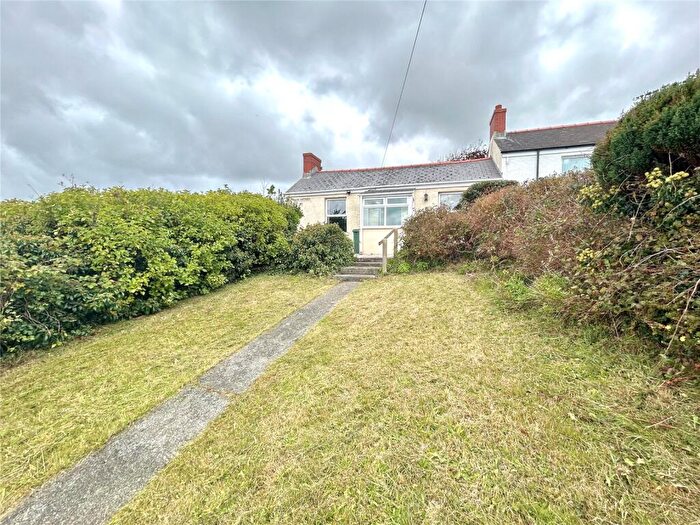
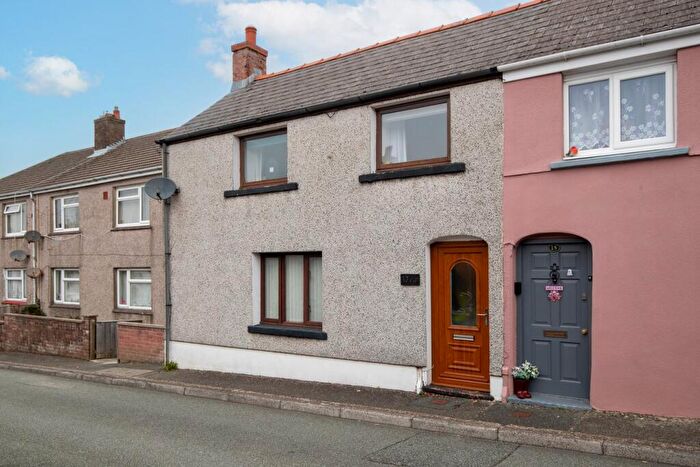
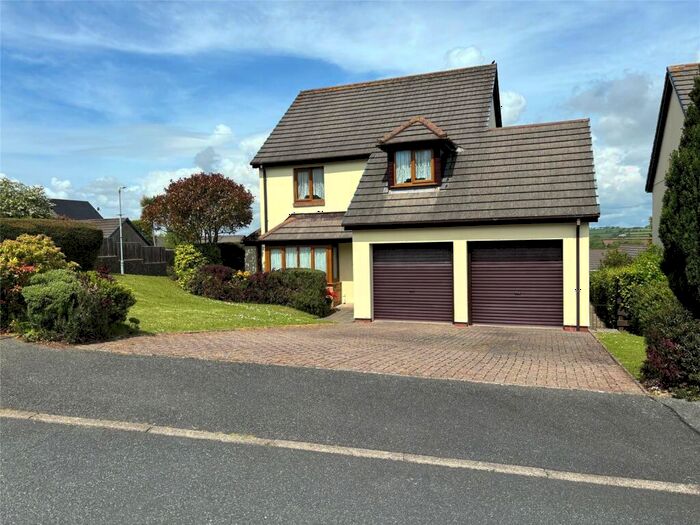
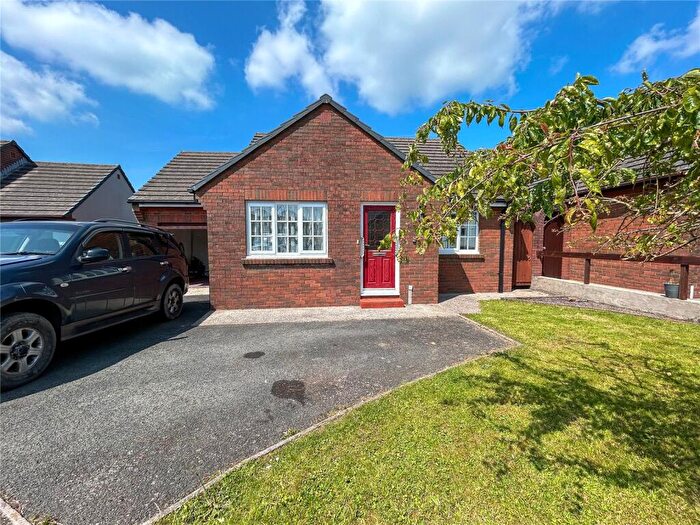
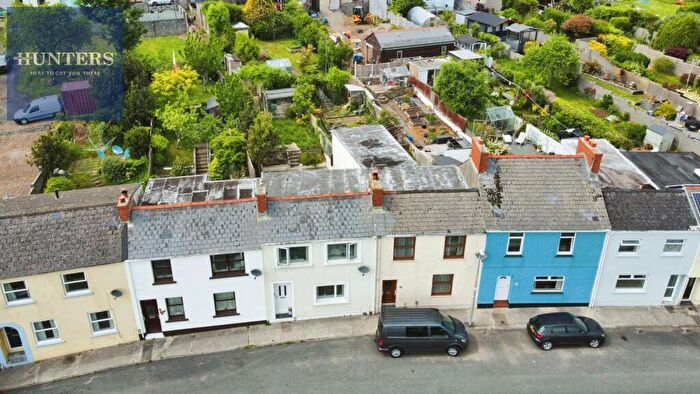
Houses for sale & to rent in Neyland: East, Milford Haven
House Prices in Neyland: East
Properties in Neyland: East have an average house price of £189,952.00 and had 131 Property Transactions within the last 3 years¹.
Neyland: East is an area in Milford Haven, Sir Benfro - Pembrokeshire with 1,000 households², where the most expensive property was sold for £600,000.00.
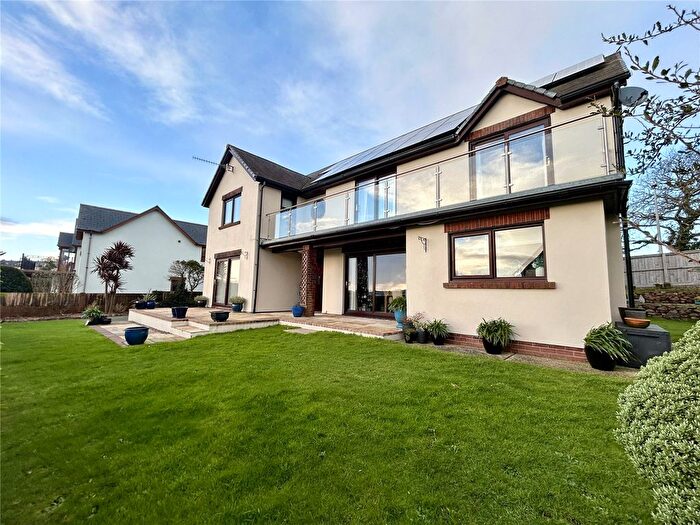
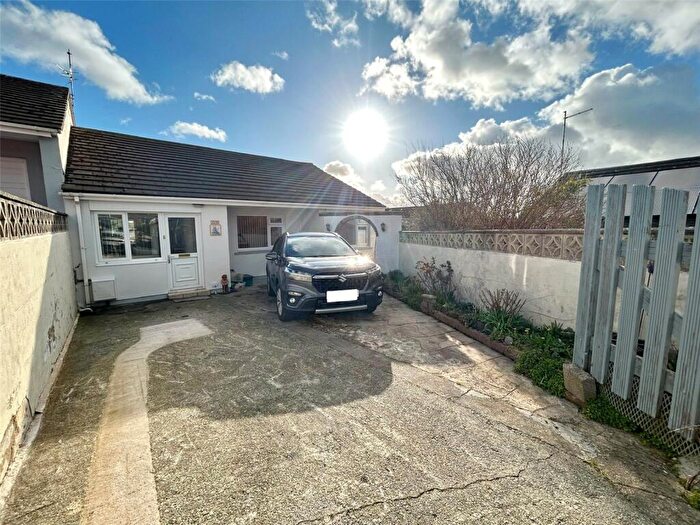
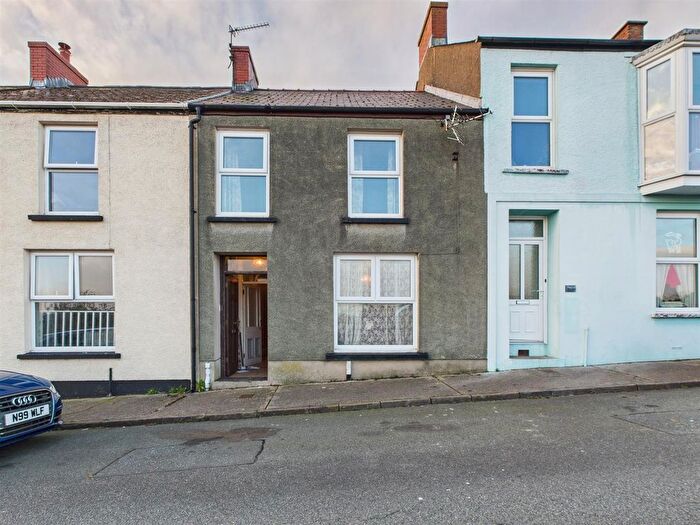
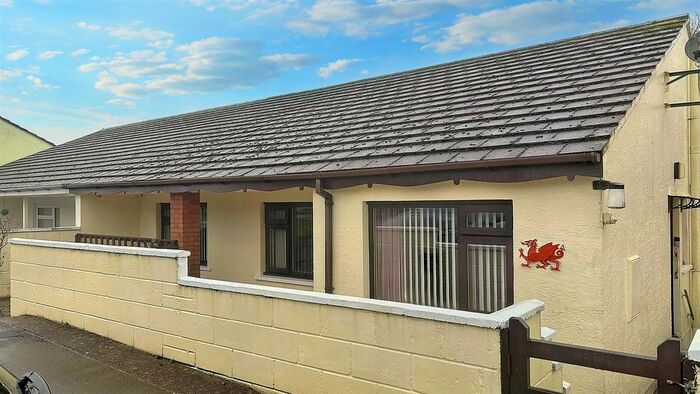
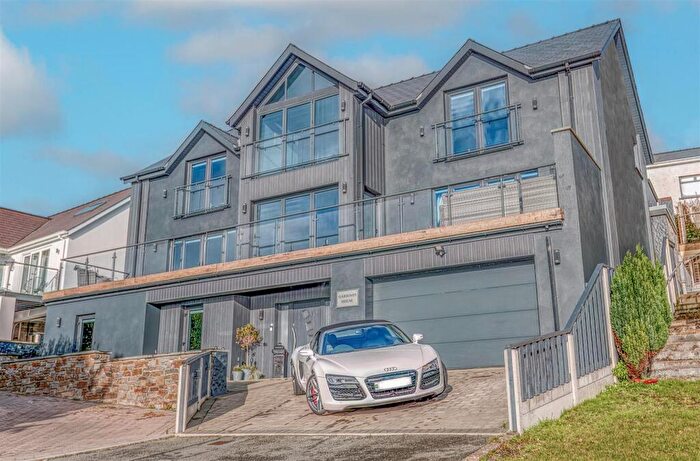
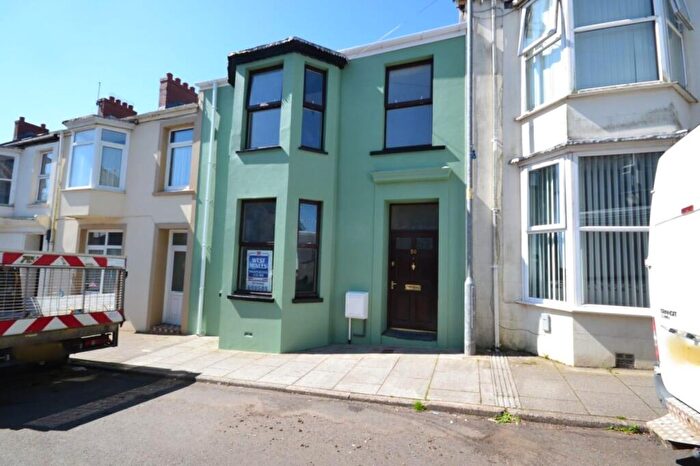
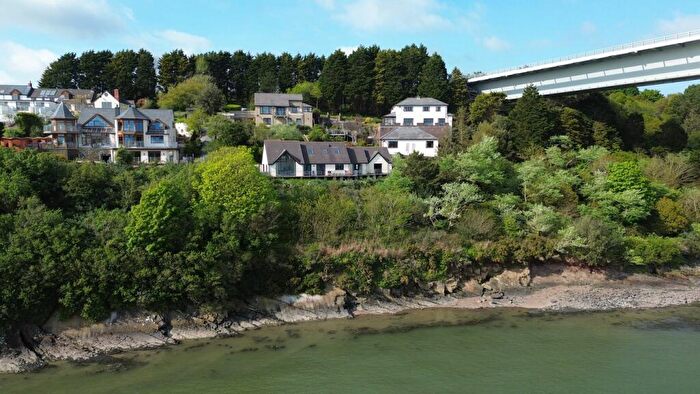
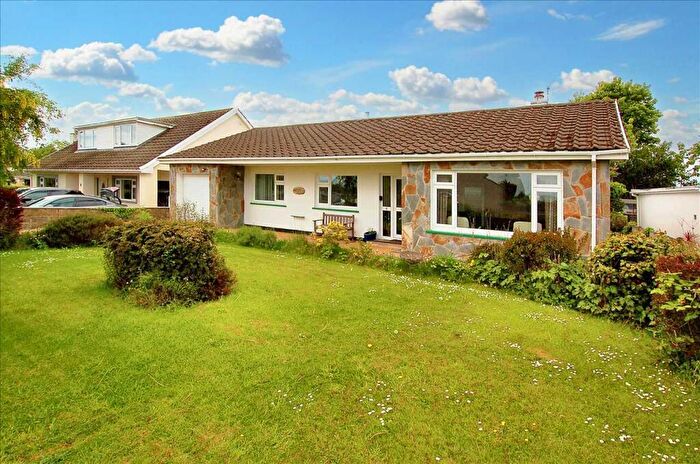
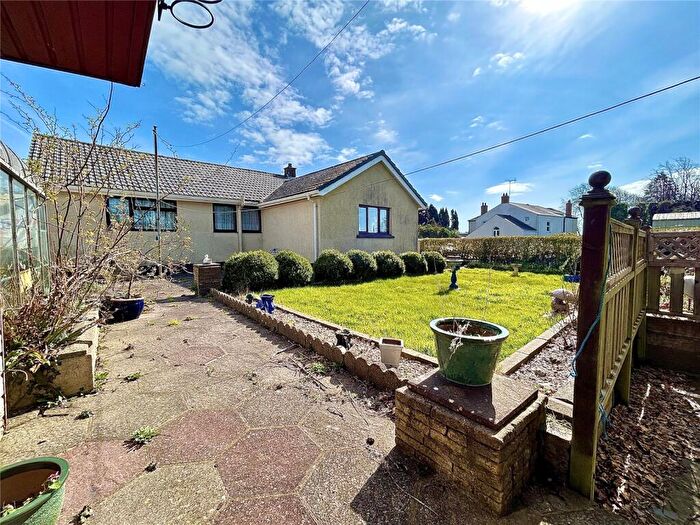
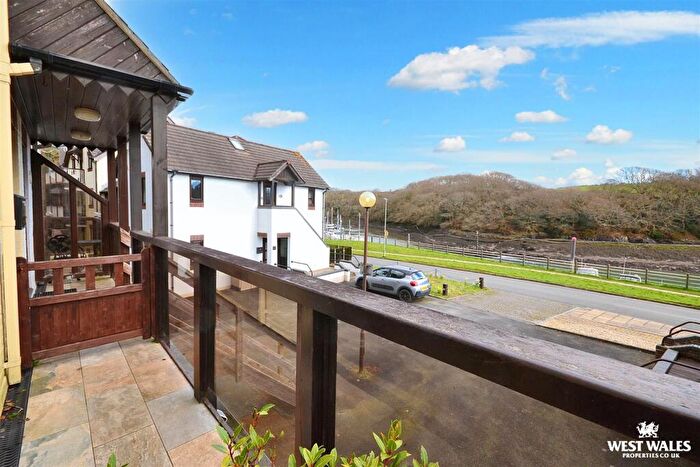
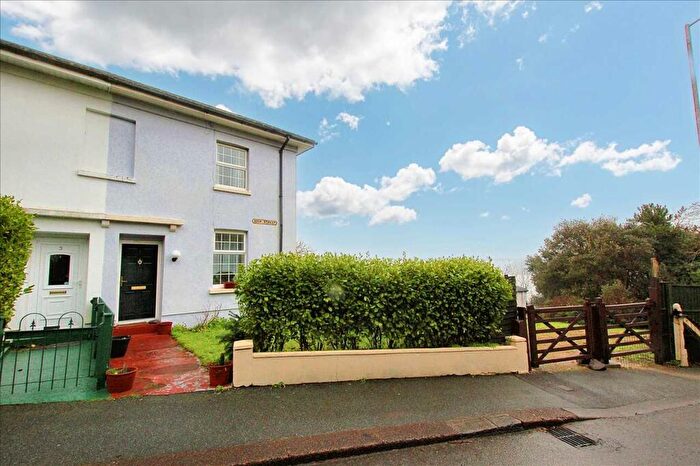
Properties for sale in Neyland: East
Previously listed properties in Neyland: East
Roads and Postcodes in Neyland: East
Navigate through our locations to find the location of your next house in Neyland: East, Milford Haven for sale or to rent.
| Streets | Postcodes |
|---|---|
| Blenheim Drive | SA73 1PL |
| Bluebell Close | SA73 1SQ |
| Brunel Avenue | SA73 1QH |
| Brunel Quay | SA73 1PY |
| Cambrian Road | SA73 1ST |
| College Park | SA73 1TX SA73 1TY |
| Coram Drive | SA73 1PZ |
| Elm Grove | SA73 1RD |
| Fern Rise | SA73 1RA |
| Field Cottages | SA73 1PR |
| Fleming Way | SA73 1RZ SA73 1SD |
| Frederick Street | SA73 1TG |
| Gaddarn Reach | SA73 1PW |
| Great Eastern Terrace | SA73 1QA |
| Haven View | SA73 1LS |
| High Street | SA73 1SR SA73 1SS SA73 1TE SA73 1TF SA73 1TR |
| Hill Terrace | SA73 1SN |
| Honeyborough Business Park | SA73 1SJ |
| Honeyborough Grove | SA73 1TQ |
| Honeyborough Industrial Estate | SA73 1SE |
| Jackson Drive | SA73 1PN |
| John Street | SA73 1TH |
| Kensington Road | SA73 1RN SA73 1TJ SA73 1TP |
| Lawrenny Street | SA73 1TB SA73 1TD |
| Mayfield Road | SA73 1UH |
| Mills Drive | SA73 1PH |
| Neyland | SA73 1RW |
| Neyland Hill | SA73 1SL |
| Neyland Terrace | SA73 1PP |
| Osborn Close | SA73 1SZ |
| Osborne Park | SA73 1SX |
| Picton Road | SA73 1PX SA73 1QR |
| Poppy Drive | SA73 1SF |
| Primrose Close | SA73 1SG |
| Promenade Close | SA73 1QG |
| Queen Elizabeth Avenue | SA73 1TU |
| Railway Terrace | SA73 1SP |
| Riga Avenue | SA73 1TT |
| Rumsey Drive | SA73 1QQ |
| School Lane | SA73 1GA |
| Scurlock Drive | SA73 1PJ |
| Sidney Webb Close | SA73 1UB |
| Sports Way | SA73 1SU SA73 1SY |
| Springfield Avenue | SA73 1TW |
| Springfield Close | SA73 1UF |
| St Annes Place | SA73 1UA |
| St Clements Road | SA73 1SH |
| The Promenade | SA73 1QE |
| Trafalgar Terrace | SA73 1QB |
| Westfield Drive | SA73 1SB |
| Windsor Gardens | SA73 1TA |
| Wood Lane | SA73 1RB |
Transport near Neyland: East
-
Pembroke Dock Station
-
Pembroke Station
-
Johnston (Dyfed) Station
-
Milford Haven Station
-
Lamphey Station
- FAQ
- Price Paid By Year
- Property Type Price
Frequently asked questions about Neyland: East
What is the average price for a property for sale in Neyland: East?
The average price for a property for sale in Neyland: East is £189,952. This amount is 0.45% higher than the average price in Milford Haven. There are 302 property listings for sale in Neyland: East.
What streets have the most expensive properties for sale in Neyland: East?
The streets with the most expensive properties for sale in Neyland: East are Osborne Park at an average of £345,000, Westfield Drive at an average of £307,416 and Picton Road at an average of £300,125.
What streets have the most affordable properties for sale in Neyland: East?
The streets with the most affordable properties for sale in Neyland: East are Queen Elizabeth Avenue at an average of £138,375, College Park at an average of £139,000 and Frederick Street at an average of £139,800.
Which train stations are available in or near Neyland: East?
Some of the train stations available in or near Neyland: East are Pembroke Dock, Pembroke and Johnston (Dyfed).
Property Price Paid in Neyland: East by Year
The average sold property price by year was:
| Year | Average Sold Price | Price Change |
Sold Properties
|
|---|---|---|---|
| 2025 | £173,231 | -18% |
21 Properties |
| 2024 | £204,551 | 7% |
33 Properties |
| 2023 | £189,996 | 2% |
41 Properties |
| 2022 | £186,272 | 3% |
36 Properties |
| 2021 | £181,058 | 17% |
52 Properties |
| 2020 | £149,810 | 1% |
28 Properties |
| 2019 | £148,831 | 1% |
30 Properties |
| 2018 | £148,033 | 18% |
45 Properties |
| 2017 | £121,652 | 6% |
41 Properties |
| 2016 | £113,956 | -15% |
23 Properties |
| 2015 | £131,071 | -12% |
50 Properties |
| 2014 | £147,105 | -2% |
28 Properties |
| 2013 | £149,996 | 11% |
28 Properties |
| 2012 | £132,787 | -8% |
24 Properties |
| 2011 | £143,145 | -13% |
24 Properties |
| 2010 | £162,428 | 11% |
26 Properties |
| 2009 | £143,750 | -11% |
18 Properties |
| 2008 | £160,059 | -2% |
33 Properties |
| 2007 | £162,617 | 7% |
58 Properties |
| 2006 | £151,430 | 16% |
64 Properties |
| 2005 | £127,721 | -0,4% |
57 Properties |
| 2004 | £128,275 | 26% |
53 Properties |
| 2003 | £94,886 | 28% |
75 Properties |
| 2002 | £68,481 | 12% |
66 Properties |
| 2001 | £60,069 | 9% |
76 Properties |
| 2000 | £54,850 | 10% |
58 Properties |
| 1999 | £49,422 | 12% |
43 Properties |
| 1998 | £43,606 | -9% |
39 Properties |
| 1997 | £47,655 | 9% |
45 Properties |
| 1996 | £43,291 | -1% |
42 Properties |
| 1995 | £43,627 | - |
32 Properties |
Property Price per Property Type in Neyland: East
Here you can find historic sold price data in order to help with your property search.
The average Property Paid Price for specific property types in the last three years are:
| Property Type | Average Sold Price | Sold Properties |
|---|---|---|
| Semi Detached House | £170,931.00 | 22 Semi Detached Houses |
| Detached House | £273,376.00 | 31 Detached Houses |
| Terraced House | £169,303.00 | 71 Terraced Houses |
| Flat | £89,714.00 | 7 Flats |

