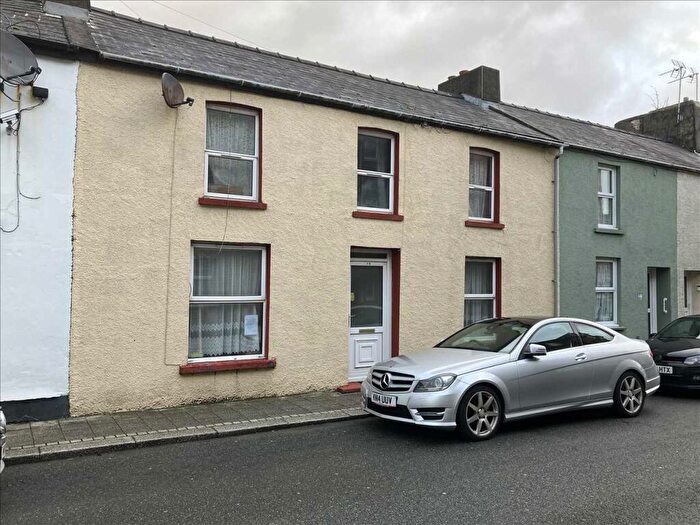
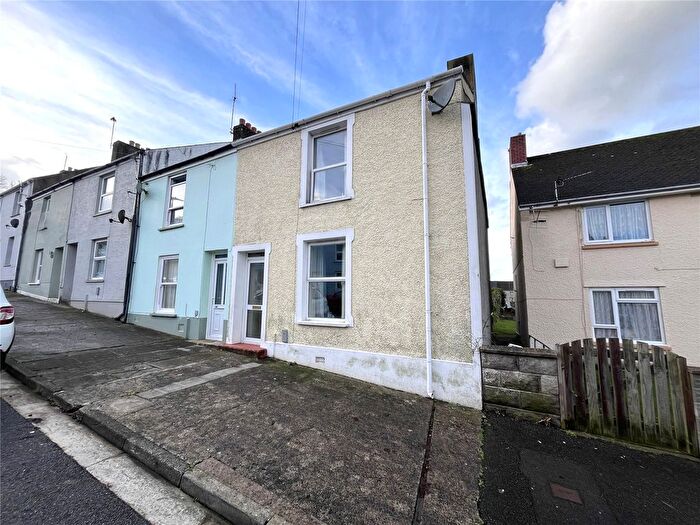
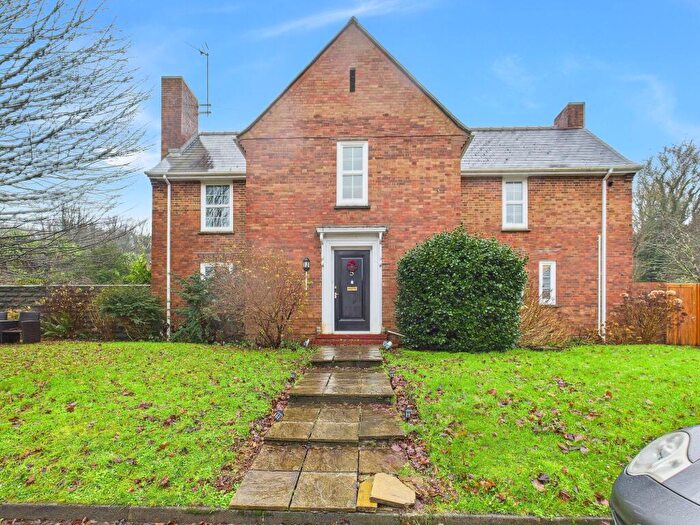
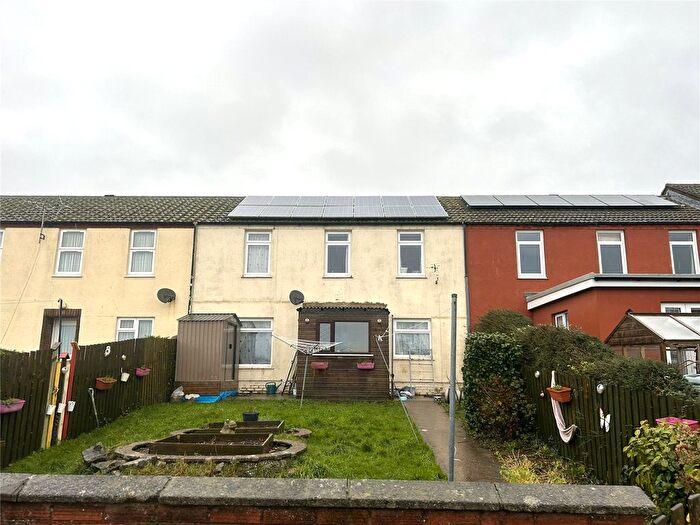
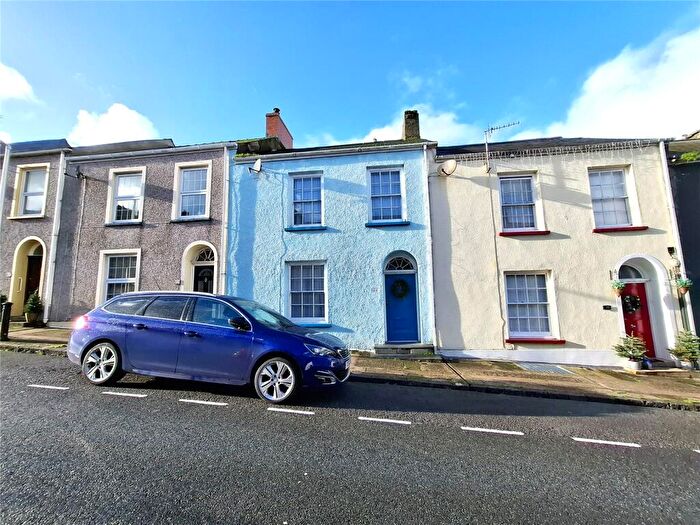
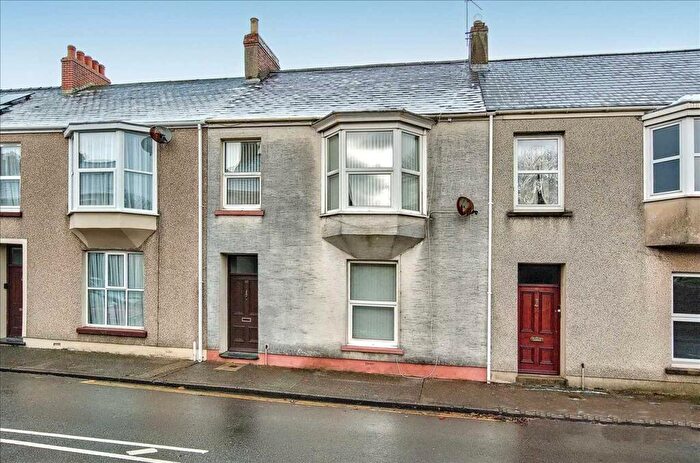
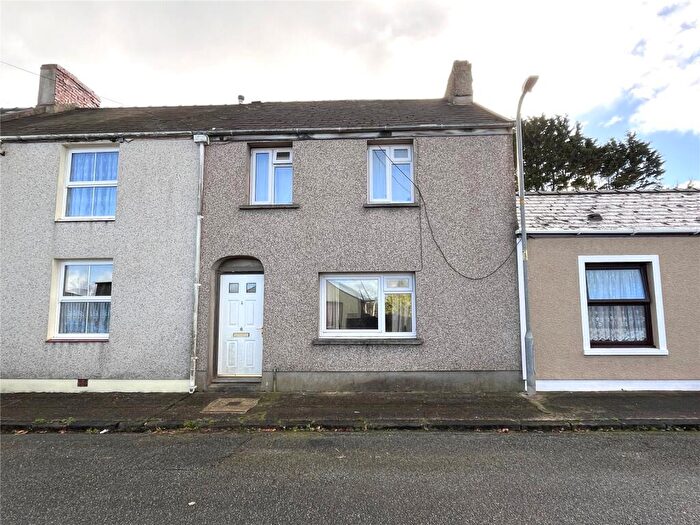
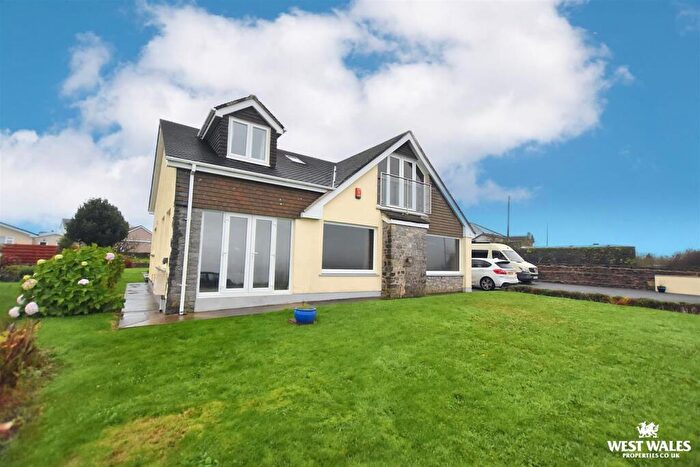
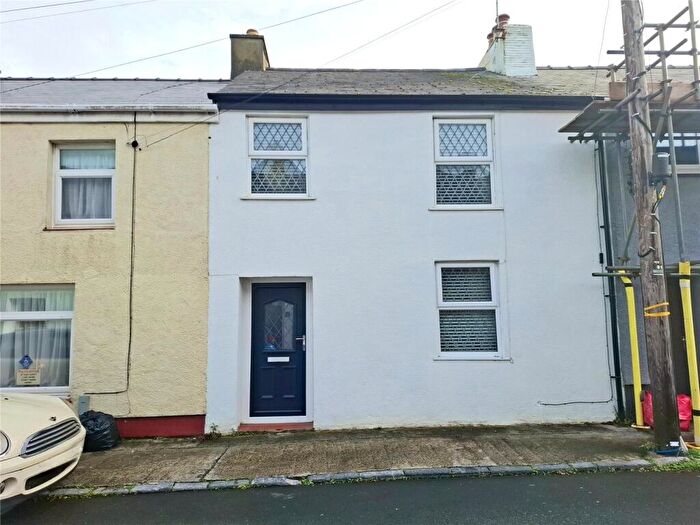
Houses for sale & to rent in Pembroke Dock: Market, Pembroke Dock
House Prices in Pembroke Dock: Market
Properties in Pembroke Dock: Market have an average house price of £155,484.00 and had 170 Property Transactions within the last 3 years¹.
Pembroke Dock: Market is an area in Pembroke Dock, Sir Benfro - Pembrokeshire with 782 households², where the most expensive property was sold for £525,000.00.
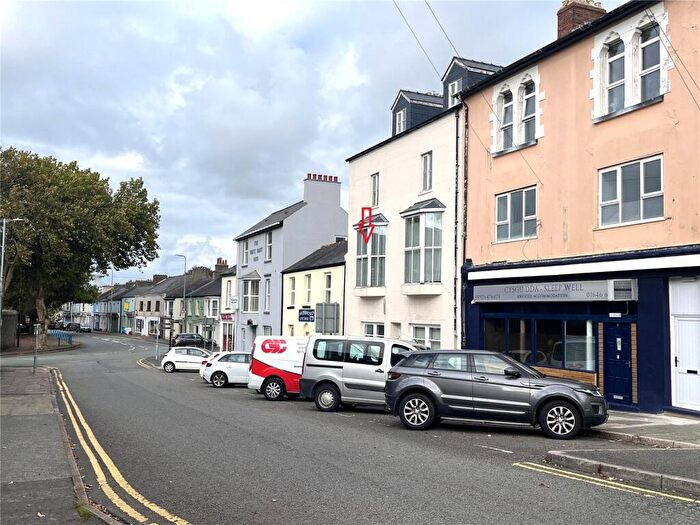
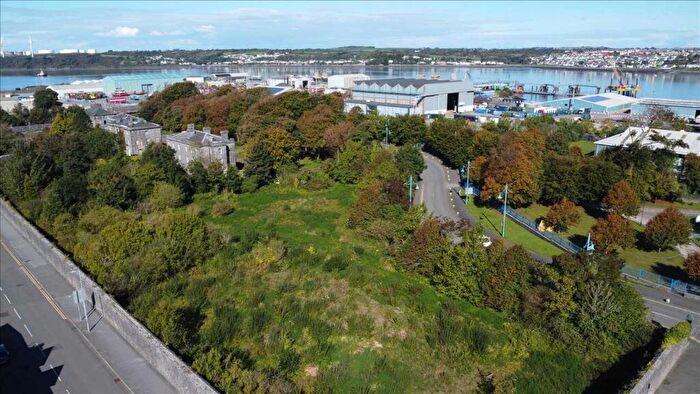
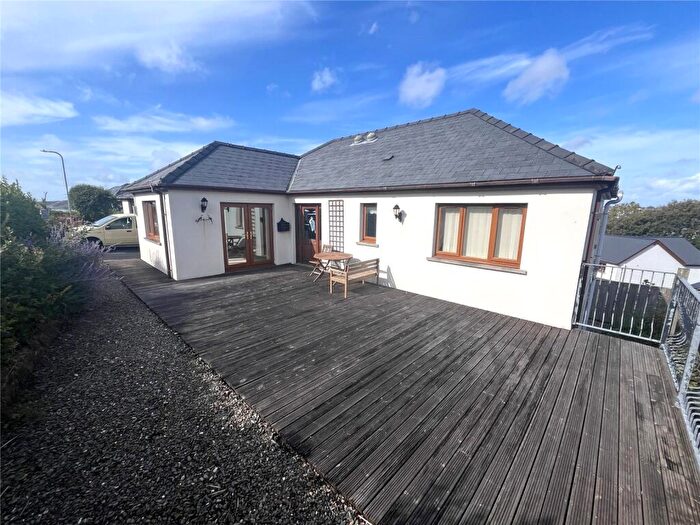
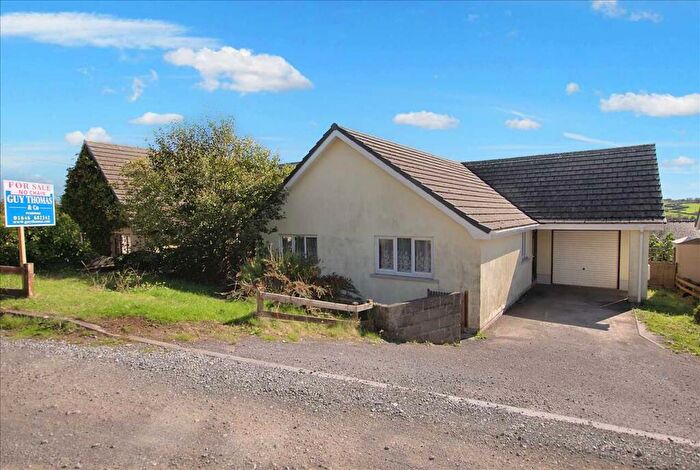
Properties for sale in Pembroke Dock: Market
Roads and Postcodes in Pembroke Dock: Market
Navigate through our locations to find the location of your next house in Pembroke Dock: Market, Pembroke Dock for sale or to rent.
| Streets | Postcodes |
|---|---|
| Admiralty Way | SA72 6WT |
| Beach Road | SA72 6TP |
| Bush Street | SA72 6AU SA72 6AW SA72 6AX SA72 6HQ |
| Catalina Avenue | SA72 6YB |
| Chapel Road | SA72 6TL |
| Charlton Place | SA72 6AY |
| Church Street | SA72 6AR |
| Co Op Lane | SA72 6XL |
| Croft Terrace | SA72 6BA |
| Cumby Terrace | SA72 6YA |
| Edgar Morgan Way | SA72 6WX |
| Fort Road | SA72 6SX SA72 6AE SA72 6SY SA72 6TH |
| Greville Court | SA72 6XF |
| Gwyther Street | SA72 6HD SA72 6HE |
| Kitchener Close | SA72 6NR |
| Laws Street | SA72 6DG SA72 6DQ |
| Market Street | SA72 6XP |
| Martello Road | SA72 6XW |
| Melville Street | SA72 6XS |
| Melville Terrace | SA72 6YG |
| Meyrick Owen Way | SA72 6WS |
| Meyrick Street | SA72 6AS SA72 6AT SA72 6UU |
| Orielton Terrace | SA72 6TN |
| Park Street | SA72 6BL |
| Park View Crescent | SA72 6BH |
| Pembroke Road | SA72 6PG |
| Pembroke Street | SA72 6XH |
| Presely View | SA72 6NP SA72 6NS |
| Princes Street | SA72 6XT |
| Prospect Place | SA72 6BB SA72 6BD |
| Southampton Row | SA72 6YE |
| St Patricks Hill | SA72 6XQ |
| Sunderland Avenue | SA72 6YD |
| The Dockyard | SA72 6TD SA72 6TE SA72 6UF |
| The Terrace | SA72 6YH |
| Victoria Road | SA72 6XJ SA72 6XU SA72 6XX SA72 6XN |
| SA72 6NT SA72 6TJ SA72 6NN |
Transport near Pembroke Dock: Market
-
Pembroke Dock Station
-
Pembroke Station
-
Lamphey Station
-
Milford Haven Station
-
Johnston (Dyfed) Station
- FAQ
- Price Paid By Year
- Property Type Price
Frequently asked questions about Pembroke Dock: Market
What is the average price for a property for sale in Pembroke Dock: Market?
The average price for a property for sale in Pembroke Dock: Market is £155,484. This amount is 7% lower than the average price in Pembroke Dock. There are 800 property listings for sale in Pembroke Dock: Market.
What streets have the most expensive properties for sale in Pembroke Dock: Market?
The streets with the most expensive properties for sale in Pembroke Dock: Market are St Patricks Hill at an average of £342,875, Park View Crescent at an average of £338,000 and Pembroke Road at an average of £325,000.
What streets have the most affordable properties for sale in Pembroke Dock: Market?
The streets with the most affordable properties for sale in Pembroke Dock: Market are Meyrick Street at an average of £67,813, Melville Street at an average of £101,000 and Pembroke Street at an average of £108,142.
Which train stations are available in or near Pembroke Dock: Market?
Some of the train stations available in or near Pembroke Dock: Market are Pembroke Dock, Pembroke and Lamphey.
Property Price Paid in Pembroke Dock: Market by Year
The average sold property price by year was:
| Year | Average Sold Price | Price Change |
Sold Properties
|
|---|---|---|---|
| 2025 | £182,680 | 11% |
25 Properties |
| 2024 | £162,000 | 24% |
24 Properties |
| 2023 | £123,590 | -56% |
77 Properties |
| 2022 | £192,294 | 20% |
44 Properties |
| 2021 | £154,045 | 9% |
47 Properties |
| 2020 | £140,589 | -23% |
24 Properties |
| 2019 | £173,580 | 19% |
25 Properties |
| 2018 | £140,431 | 9% |
30 Properties |
| 2017 | £128,431 | -11% |
22 Properties |
| 2016 | £142,398 | -5% |
32 Properties |
| 2015 | £149,270 | 15% |
22 Properties |
| 2014 | £126,767 | 3% |
26 Properties |
| 2013 | £123,456 | -0,2% |
16 Properties |
| 2012 | £123,663 | -0,5% |
18 Properties |
| 2011 | £124,280 | -4% |
21 Properties |
| 2010 | £129,167 | -12% |
26 Properties |
| 2009 | £144,313 | -12% |
19 Properties |
| 2008 | £161,356 | 11% |
15 Properties |
| 2007 | £143,737 | -2% |
36 Properties |
| 2006 | £146,448 | 5% |
42 Properties |
| 2005 | £139,485 | 14% |
37 Properties |
| 2004 | £120,295 | 34% |
41 Properties |
| 2003 | £79,062 | 7% |
42 Properties |
| 2002 | £73,358 | 34% |
36 Properties |
| 2001 | £48,225 | 0,4% |
35 Properties |
| 2000 | £48,020 | 8% |
53 Properties |
| 1999 | £44,330 | 25% |
26 Properties |
| 1998 | £33,185 | -23% |
34 Properties |
| 1997 | £40,956 | 8% |
25 Properties |
| 1996 | £37,658 | 6% |
25 Properties |
| 1995 | £35,498 | - |
14 Properties |
Property Price per Property Type in Pembroke Dock: Market
Here you can find historic sold price data in order to help with your property search.
The average Property Paid Price for specific property types in the last three years are:
| Property Type | Average Sold Price | Sold Properties |
|---|---|---|
| Semi Detached House | £166,782.00 | 14 Semi Detached Houses |
| Detached House | £306,642.00 | 28 Detached Houses |
| Terraced House | £160,563.00 | 78 Terraced Houses |
| Flat | £59,750.00 | 50 Flats |

