
Houses for sale & to rent in Lamphey, Pembroke Dock
House Prices in Lamphey
Properties in Lamphey have an average house price of £311,551.00 and had 29 Property Transactions within the last 3 years¹.
Lamphey is an area in Pembroke Dock, Sir Benfro - Pembrokeshire with 319 households², where the most expensive property was sold for £587,000.00.
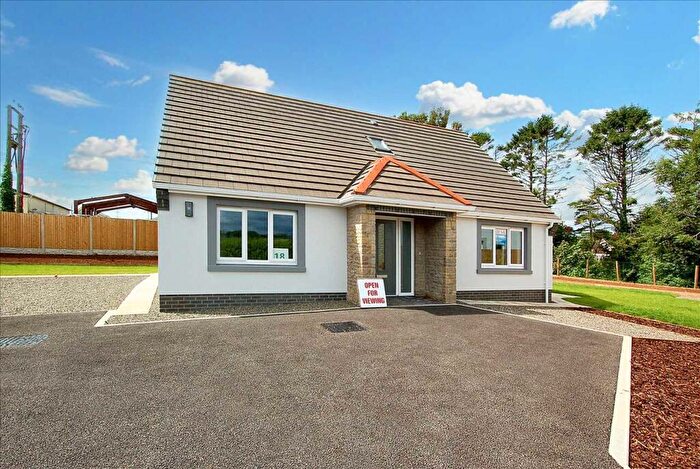
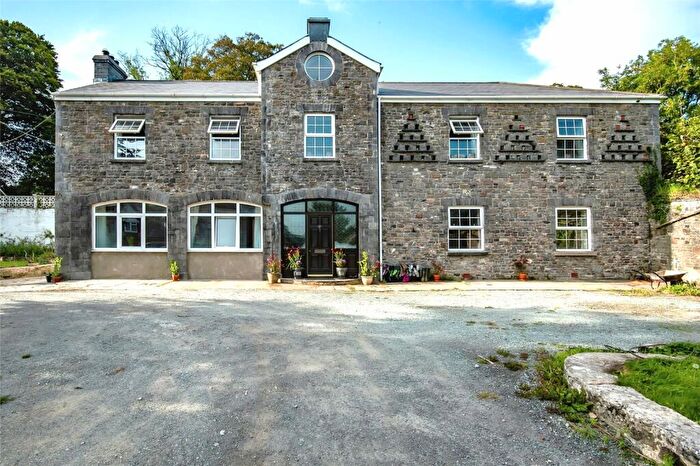
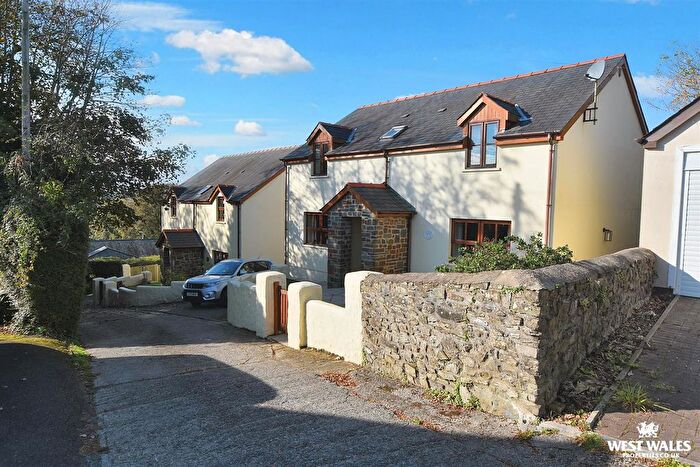
Properties for sale in Lamphey
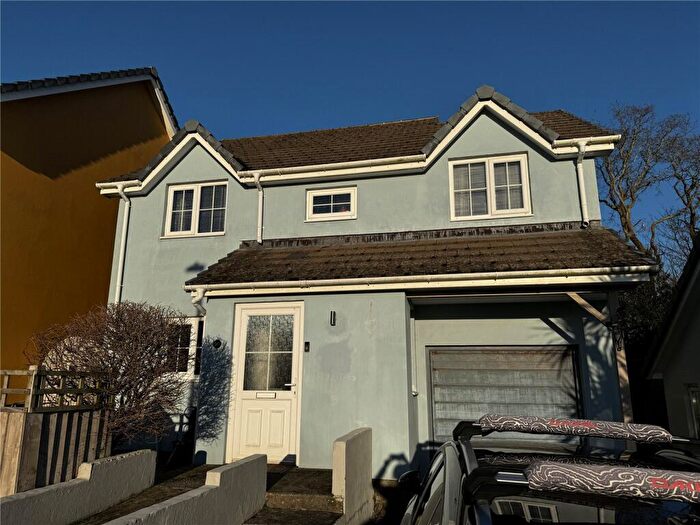

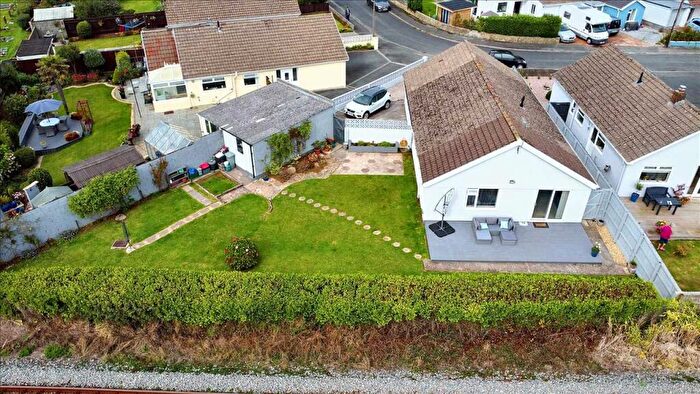
![]()
If you are looking to sell your house, let it out, or receive a property valuation, an expert can help you.
Click the button below to get started.
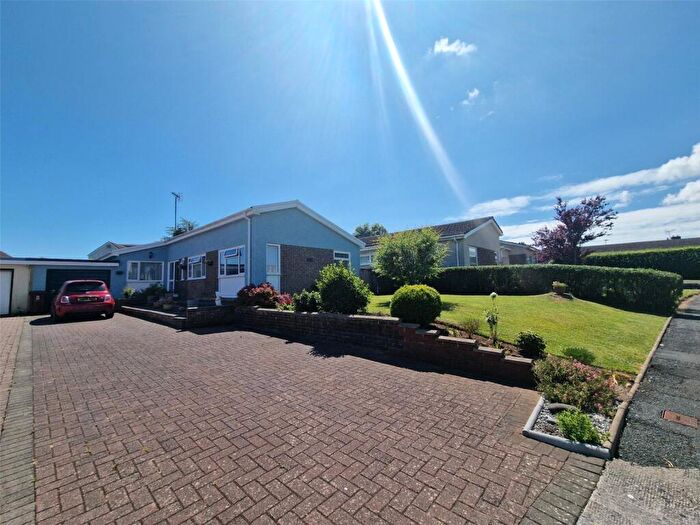
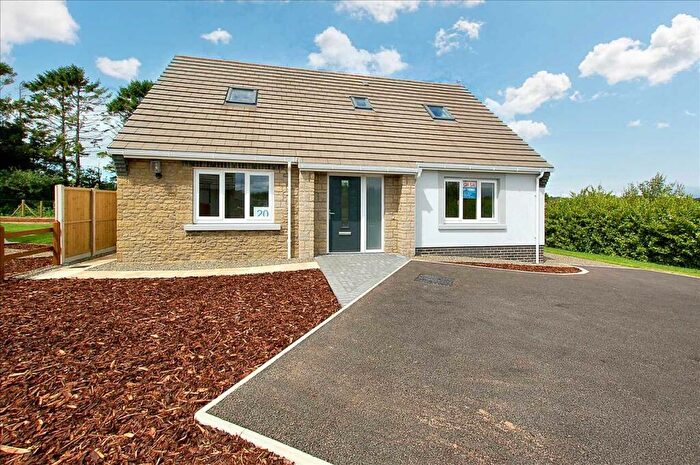

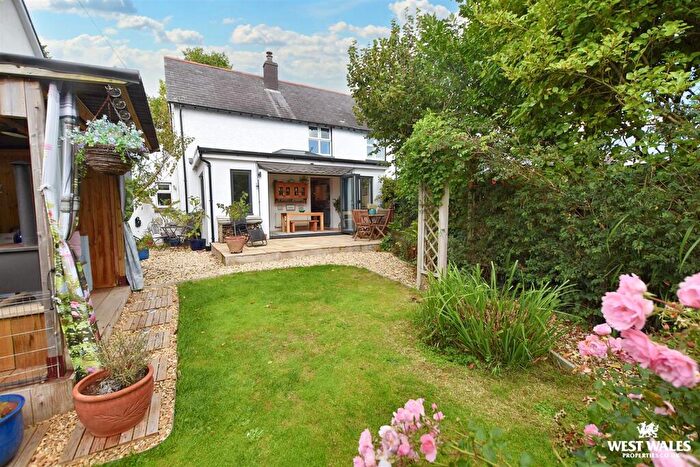
Previously listed properties in Lamphey
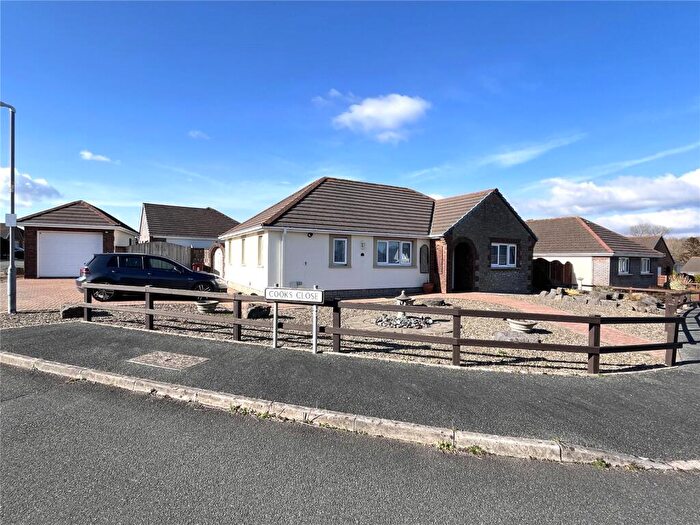
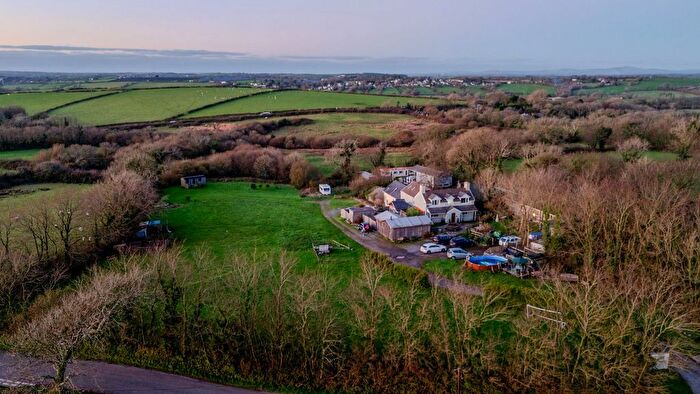
![]()
If you are looking to sell your house, let it out, or receive a property valuation, an expert can help you.
Click the button below to get started.
Roads and Postcodes in Lamphey
Navigate through our locations to find the location of your next house in Lamphey, Pembroke Dock for sale or to rent.
| Streets | Postcodes |
|---|---|
| Fosse Way | SA72 4UA |
| Lane Head | SA72 4TT |
| Michael's Walk | SA72 4UR |
| Slade Cross | SA72 4RY |
| Stoops Lake | SA72 4SN |
| The Garth | SA72 4UB |
| The Pound | SA72 4UF |
| West Haven Estate | SA72 4UL |
| West Park | SA72 4US |
| Woodfield Grove | SA72 4UE |
| SA72 4SB SA72 4SF SA72 4SL SA72 4SR SA72 4SS SA72 4SU SA72 4SX SA72 4TU SA72 4TX SA72 4TY SA72 4UD SA72 4UG SA72 4UH SA72 4UJ SA72 4UN SA72 4UQ SA72 4UW SA72 4RX SA72 4SA SA72 4SD SA72 4SE SA72 4TZ SA72 4UP |
Transport near Lamphey

- FAQ
- Price Paid By Year
- Property Type Price
Frequently asked questions about Lamphey
What is the average price for a property for sale in Lamphey?
The average price for a property for sale in Lamphey is £311,551. This amount is 87% higher than the average price in Pembroke Dock. There are 274 property listings for sale in Lamphey.
What streets have the most expensive properties for sale in Lamphey?
The streets with the most expensive properties for sale in Lamphey are Michael's Walk at an average of £530,000 and West Haven Estate at an average of £258,666.
What streets have the most affordable properties for sale in Lamphey?
The street with the most affordable properties for sale in Lamphey is Woodfield Grove at an average of £227,000.
Which train stations are available in or near Lamphey?
Some of the train stations available in or near Lamphey are Pembroke, Lamphey and Pembroke Dock.
Property Price Paid in Lamphey by Year
The average sold property price by year was:
| Year | Average Sold Price | Price Change |
Sold Properties
|
|---|---|---|---|
| 2025 | £242,000 | -13% |
5 Properties |
| 2024 | £273,428 | -32% |
7 Properties |
| 2023 | £361,285 | 6% |
7 Properties |
| 2022 | £338,200 | -2% |
10 Properties |
| 2021 | £346,062 | 17% |
16 Properties |
| 2020 | £286,245 | -12% |
10 Properties |
| 2019 | £321,961 | 30% |
13 Properties |
| 2018 | £223,896 | 12% |
22 Properties |
| 2017 | £196,555 | -38% |
9 Properties |
| 2016 | £272,206 | 28% |
13 Properties |
| 2015 | £197,105 | 6% |
19 Properties |
| 2014 | £185,416 | -29% |
6 Properties |
| 2013 | £239,600 | 6% |
10 Properties |
| 2012 | £224,137 | 29% |
8 Properties |
| 2011 | £159,750 | -37% |
3 Properties |
| 2010 | £219,072 | -59% |
11 Properties |
| 2009 | £347,277 | 9% |
9 Properties |
| 2008 | £316,195 | 8% |
10 Properties |
| 2007 | £291,300 | 10% |
10 Properties |
| 2006 | £262,883 | 23% |
15 Properties |
| 2005 | £202,777 | -7% |
9 Properties |
| 2004 | £216,079 | 52% |
12 Properties |
| 2003 | £103,196 | 4% |
32 Properties |
| 2002 | £98,957 | 3% |
14 Properties |
| 2001 | £95,545 | 19% |
10 Properties |
| 2000 | £77,392 | -5% |
14 Properties |
| 1999 | £81,340 | -33% |
11 Properties |
| 1998 | £108,166 | 34% |
9 Properties |
| 1997 | £70,900 | 16% |
5 Properties |
| 1996 | £59,590 | -10% |
5 Properties |
| 1995 | £65,375 | - |
8 Properties |
Property Price per Property Type in Lamphey
Here you can find historic sold price data in order to help with your property search.
The average Property Paid Price for specific property types in the last three years are:
| Property Type | Average Sold Price | Sold Properties |
|---|---|---|
| Semi Detached House | £248,333.00 | 9 Semi Detached Houses |
| Terraced House | £278,000.00 | 4 Terraced Houses |
| Detached House | £355,500.00 | 16 Detached Houses |