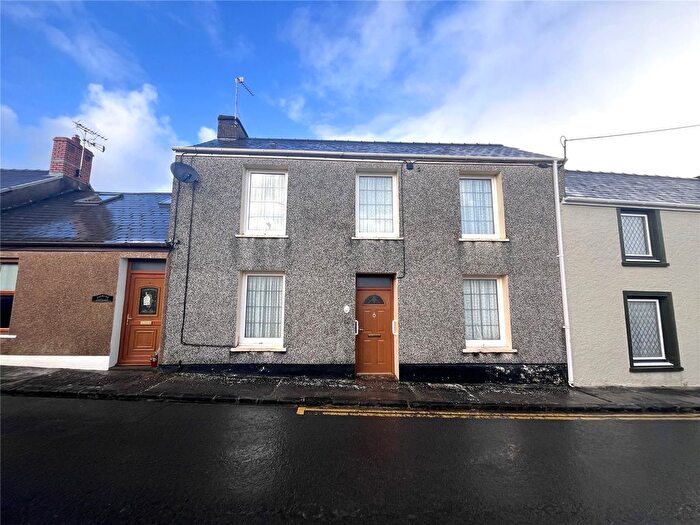
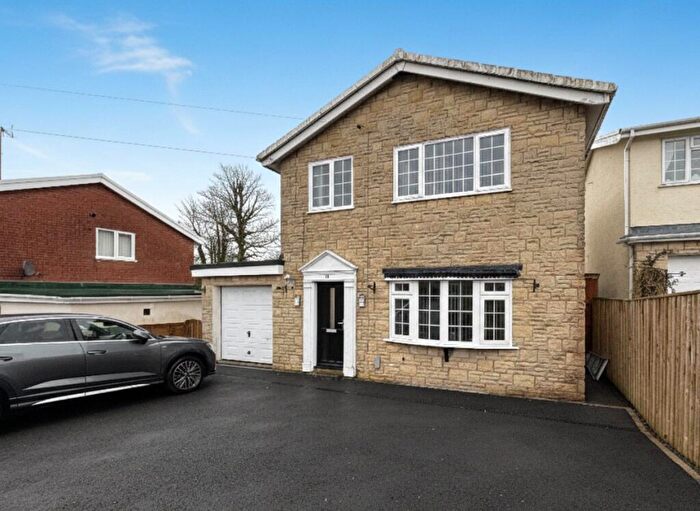
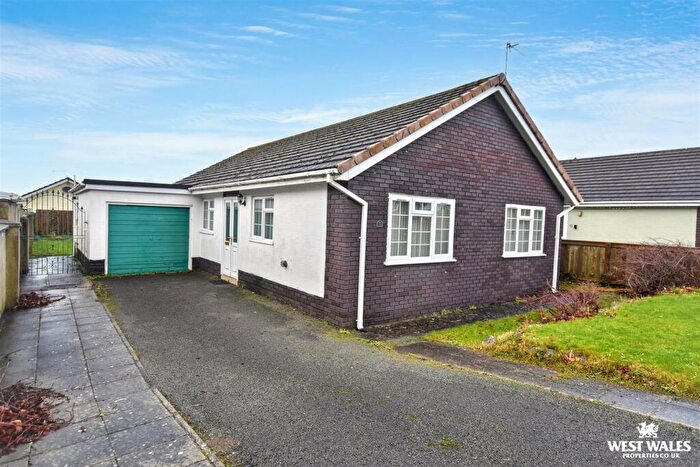
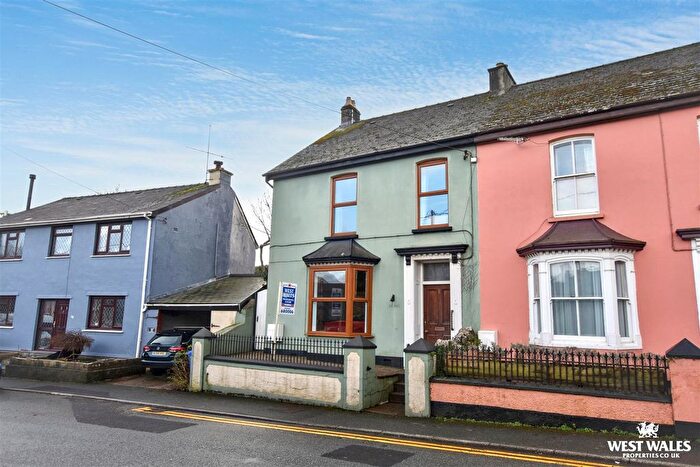
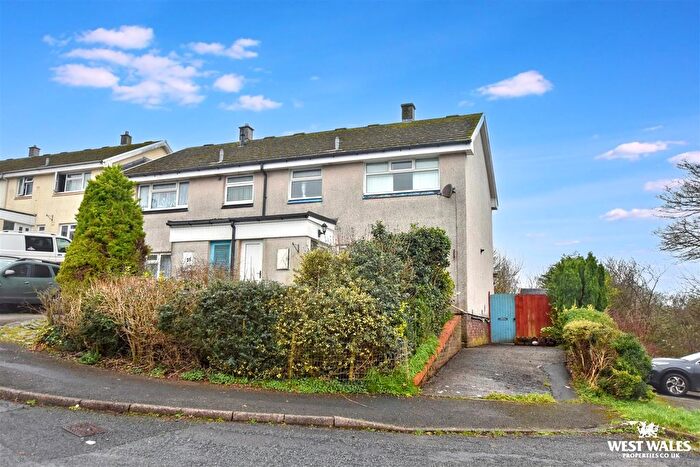
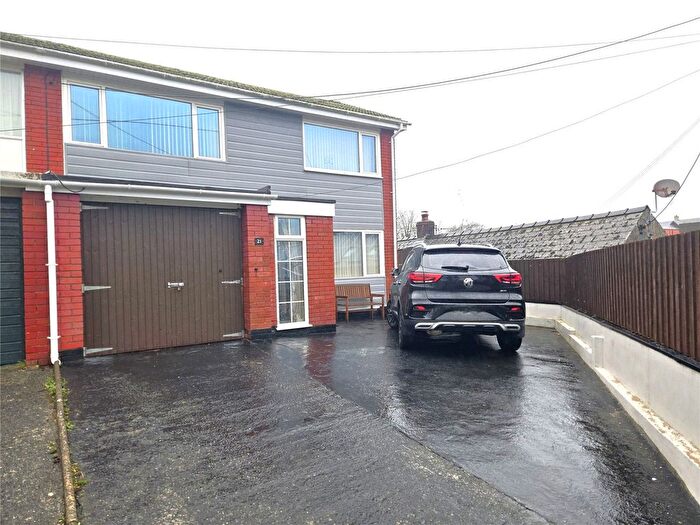
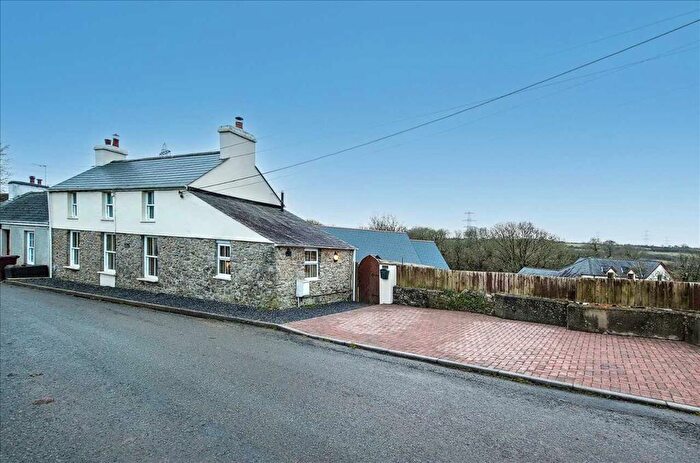
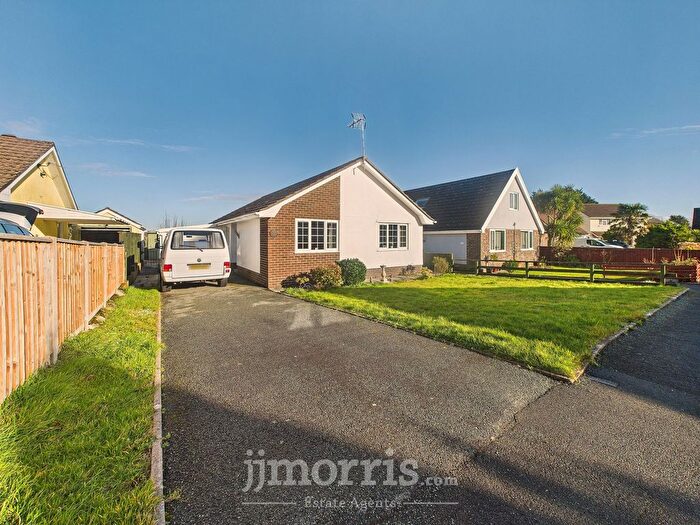
Houses for sale & to rent in Pembroke: St. Michael, Pembroke
House Prices in Pembroke: St. Michael
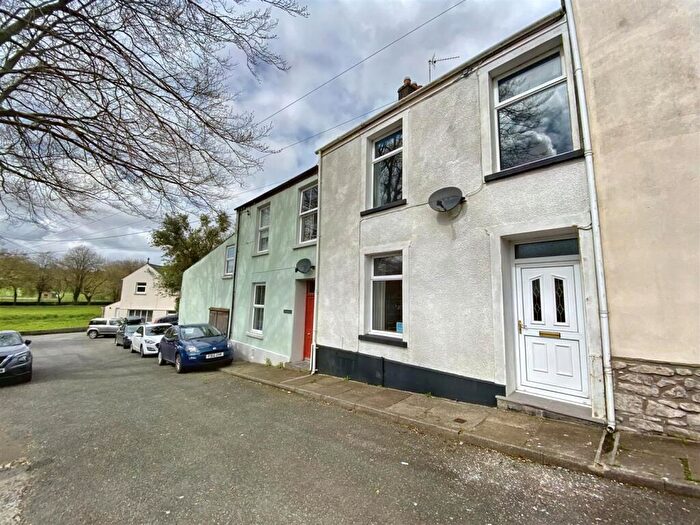
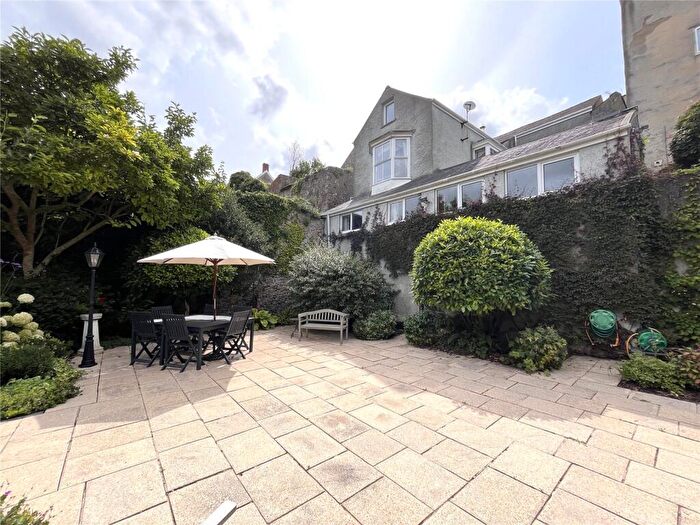
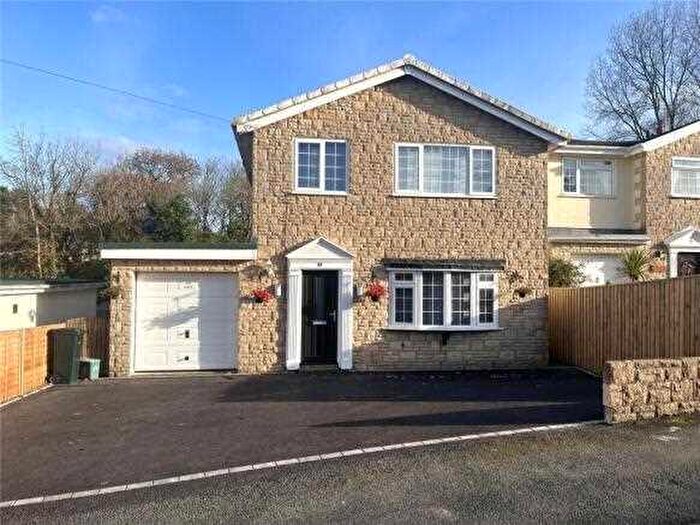
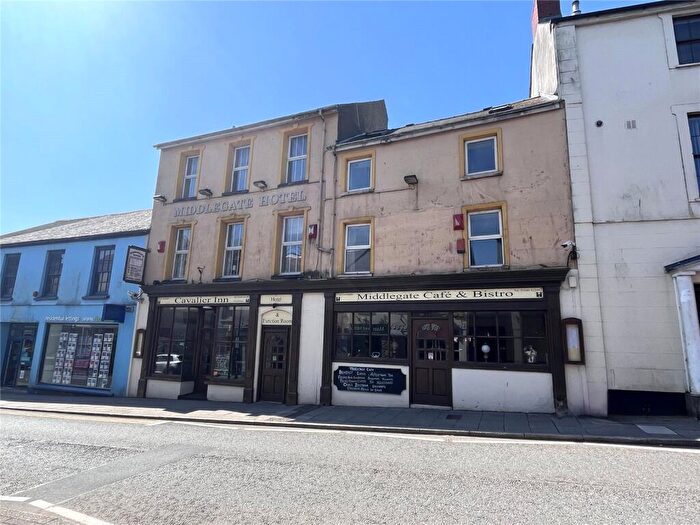
Properties in Pembroke: St. Michael have an average house price of £250,327.00 and had 119 Property Transactions within the last 3 years¹.
Pembroke: St. Michael is an area in Pembroke, Sir Benfro - Pembrokeshire with 1,084 households², where the most expensive property was sold for £510,000.00.
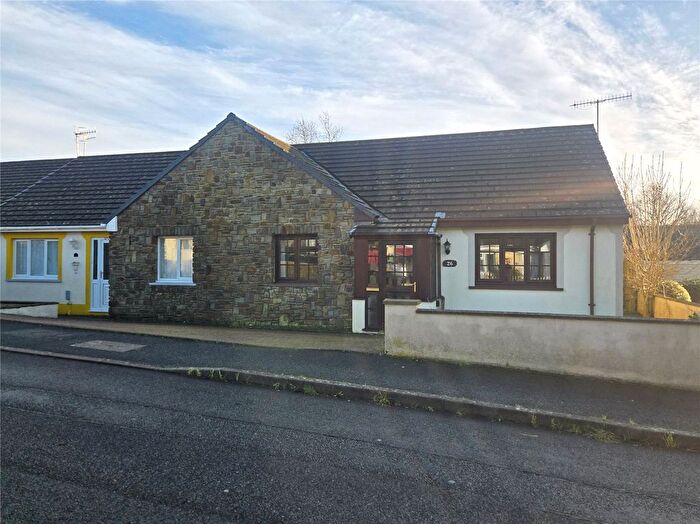
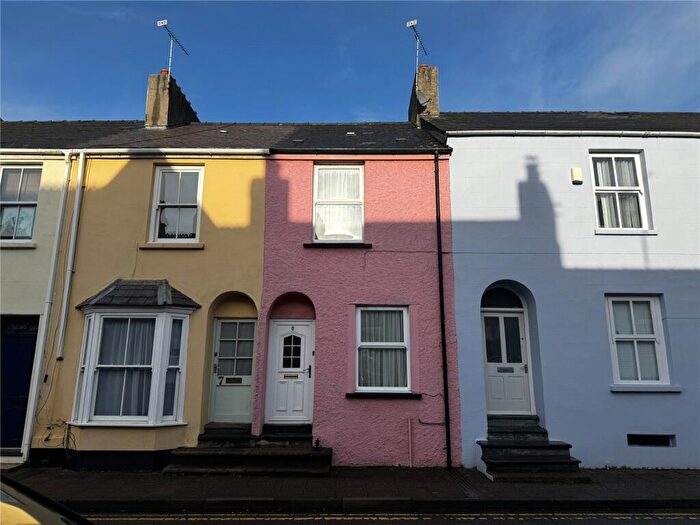
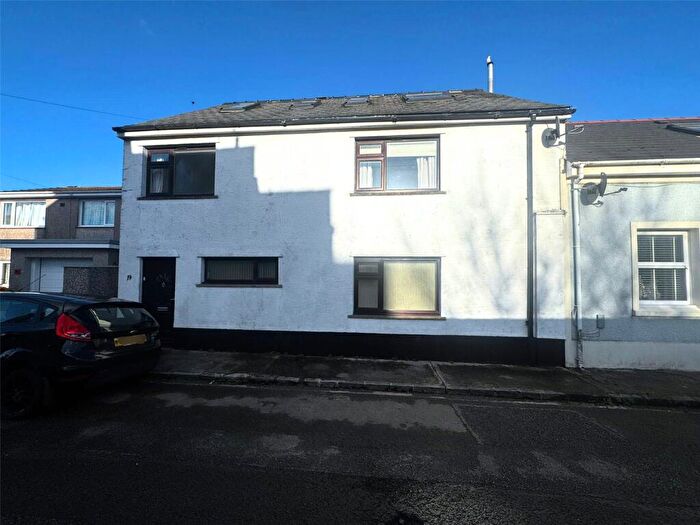
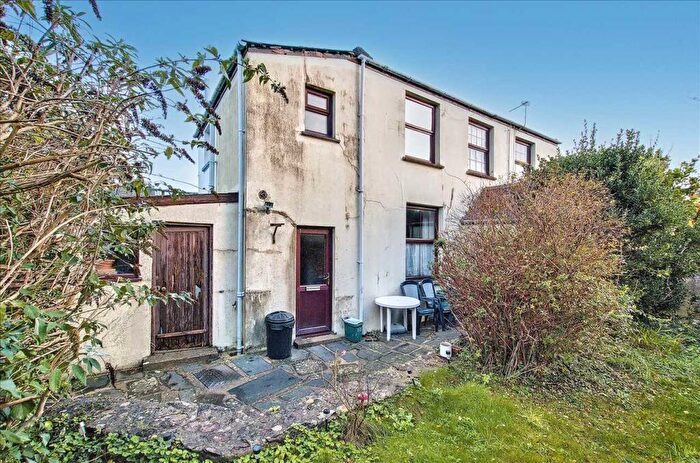
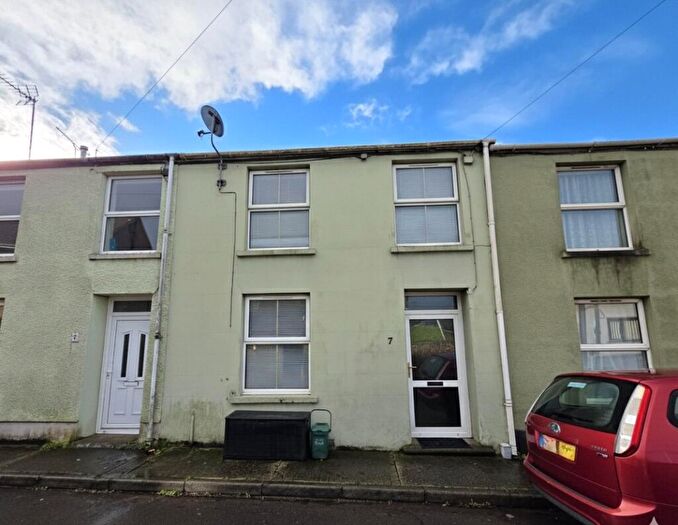
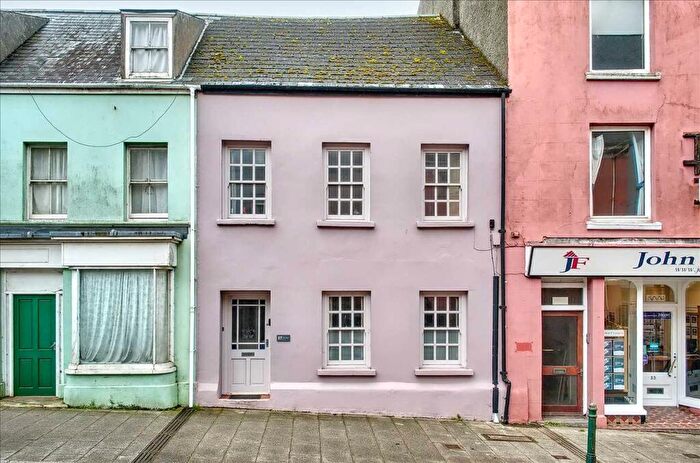
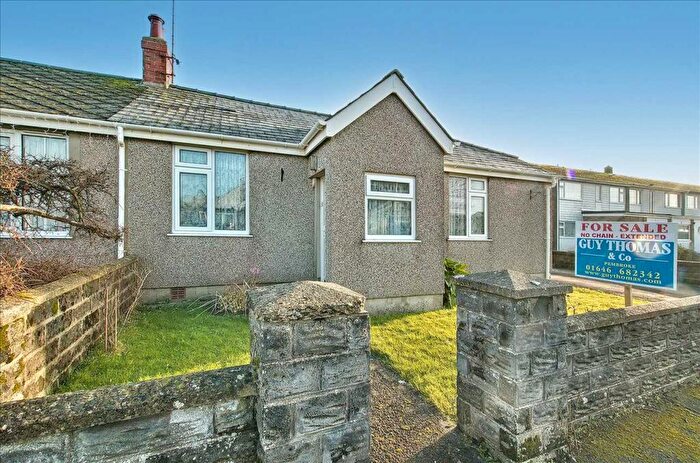
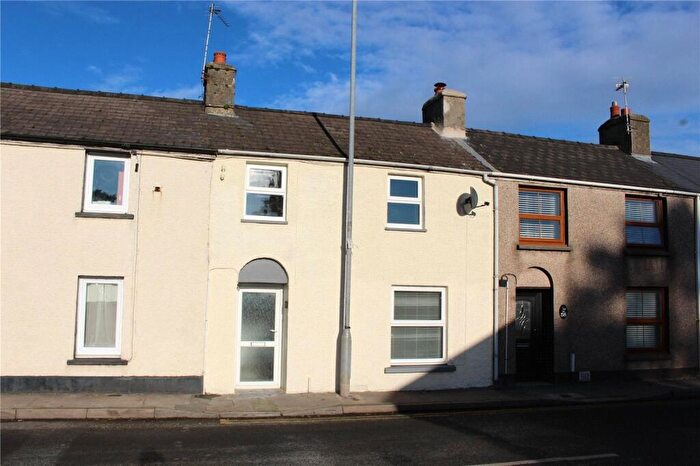
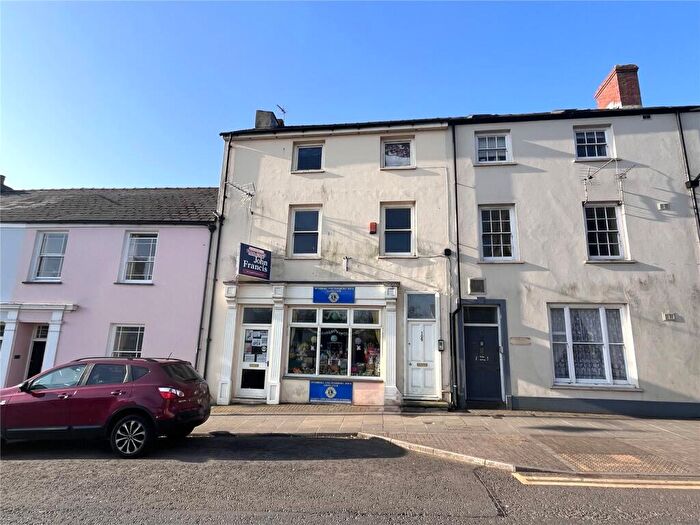
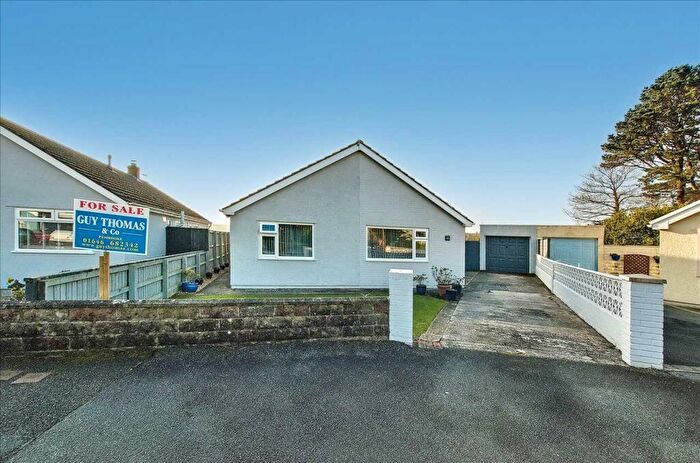
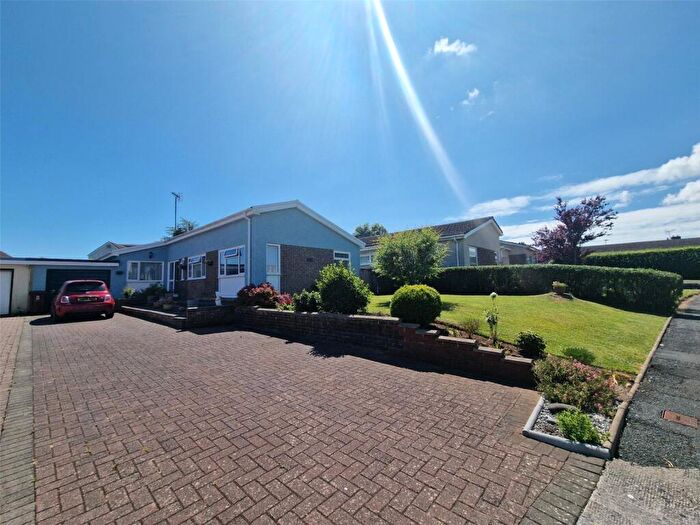
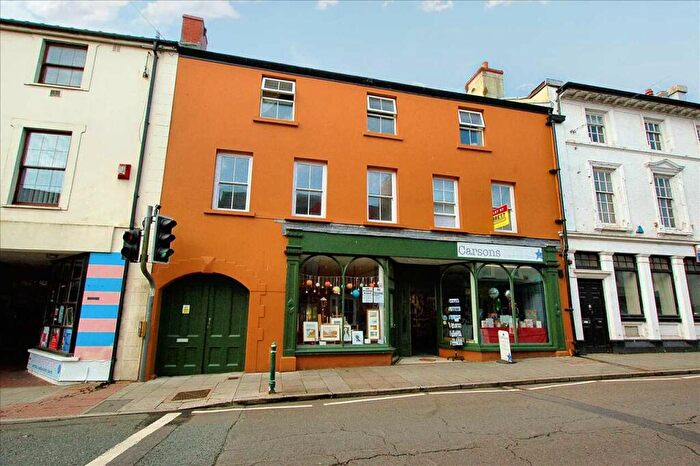
Properties for sale in Pembroke: St. Michael
Roads and Postcodes in Pembroke: St. Michael
Navigate through our locations to find the location of your next house in Pembroke: St. Michael, Pembroke for sale or to rent.
| Streets | Postcodes |
|---|---|
| Ashleigh Gardens | SA71 4AR |
| Belmont Terrace | SA71 4AD |
| Bengal Villas | SA71 4BH |
| Bishops Lane | SA71 5JN |
| Bishops Park | SA71 5JP |
| Callans Drive | SA71 5JB |
| Charles Road | SA71 4AX |
| Cooks Close | SA71 5JD |
| Crick Marren Close | SA71 5LQ |
| Croeso Road | SA71 4AU |
| First Lane | SA71 4BB |
| Fourth Lane | SA71 5JE |
| Freemans Walk | SA71 4AS |
| Froynes Terrace | SA71 4AA |
| Gibbas Way | SA71 5JA SA71 5JF |
| Grove Bridge | SA71 4DN SA71 4DL |
| Grove Court Mews | SA71 5PF |
| Grove Drive | SA71 5QB |
| Grove Gardens | SA71 5BQ |
| Grove Hill | SA71 5PS SA71 5PT |
| Grove Way | SA71 5QH |
| Highgate | SA71 5QY |
| Holyland Drive | SA71 4BG |
| Holyland Road | SA71 4BD SA71 4BJ SA71 4BL SA71 5PP |
| Honeyhill Grove | SA71 5NA |
| Kingsbridge Drive | SA71 4BE |
| Lords Meadow View | SA71 4BA |
| Lower Lamphey Road | SA71 4AB SA71 4AE SA71 4AF SA71 5NJ |
| Lowless Close | SA71 5QL |
| Margarets Way | SA71 5JZ |
| Merlins Cross | SA71 4AG |
| Nicholls Road | SA71 5JW |
| Orange Way | SA71 4DP |
| Orchard Buildings | SA71 4AN |
| Orchard Gardens | SA71 4AZ |
| Ropewalk Terrace | SA71 4AP |
| Rowlands Way | SA71 5QG |
| Southdown Close | SA71 5QJ |
| St Daniels Drive | SA71 5QQ |
| St Davids Road | SA71 5JH |
| St Michaels Road | SA71 5JG SA71 5JQ |
| St Petrox Close | SA71 5QW |
| St Twynnells Close | SA71 5PZ |
| Station Road | SA71 4AH SA71 4AW |
| The Grove | SA71 5BP |
| Tudor Close | SA71 5QD |
| Two Penny Hay Close | SA71 4BW |
| Upper Lamphey Road | SA71 4AT SA71 5JJ SA71 5JL SA71 4AY |
| Vicarage Fields | SA71 4AQ |
| Wades Close | SA71 4BN |
| Well Hill | SA71 4DH SA71 4DJ |
| Wheelers Way | SA71 5QN |
| Wrench Close | SA71 5QE |
| SA71 5NH SA71 5PN SA71 5PR SA71 5PU SA71 5PX SA71 5PY SA71 5QA |
Transport near Pembroke: St. Michael
- FAQ
- Price Paid By Year
- Property Type Price
Frequently asked questions about Pembroke: St. Michael
What is the average price for a property for sale in Pembroke: St. Michael?
The average price for a property for sale in Pembroke: St. Michael is £250,327. This amount is 8% higher than the average price in Pembroke. There are 466 property listings for sale in Pembroke: St. Michael.
What streets have the most expensive properties for sale in Pembroke: St. Michael?
The streets with the most expensive properties for sale in Pembroke: St. Michael are Fourth Lane at an average of £447,000, Ashleigh Gardens at an average of £420,000 and Highgate at an average of £417,500.
What streets have the most affordable properties for sale in Pembroke: St. Michael?
The streets with the most affordable properties for sale in Pembroke: St. Michael are The Grove at an average of £97,000, Froynes Terrace at an average of £114,500 and Orchard Buildings at an average of £131,500.
Which train stations are available in or near Pembroke: St. Michael?
Some of the train stations available in or near Pembroke: St. Michael are Pembroke, Lamphey and Pembroke Dock.
Property Price Paid in Pembroke: St. Michael by Year
The average sold property price by year was:
| Year | Average Sold Price | Price Change |
Sold Properties
|
|---|---|---|---|
| 2025 | £233,678 | -7% |
28 Properties |
| 2024 | £248,996 | -5% |
44 Properties |
| 2023 | £261,492 | -0,1% |
47 Properties |
| 2022 | £261,793 | 14% |
49 Properties |
| 2021 | £225,420 | 0,4% |
68 Properties |
| 2020 | £224,581 | 5% |
45 Properties |
| 2019 | £212,414 | 6% |
48 Properties |
| 2018 | £200,339 | 5% |
59 Properties |
| 2017 | £190,990 | -4% |
64 Properties |
| 2016 | £197,832 | 6% |
56 Properties |
| 2015 | £186,388 | 9% |
54 Properties |
| 2014 | £169,665 | -9% |
73 Properties |
| 2013 | £185,553 | 1% |
37 Properties |
| 2012 | £184,204 | -0,3% |
34 Properties |
| 2011 | £184,673 | -10% |
34 Properties |
| 2010 | £202,729 | 8% |
39 Properties |
| 2009 | £185,783 | -14% |
37 Properties |
| 2008 | £211,378 | 6% |
25 Properties |
| 2007 | £198,972 | 10% |
47 Properties |
| 2006 | £179,066 | 5% |
57 Properties |
| 2005 | £170,809 | 17% |
48 Properties |
| 2004 | £142,499 | 12% |
52 Properties |
| 2003 | £125,900 | 17% |
57 Properties |
| 2002 | £104,960 | 25% |
69 Properties |
| 2001 | £78,513 | 12% |
64 Properties |
| 2000 | £68,951 | 9% |
57 Properties |
| 1999 | £62,740 | 8% |
64 Properties |
| 1998 | £57,422 | -4% |
37 Properties |
| 1997 | £59,858 | 13% |
44 Properties |
| 1996 | £52,285 | 8% |
41 Properties |
| 1995 | £48,027 | - |
27 Properties |
Property Price per Property Type in Pembroke: St. Michael
Here you can find historic sold price data in order to help with your property search.
The average Property Paid Price for specific property types in the last three years are:
| Property Type | Average Sold Price | Sold Properties |
|---|---|---|
| Semi Detached House | £202,228.00 | 36 Semi Detached Houses |
| Detached House | £302,552.00 | 62 Detached Houses |
| Terraced House | £179,475.00 | 20 Terraced Houses |
| Flat | £161,000.00 | 1 Flat |

