Houses for sale & to rent in Pembroke: St. Mary South, Pembroke
House Prices in Pembroke: St. Mary South
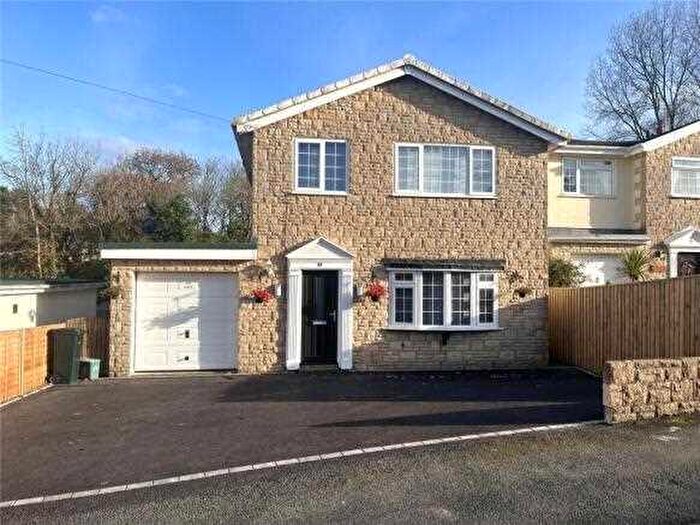
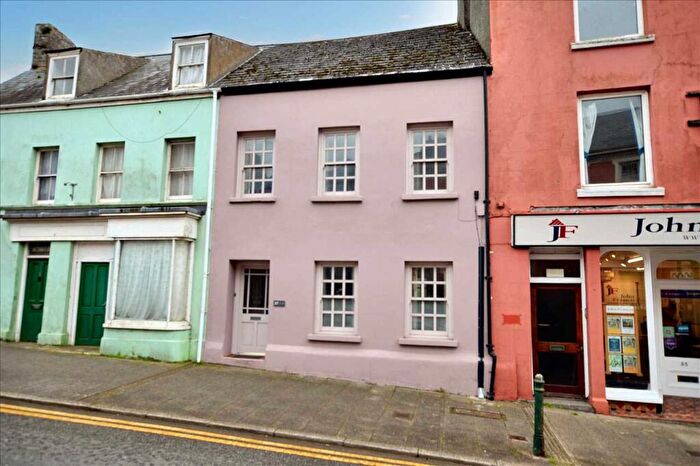
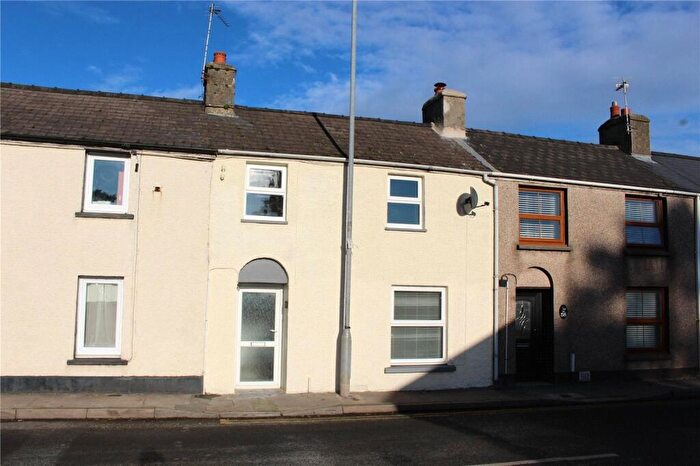
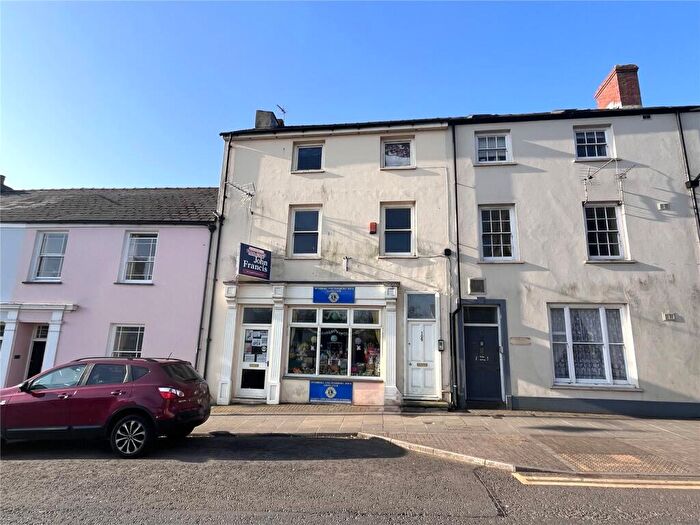
Properties in Pembroke: St. Mary South have an average house price of £179,227.00 and had 104 Property Transactions within the last 3 years¹.
Pembroke: St. Mary South is an area in Pembroke, Sir Benfro - Pembrokeshire with 700 households², where the most expensive property was sold for £600,000.00.
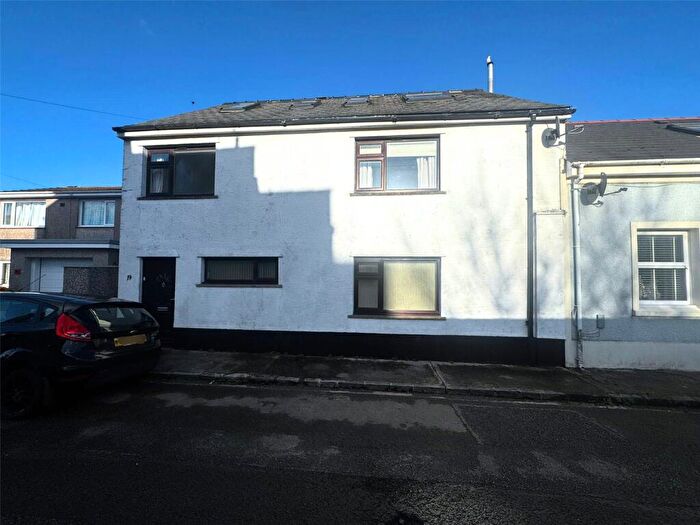
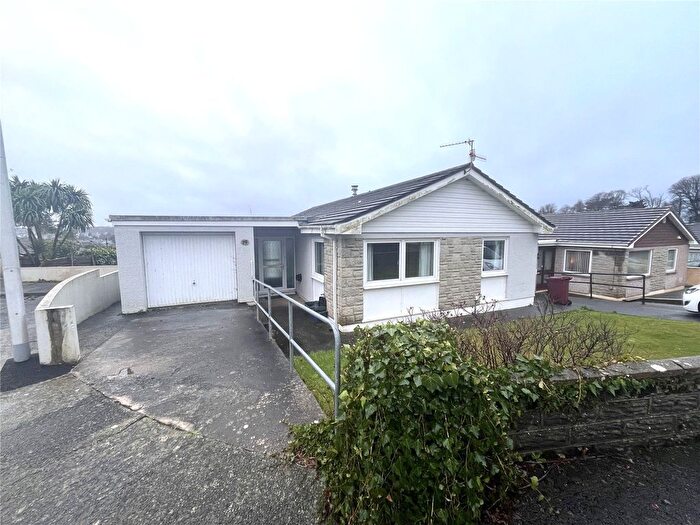
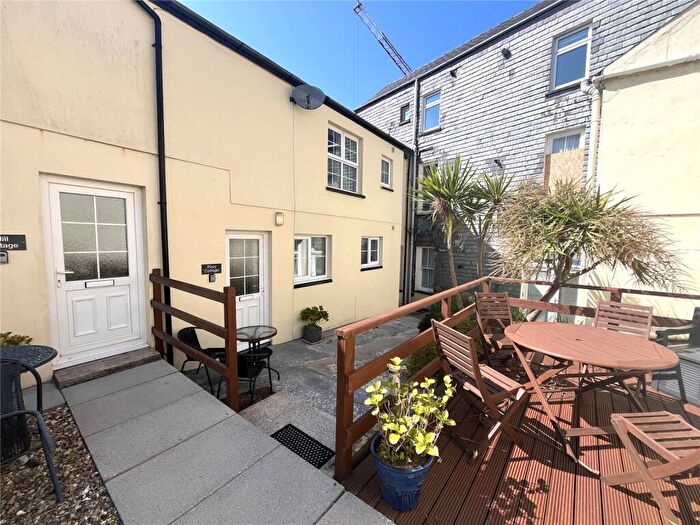
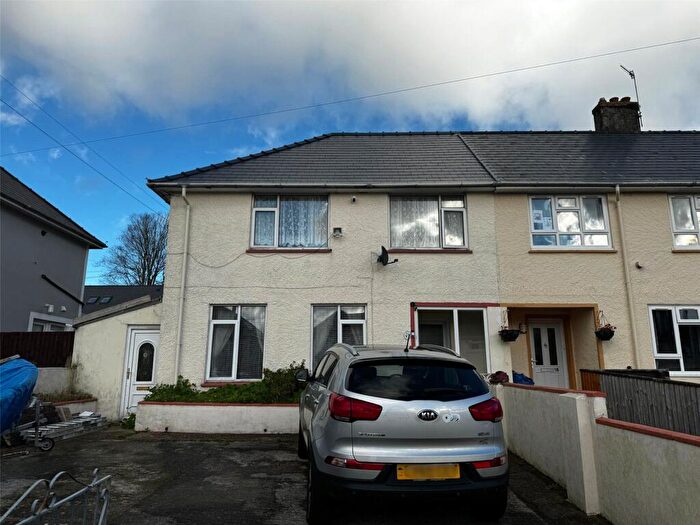
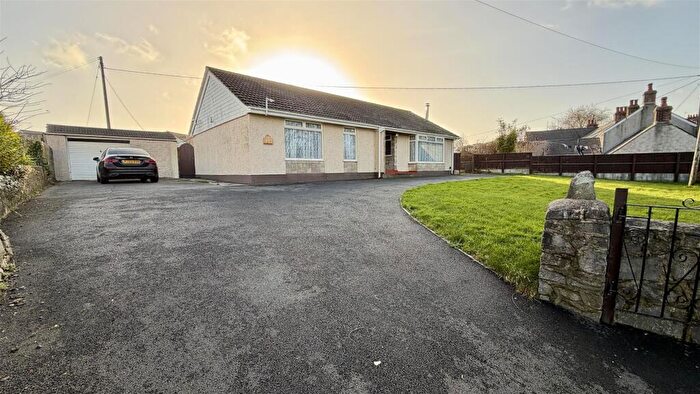
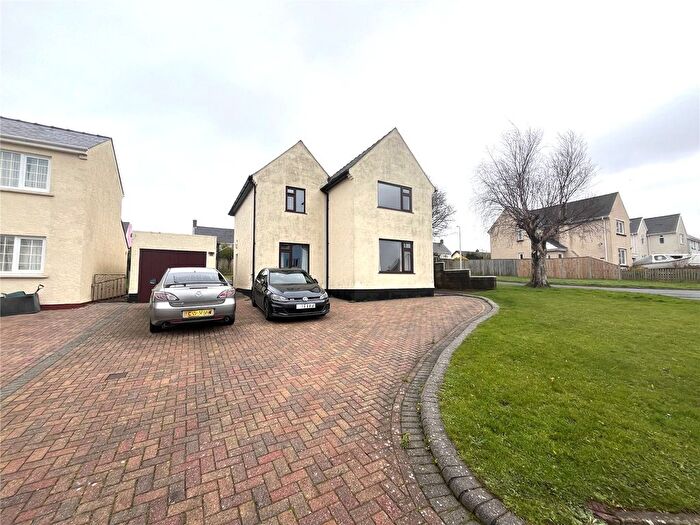
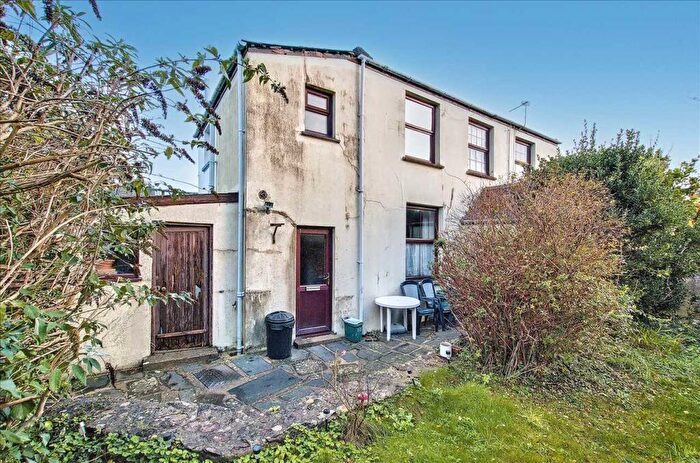
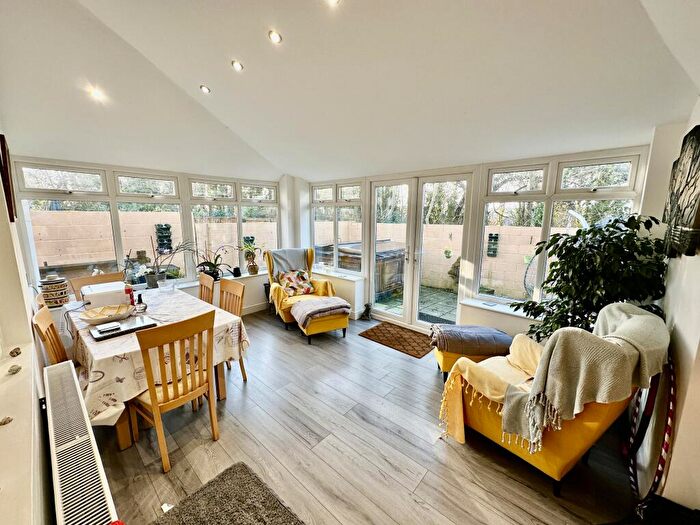
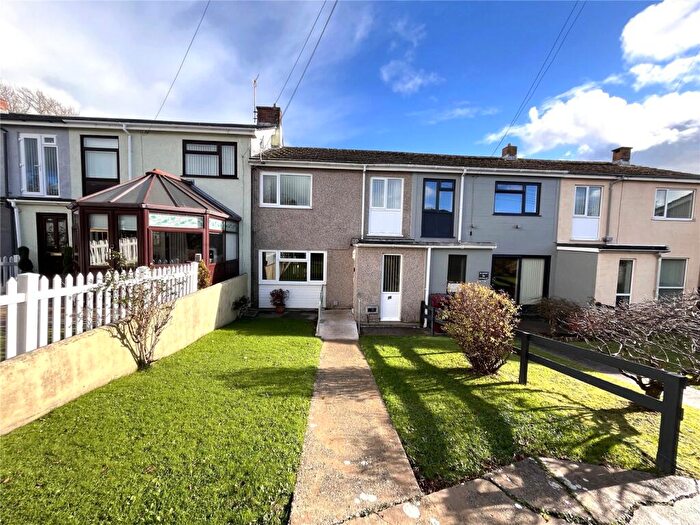
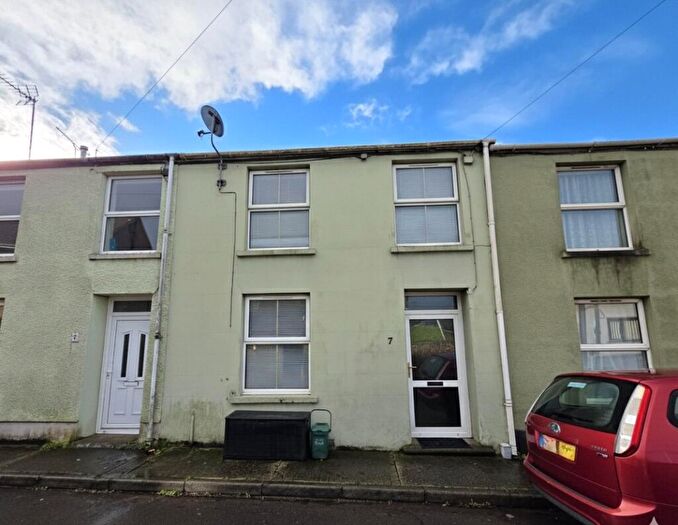
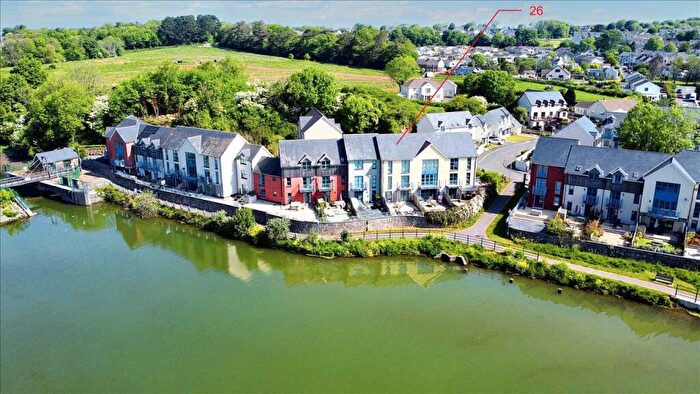
Properties for sale in Pembroke: St. Mary South
Roads and Postcodes in Pembroke: St. Mary South
Navigate through our locations to find the location of your next house in Pembroke: St. Mary South, Pembroke for sale or to rent.
| Streets | Postcodes |
|---|---|
| Adams Road | SA71 4FA |
| Bridgend Terrace | SA71 4LG SA71 4LQ |
| Brighton Mews | SA71 4HW |
| Castle Terrace | SA71 4LA |
| Commons Road | SA71 4DX SA71 4EA SA71 4EB |
| East Back | SA71 4HL |
| East End Square | SA71 4DG SA71 4DQ |
| Gooses Lane | SA71 4DT |
| Hamilton Terrace | SA71 4DE SA71 4DF |
| Harcourt Terrace | SA71 4BP |
| Hywel Way | SA71 4EF |
| Jogram Avenue | SA71 4EE |
| Lewis Terrace | SA71 4DS |
| Llewellyn Drive | SA71 4EH |
| Lloyd George Lane | SA71 4EZ |
| Main Street | SA71 4DA SA71 4DB SA71 4HH SA71 4HN SA71 4JS SA71 4NP SA71 4DW SA71 4HJ SA71 4JT SA71 4JX |
| Mansel Street | SA71 4ES |
| Merchants Park | SA71 4HD |
| New Way | SA71 4DY |
| Northgate Street | SA71 4NR |
| Orange Way | SA71 4DR |
| Owen Street | SA71 4EP |
| Paynter Street | SA71 4ED |
| Poyers Avenue | SA71 4HB |
| Rock Terrace | SA71 4DU |
| South Meadows | SA71 4EW |
| South Mews | SA71 4DZ |
| South Road | SA71 4EG SA71 4EJ SA71 4EL SA71 4EQ |
| The Parade | SA71 4LD |
| The Quay | SA71 4NT |
| Thomas Street | SA71 4EN |
| Vetch Close | SA71 4FD |
| Webbs Drive | SA71 4FB |
| West Street | SA71 4ET |
| Westgate Court | SA71 4LF |
| Westgate Hill | SA71 4LB |
| Williamson Street | SA71 4ER |
| SA71 5BT SA71 5BS |
Transport near Pembroke: St. Mary South
- FAQ
- Price Paid By Year
- Property Type Price
Frequently asked questions about Pembroke: St. Mary South
What is the average price for a property for sale in Pembroke: St. Mary South?
The average price for a property for sale in Pembroke: St. Mary South is £179,227. This amount is 21% lower than the average price in Pembroke. There are 614 property listings for sale in Pembroke: St. Mary South.
What streets have the most expensive properties for sale in Pembroke: St. Mary South?
The streets with the most expensive properties for sale in Pembroke: St. Mary South are Lloyd George Lane at an average of £320,000, Webbs Drive at an average of £292,416 and Hywel Way at an average of £285,500.
What streets have the most affordable properties for sale in Pembroke: St. Mary South?
The streets with the most affordable properties for sale in Pembroke: St. Mary South are Commons Road at an average of £102,830, The Parade at an average of £103,750 and Bridgend Terrace at an average of £128,000.
Which train stations are available in or near Pembroke: St. Mary South?
Some of the train stations available in or near Pembroke: St. Mary South are Pembroke, Pembroke Dock and Lamphey.
Property Price Paid in Pembroke: St. Mary South by Year
The average sold property price by year was:
| Year | Average Sold Price | Price Change |
Sold Properties
|
|---|---|---|---|
| 2025 | £195,900 | 2% |
15 Properties |
| 2024 | £191,887 | 7% |
33 Properties |
| 2023 | £178,519 | 12% |
26 Properties |
| 2022 | £157,580 | -4% |
30 Properties |
| 2021 | £163,405 | 5% |
38 Properties |
| 2020 | £155,390 | 16% |
16 Properties |
| 2019 | £129,897 | -7% |
34 Properties |
| 2018 | £138,857 | -2% |
32 Properties |
| 2017 | £141,689 | 14% |
25 Properties |
| 2016 | £121,904 | -9% |
21 Properties |
| 2015 | £133,414 | 5% |
27 Properties |
| 2014 | £127,331 | - |
24 Properties |
| 2013 | £127,332 | 0,5% |
26 Properties |
| 2012 | £126,696 | -19% |
30 Properties |
| 2011 | £150,871 | 5% |
16 Properties |
| 2010 | £143,639 | 11% |
14 Properties |
| 2009 | £127,159 | -30% |
11 Properties |
| 2008 | £165,192 | -9% |
13 Properties |
| 2007 | £180,421 | 31% |
28 Properties |
| 2006 | £125,255 | -6% |
29 Properties |
| 2005 | £133,357 | 5% |
41 Properties |
| 2004 | £126,876 | 21% |
37 Properties |
| 2003 | £99,795 | 12% |
41 Properties |
| 2002 | £87,702 | 23% |
44 Properties |
| 2001 | £67,675 | 12% |
45 Properties |
| 2000 | £59,229 | 10% |
39 Properties |
| 1999 | £53,421 | 13% |
23 Properties |
| 1998 | £46,509 | -18% |
22 Properties |
| 1997 | £55,029 | 16% |
24 Properties |
| 1996 | £46,128 | 6% |
19 Properties |
| 1995 | £43,370 | - |
15 Properties |
Property Price per Property Type in Pembroke: St. Mary South
Here you can find historic sold price data in order to help with your property search.
The average Property Paid Price for specific property types in the last three years are:
| Property Type | Average Sold Price | Sold Properties |
|---|---|---|
| Semi Detached House | £187,750.00 | 12 Semi Detached Houses |
| Detached House | £313,526.00 | 19 Detached Houses |
| Terraced House | £160,740.00 | 53 Terraced Houses |
| Flat | £95,522.00 | 20 Flats |

