
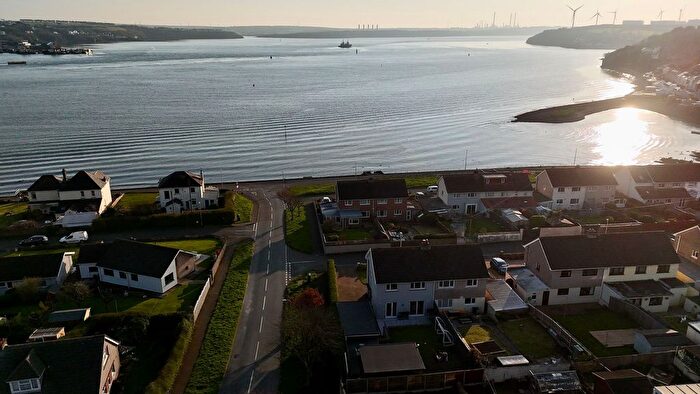
Houses for sale & to rent in Pembroke, Sir Benfro - Pembrokeshire
House Prices in Pembroke
Properties in Pembroke have an average house price of £231k and had 432 Property Transactions within the last 3 years.¹
Pembroke is an area in Sir Benfro - Pembrokeshire with 4,562 households², where the most expensive property was sold for £960k.
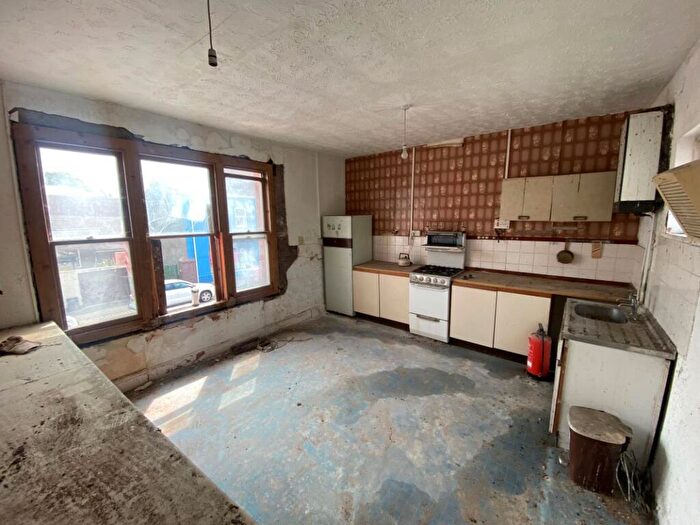
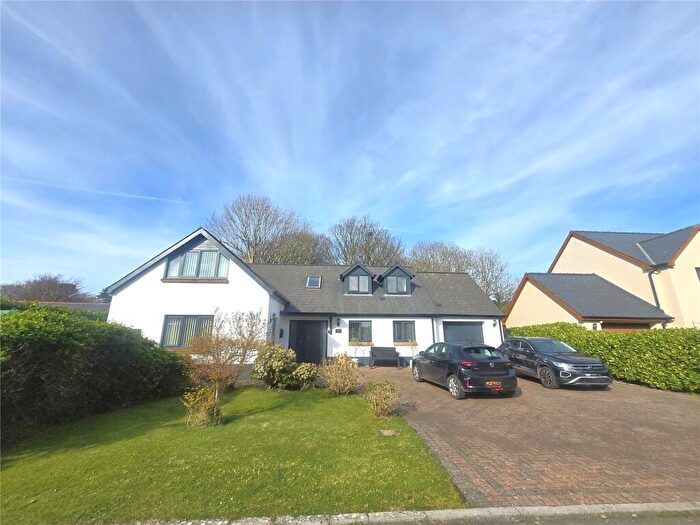
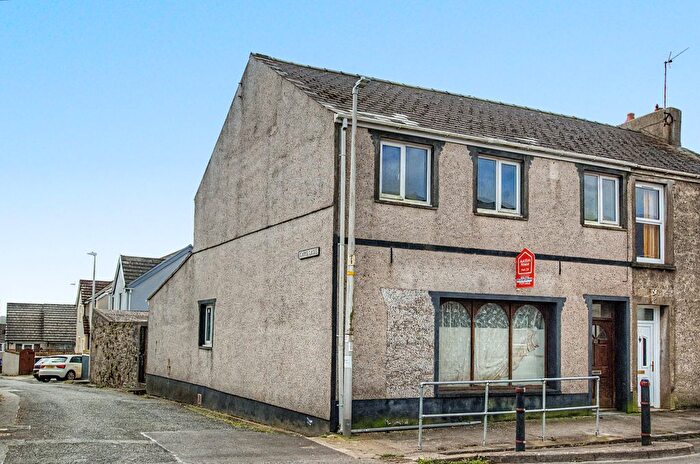
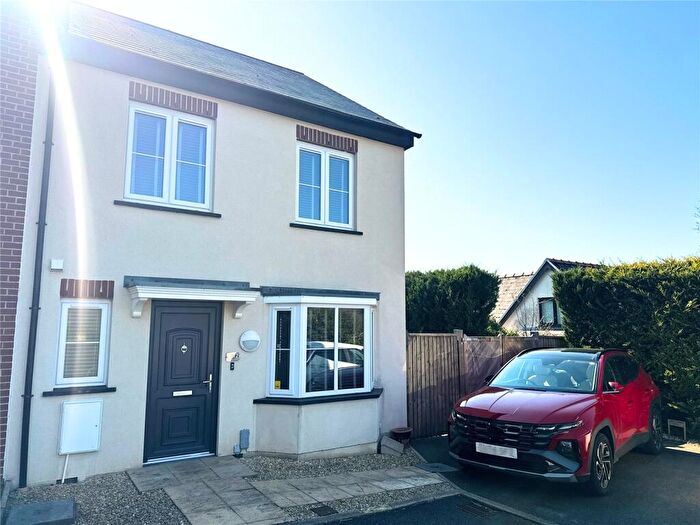
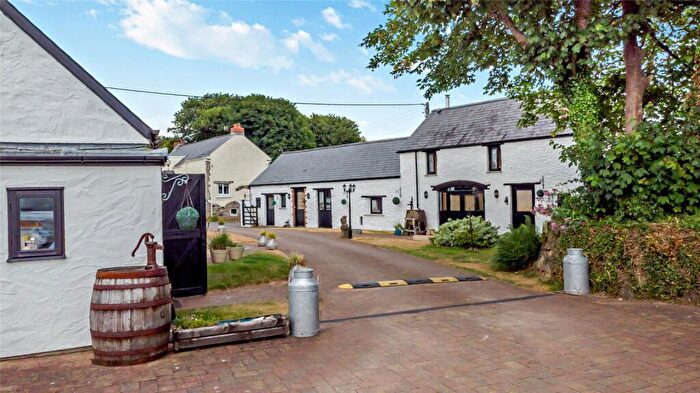
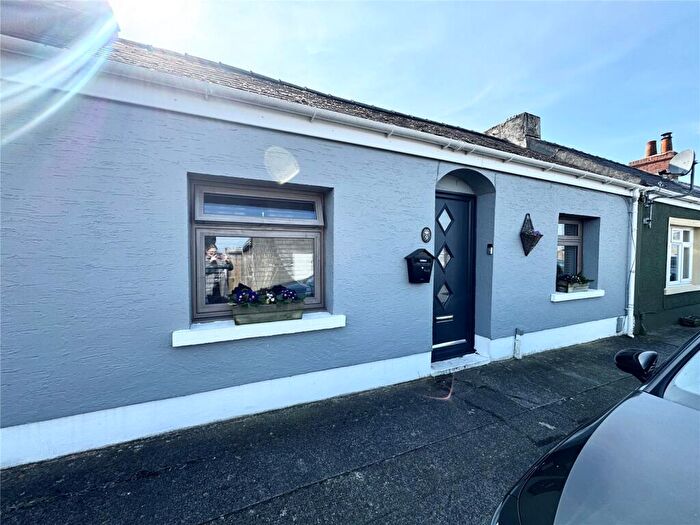
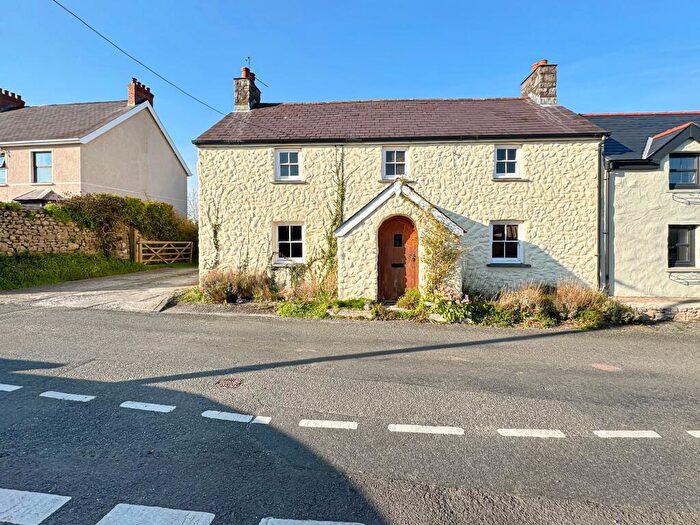
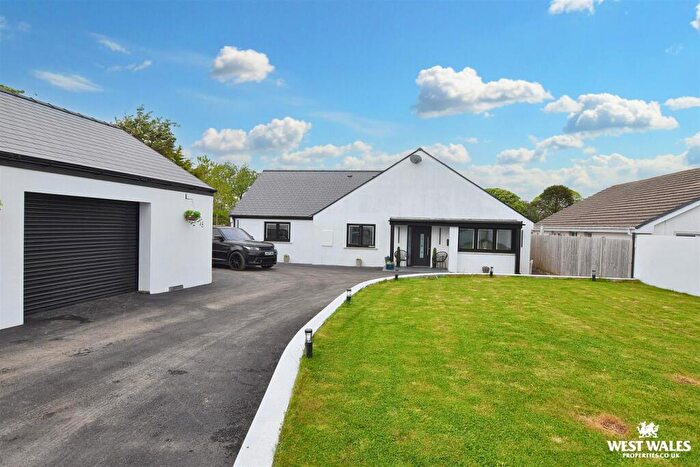
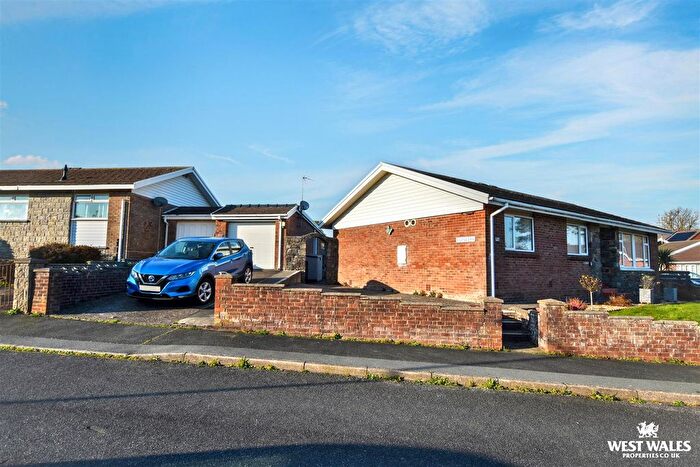
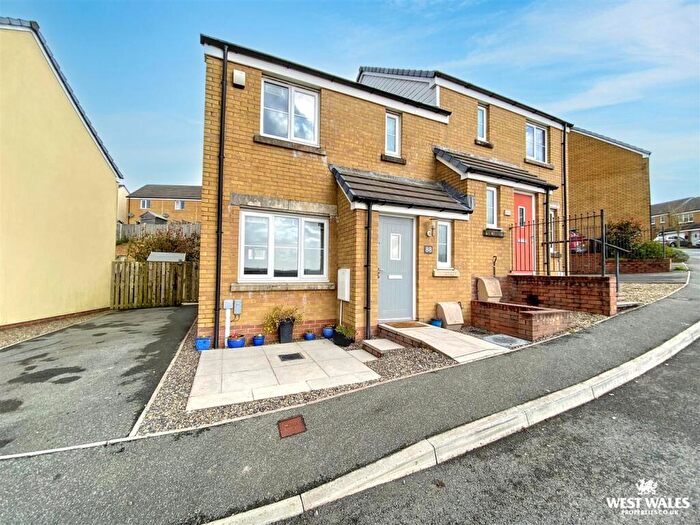
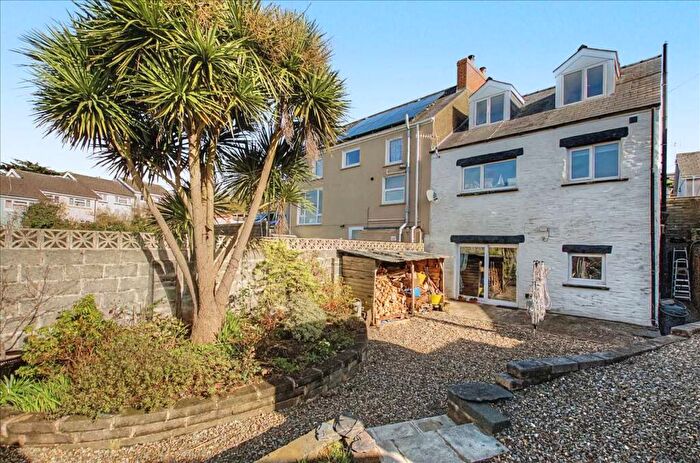
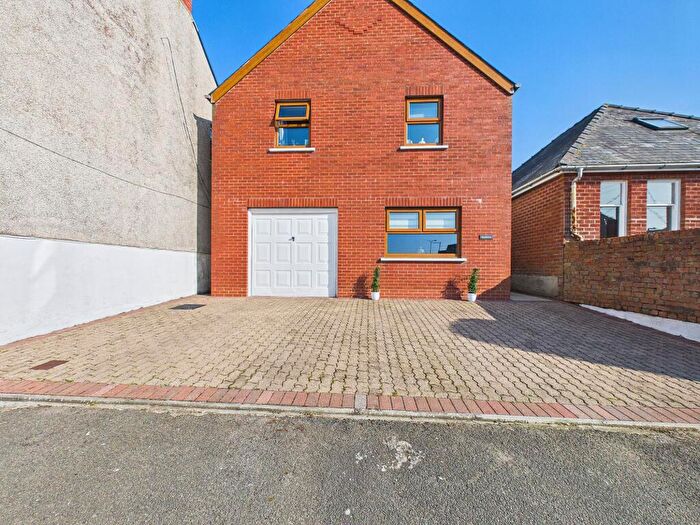
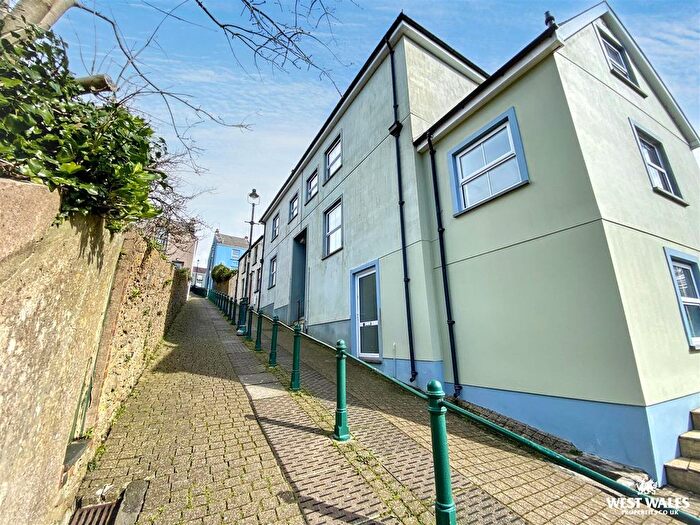
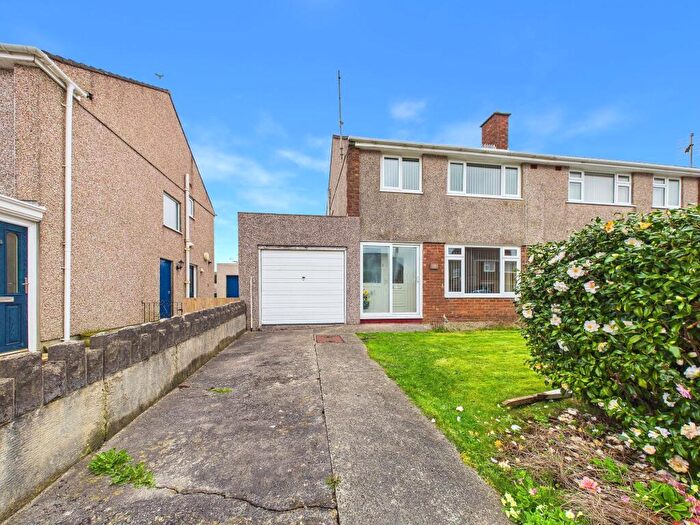
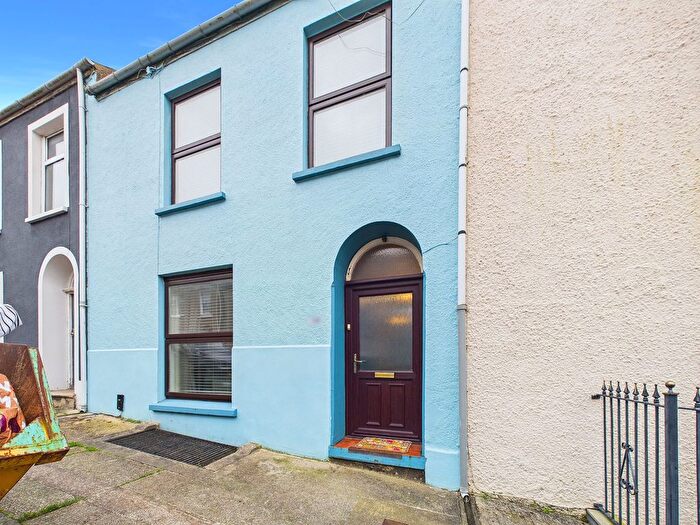
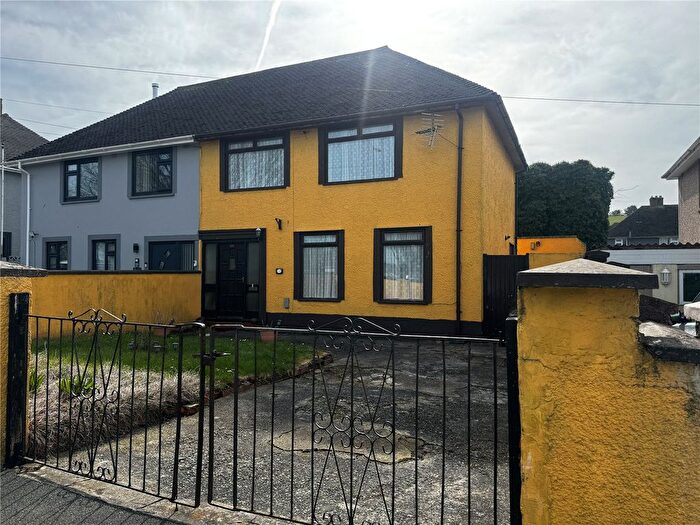
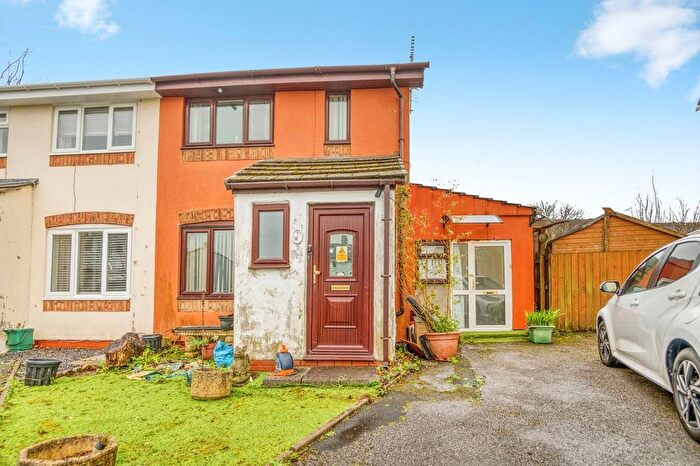
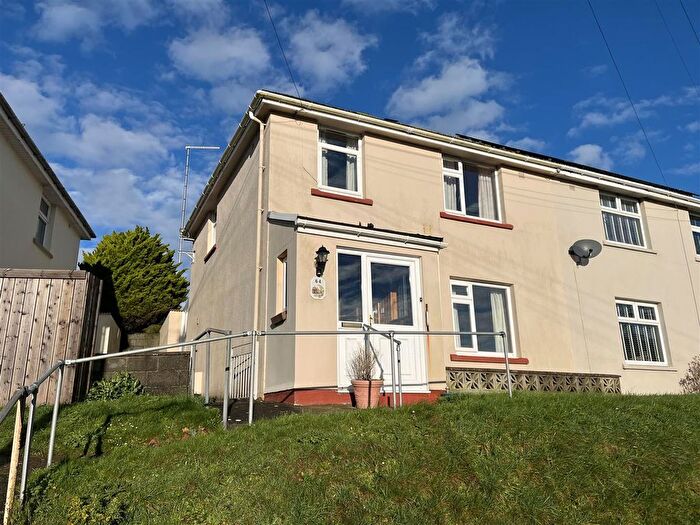
Properties for sale in Pembroke
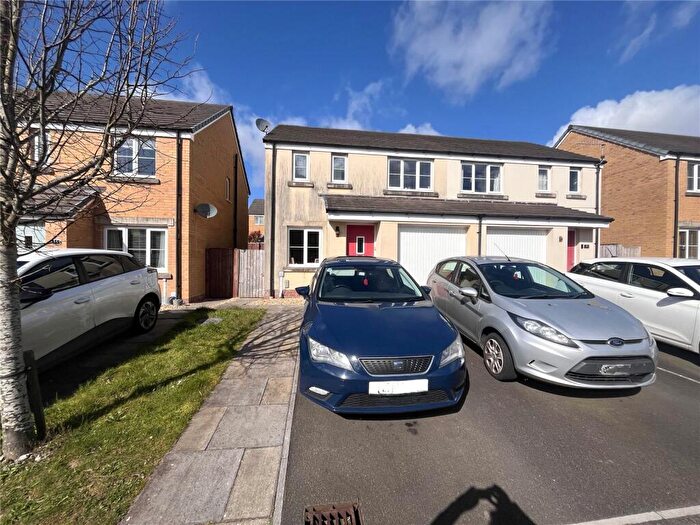


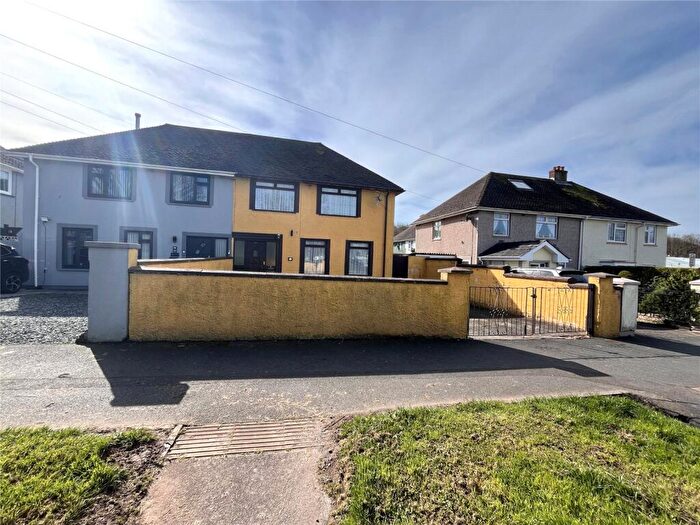
![]()
If you are looking to sell your house, let it out, or receive a property valuation, an expert can help you.
Click the button below to get started.

Neighbourhoods in Pembroke
Navigate through our locations to find the location of your next house in Pembroke, Sir Benfro - Pembrokeshire for sale or to rent.
Transport in Pembroke
Please see below transportation links in this area:

- FAQ
- Price Paid By Year
- Property Type Price
Frequently asked questions about Pembroke
What is the average price for a property for sale in Pembroke?
The average price for a property for sale in Pembroke is £230,576. This amount is 6% lower than the average price in Sir Benfro - Pembrokeshire. There are 5,182 property listings for sale in Pembroke.
What locations have the most expensive properties for sale in Pembroke?
The locations with the most expensive properties for sale in Pembroke are Hundleton at an average of £288,730, Pembroke: St. Michael at an average of £252,292 and Lamphey at an average of £249,567.
What locations have the most affordable properties for sale in Pembroke?
The locations with the most affordable properties for sale in Pembroke are Pembroke: St. Mary South at an average of £187,306, Pembroke: Monkton at an average of £192,883 and Pembroke: St. Mary North at an average of £207,908.
Which train stations are available in or near Pembroke?
Some of the train stations available in or near Pembroke are Pembroke, Pembroke Dock and Lamphey.
Property Price Paid in Pembroke by Year
The average sold property price by year was:
| Year | Average Sold Price | Price Change |
Sold Properties
|
|---|---|---|---|
| 2026 | £385,000 | 42% |
1 Property |
| 2025 | £222,372 | -6% |
124 Properties |
| 2024 | £235,788 | 2% |
157 Properties |
| 2023 | £230,873 | 6% |
150 Properties |
| 2022 | £218,138 | 1% |
176 Properties |
| 2021 | £215,050 | 14% |
242 Properties |
| 2020 | £185,263 | 1% |
141 Properties |
| 2019 | £183,996 | 3% |
192 Properties |
| 2018 | £179,302 | 2% |
222 Properties |
| 2017 | £175,914 | -1% |
210 Properties |
| 2016 | £177,009 | 9% |
165 Properties |
| 2015 | £161,648 | 3% |
217 Properties |
| 2014 | £157,323 | -3% |
176 Properties |
| 2013 | £162,525 | 7% |
126 Properties |
| 2012 | £151,109 | -9% |
99 Properties |
| 2011 | £164,971 | -2% |
88 Properties |
| 2010 | £168,289 | 6% |
112 Properties |
| 2009 | £157,740 | -19% |
109 Properties |
| 2008 | £187,714 | - |
103 Properties |
| 2007 | £187,767 | 20% |
167 Properties |
| 2006 | £150,402 | 5% |
190 Properties |
| 2005 | £142,635 | 7% |
168 Properties |
| 2004 | £132,813 | 16% |
212 Properties |
| 2003 | £112,113 | 28% |
203 Properties |
| 2002 | £80,619 | 14% |
228 Properties |
| 2001 | £69,479 | 12% |
197 Properties |
| 2000 | £61,380 | 7% |
192 Properties |
| 1999 | £57,144 | 13% |
159 Properties |
| 1998 | £49,775 | -2% |
122 Properties |
| 1997 | £50,765 | 7% |
124 Properties |
| 1996 | £47,348 | 3% |
105 Properties |
| 1995 | £45,844 | - |
81 Properties |
Property Price per Property Type in Pembroke
Here you can find historic sold price data in order to help with your property search.
The average Property Paid Price for specific property types in the last three years are:
| Property Type | Average Sold Price | Sold Properties |
|---|---|---|
| Semi Detached House | £196,220.00 | 106 Semi Detached Houses |
| Detached House | £322,295.00 | 171 Detached Houses |
| Terraced House | £160,279.00 | 131 Terraced Houses |
| Flat | £112,517.00 | 24 Flats |