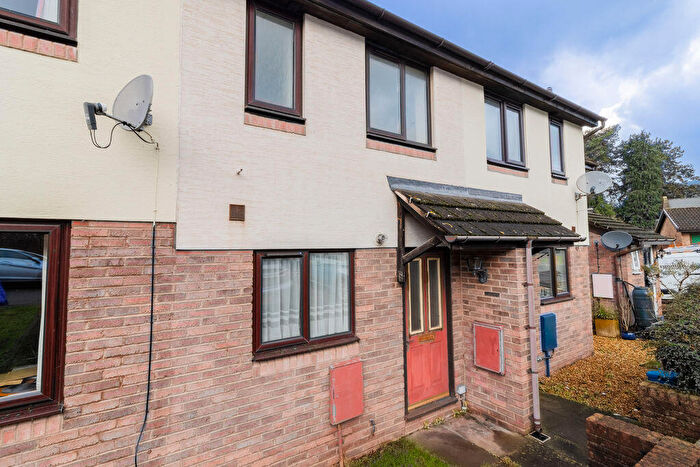
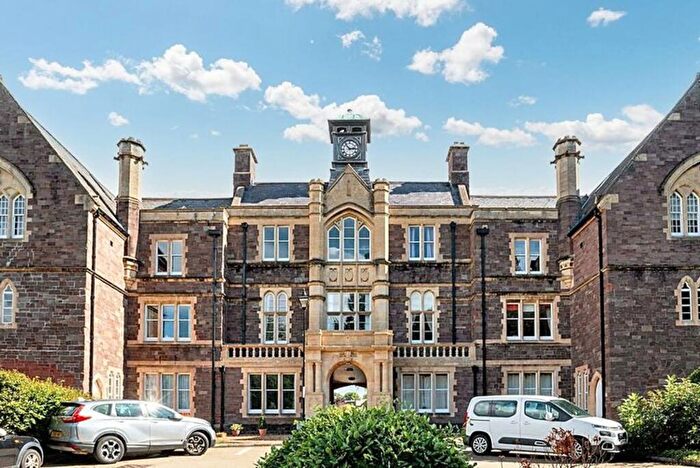
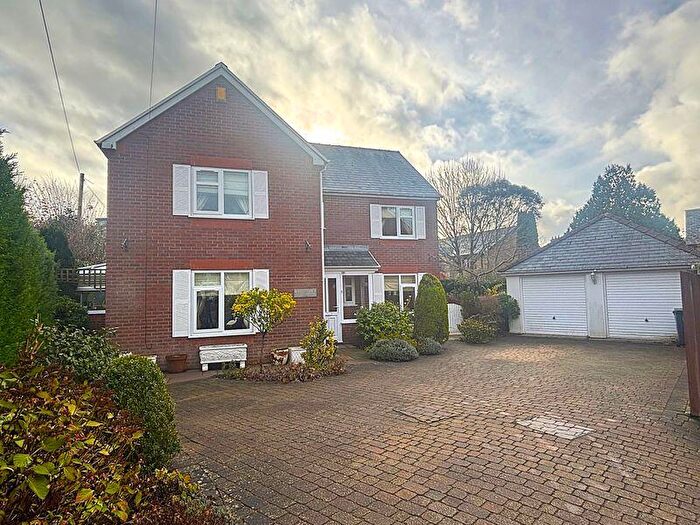
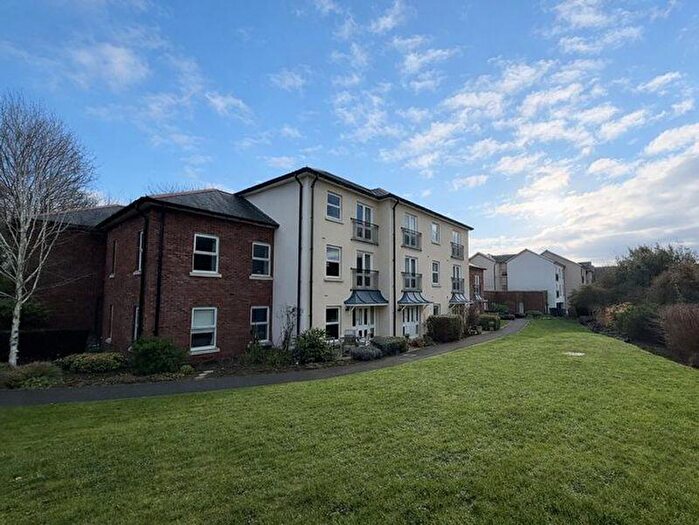
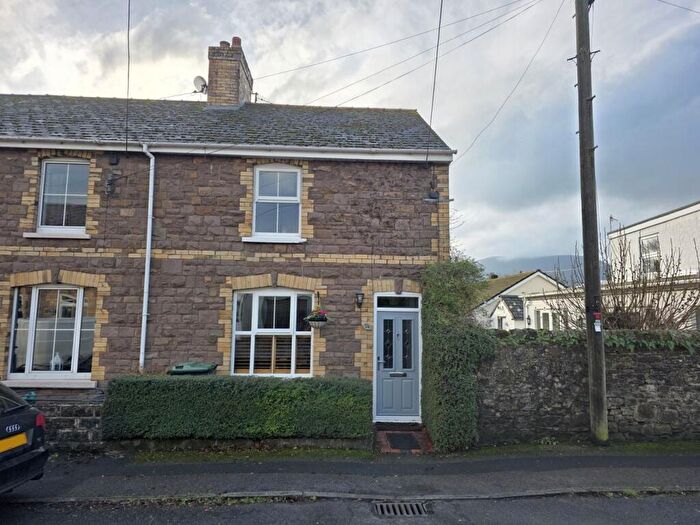
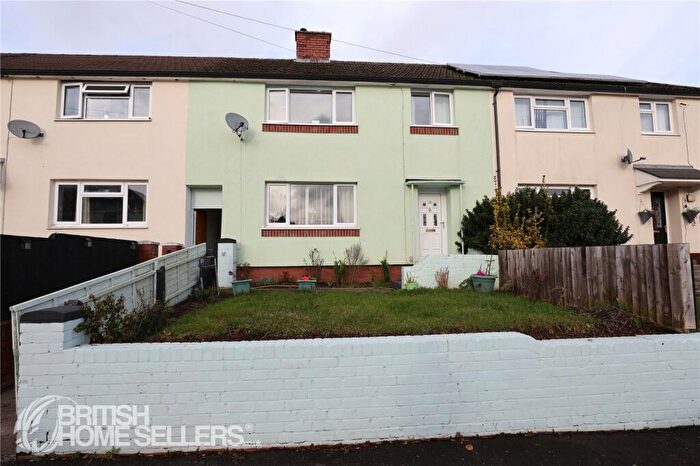
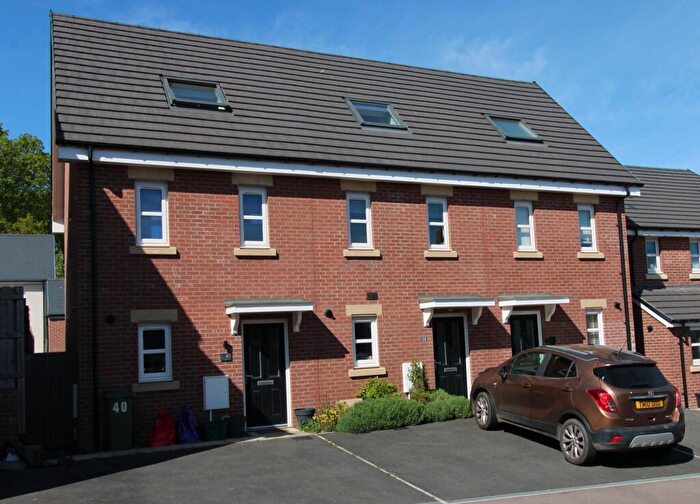
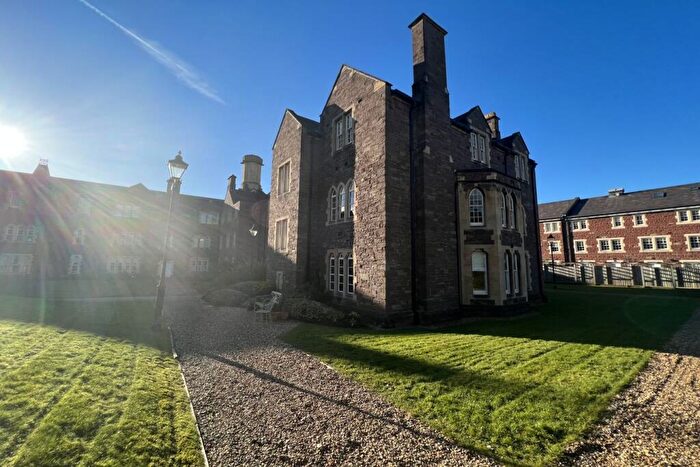
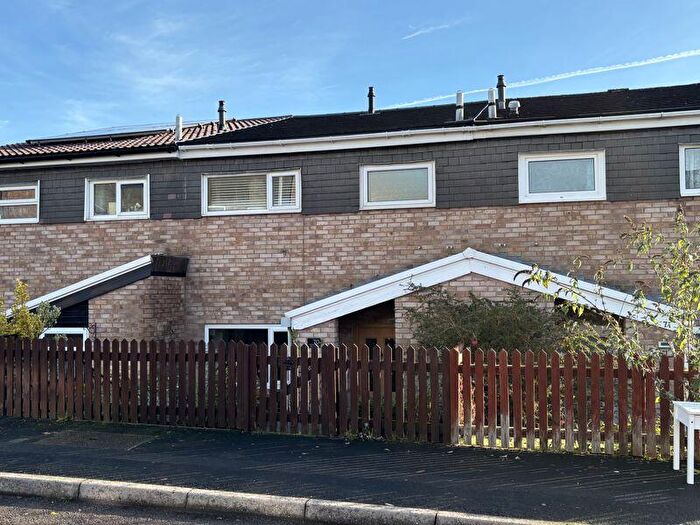
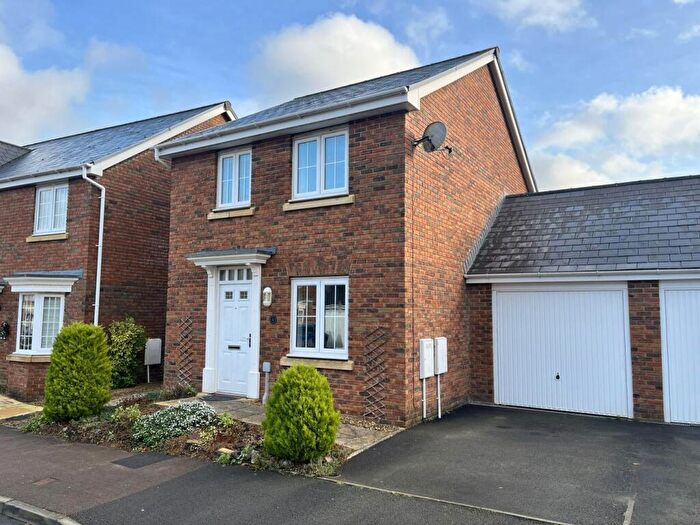
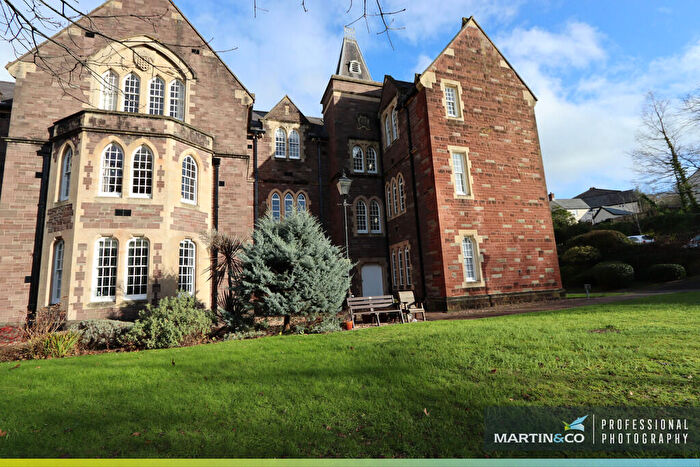
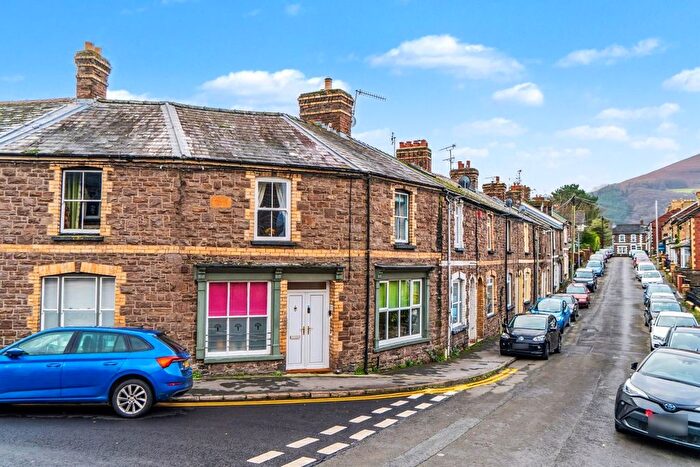
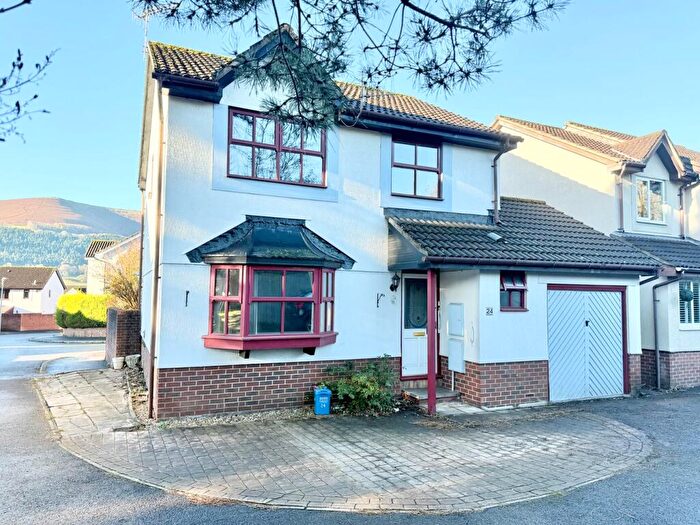
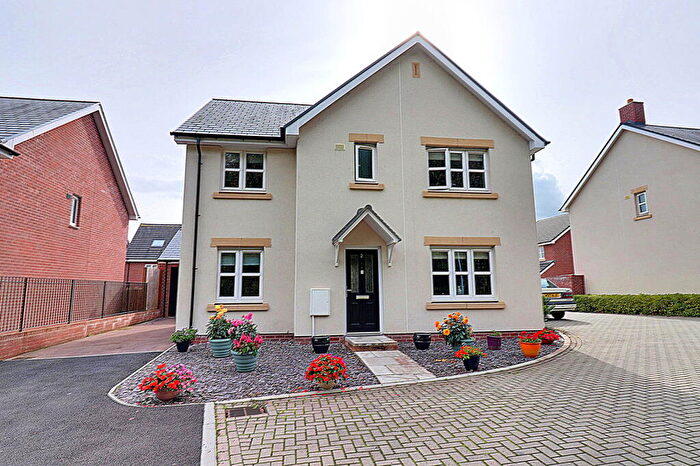
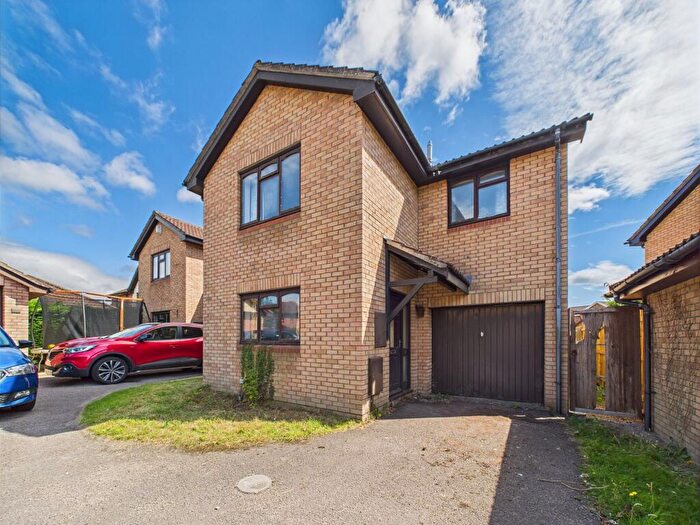
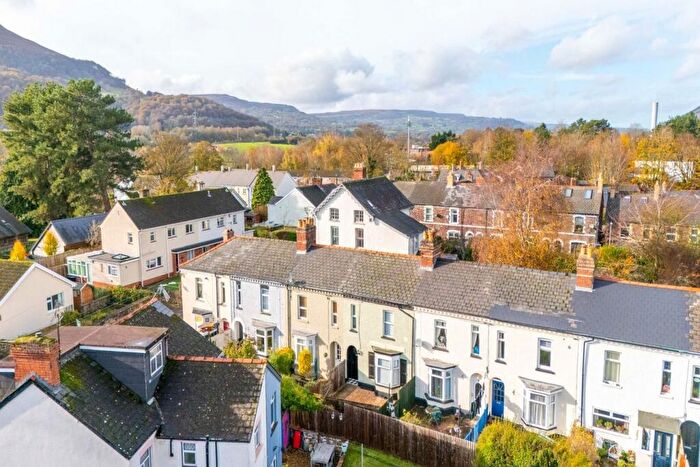
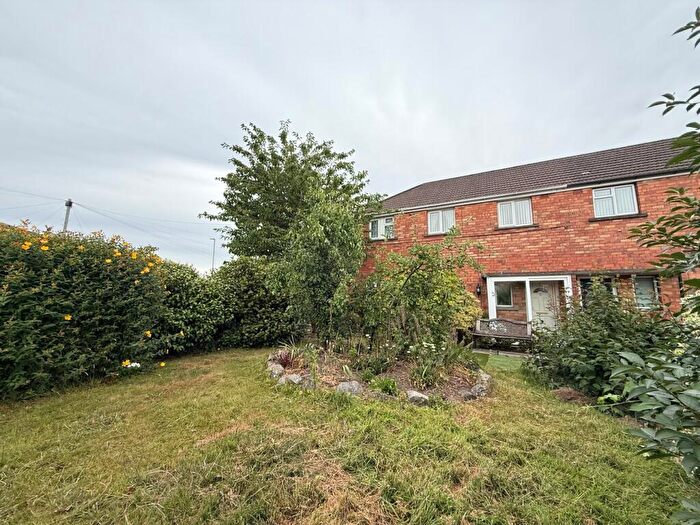
Houses for sale & to rent in Mardy, Abergavenny
House Prices in Mardy
Properties in Mardy have an average house price of £376,113.00 and had 98 Property Transactions within the last 3 years¹.
Mardy is an area in Abergavenny, Sir Fynwy - Monmouthshire with 732 households², where the most expensive property was sold for £940,000.00.
Properties for sale in Mardy
Roads and Postcodes in Mardy
Navigate through our locations to find the location of your next house in Mardy, Abergavenny for sale or to rent.
| Streets | Postcodes |
|---|---|
| Llwynu Lane | NP7 6JA |
| Blorenge View | NP7 6LN |
| Coed Y Brenin | NP7 6PY |
| Deriside | NP7 7HT |
| Firs Road | NP7 6NA NP7 6NB |
| Francombe Way | NP7 6NF |
| Gilbert Terrace | NP7 6HY |
| Greystones Avenue | NP7 6JX |
| Greystones Close | NP7 6JZ |
| Greystones Crescent | NP7 6JY |
| Gwent Place | NP7 6NG |
| Gwent Road | NP7 6NH NP7 6NL |
| Hanratte Close | NP7 6PT |
| Hereford Road | NP7 6HT NP7 6HU NP7 6LB NP7 6LD NP7 6LE |
| Hillgrove Avenue | NP7 6LZ |
| Maindiff Drive | NP7 6PW NP7 6PX |
| Midway Close | NP7 6PJ |
| Midway Lane | NP7 6ND NP7 6NE |
| Mitre Cottages | NP7 6NU |
| Nantgavenny Cottages | NP7 6LF |
| Nantgavenny Lane | NP7 6LG |
| New Cottages | NP7 8AD |
| Old Hereford Road | NP7 7HR NP7 7HS NP7 7LE NP7 7HN |
| Old Monmouth Road | NP7 8BU NP7 8BY |
| Osborne Place | NP7 6LL |
| Penry Close | NP7 6PZ |
| Poplars Close | NP7 6LP NP7 6LQ NP7 6LR NP7 6LS NP7 6LT NP7 6LU NP7 6LY |
| Poplars Court | NP7 6NJ |
| Poplars Road | NP7 6LH NP7 6LJ NP7 6LW NP7 6LX |
| Rosewarne Close | NP7 6QA |
| Ross Road | NP7 8NG NP7 8NH NP7 8NF |
| St Davids Close | NP7 6HX |
| St Davids Road | NP7 6HD NP7 6PP |
| The Newlands | NP7 6HJ |
| The Pines | NP7 6HQ |
| Trebencyn Park | NP7 8AR |
| Triley Cottages | NP7 8DE |
| NP7 6LA NP7 8AA NP7 8AB NP7 8AG NP7 8AT NP7 8AU NP7 8AW NP7 8BL NP7 6NT NP7 6NY NP7 6PA NP7 6PB NP7 8AE NP7 8AP NP7 8AY NP7 8BA NP7 8BB NP7 8BH NP7 8DF |
Transport near Mardy
- FAQ
- Price Paid By Year
- Property Type Price
Frequently asked questions about Mardy
What is the average price for a property for sale in Mardy?
The average price for a property for sale in Mardy is £376,113. This amount is 10% higher than the average price in Abergavenny. There are 300 property listings for sale in Mardy.
What streets have the most expensive properties for sale in Mardy?
The streets with the most expensive properties for sale in Mardy are Ross Road at an average of £693,750, Midway Close at an average of £490,000 and Greystones Avenue at an average of £460,555.
What streets have the most affordable properties for sale in Mardy?
The streets with the most affordable properties for sale in Mardy are Hanratte Close at an average of £228,333, The Newlands at an average of £247,722 and Gwent Place at an average of £250,000.
Which train stations are available in or near Mardy?
Some of the train stations available in or near Mardy are Abergavenny, Ebbw Vale Town and Pontypool and New Inn.
Property Price Paid in Mardy by Year
The average sold property price by year was:
| Year | Average Sold Price | Price Change |
Sold Properties
|
|---|---|---|---|
| 2025 | £434,090 | 14% |
11 Properties |
| 2024 | £373,923 | 5% |
19 Properties |
| 2023 | £356,614 | -6% |
35 Properties |
| 2022 | £378,730 | 21% |
33 Properties |
| 2021 | £298,922 | 17% |
41 Properties |
| 2020 | £248,404 | -1% |
60 Properties |
| 2019 | £250,590 | 10% |
62 Properties |
| 2018 | £224,469 | -31% |
41 Properties |
| 2017 | £294,882 | 9% |
34 Properties |
| 2016 | £267,646 | 14% |
27 Properties |
| 2015 | £229,093 | -11% |
30 Properties |
| 2014 | £253,640 | 12% |
48 Properties |
| 2013 | £223,501 | -5% |
31 Properties |
| 2012 | £234,250 | 7% |
12 Properties |
| 2011 | £217,263 | 12% |
11 Properties |
| 2010 | £190,333 | 19% |
12 Properties |
| 2009 | £153,555 | -23% |
17 Properties |
| 2008 | £188,438 | -10% |
13 Properties |
| 2007 | £207,184 | -10% |
28 Properties |
| 2006 | £227,952 | 18% |
22 Properties |
| 2005 | £187,863 | 8% |
22 Properties |
| 2004 | £173,288 | 7% |
27 Properties |
| 2003 | £161,030 | 35% |
24 Properties |
| 2002 | £105,158 | -1% |
31 Properties |
| 2001 | £106,012 | 5% |
24 Properties |
| 2000 | £101,026 | 16% |
28 Properties |
| 1999 | £84,869 | 25% |
22 Properties |
| 1998 | £63,606 | -16% |
23 Properties |
| 1997 | £73,954 | 8% |
31 Properties |
| 1996 | £67,692 | 18% |
26 Properties |
| 1995 | £55,538 | - |
13 Properties |
Property Price per Property Type in Mardy
Here you can find historic sold price data in order to help with your property search.
The average Property Paid Price for specific property types in the last three years are:
| Property Type | Average Sold Price | Sold Properties |
|---|---|---|
| Semi Detached House | £306,666.00 | 21 Semi Detached Houses |
| Detached House | £448,945.00 | 52 Detached Houses |
| Terraced House | £277,578.00 | 19 Terraced Houses |
| Flat | £300,000.00 | 6 Flats |

