
Houses for sale & to rent in Abergavenny, Sir Fynwy - Monmouthshire
House Prices in Abergavenny
Properties in Abergavenny have an average house price of £340,622.00 and had 1,299 Property Transactions within the last 3 years.¹
Abergavenny is an area in Sir Fynwy - Monmouthshire with 11,385 households², where the most expensive property was sold for £1,750,000.00.
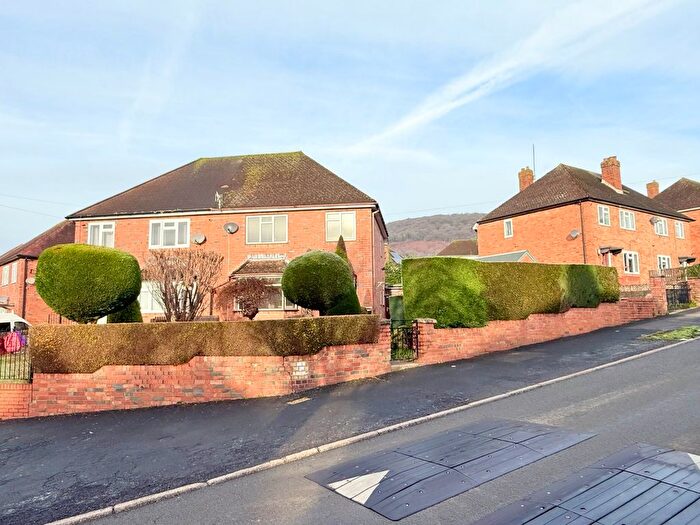
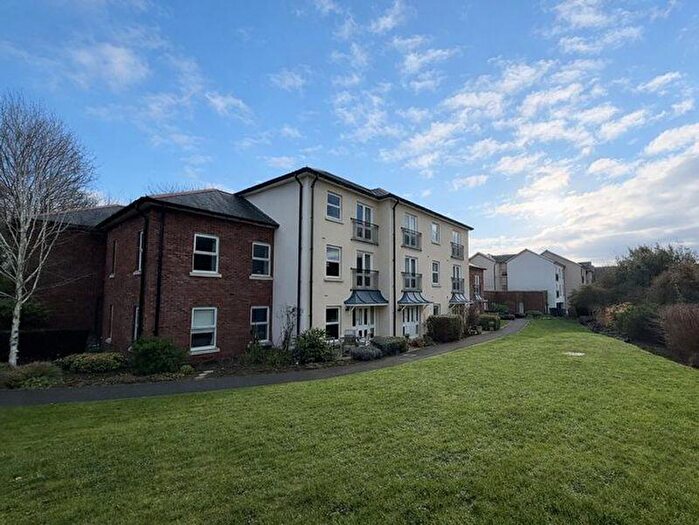
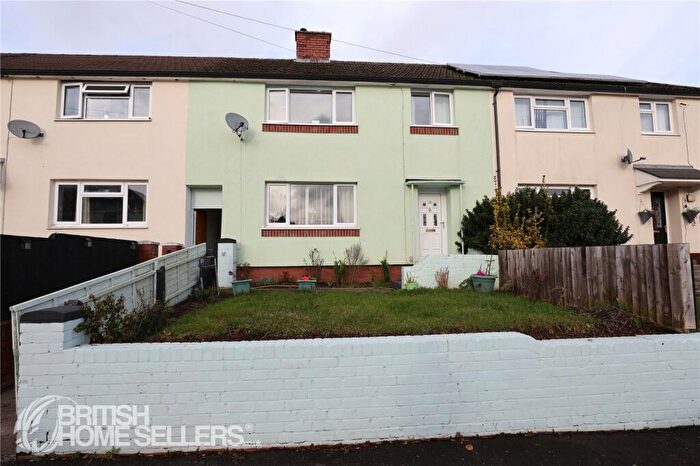
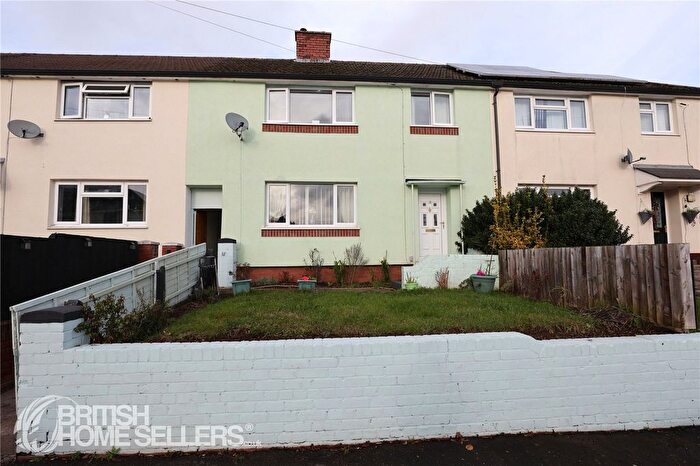
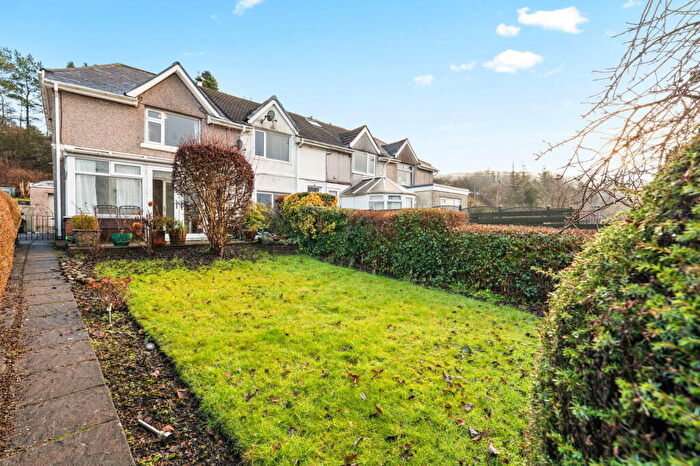
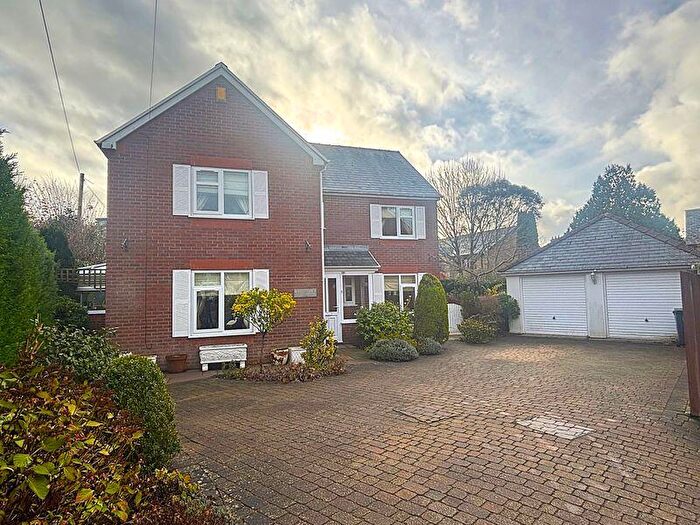
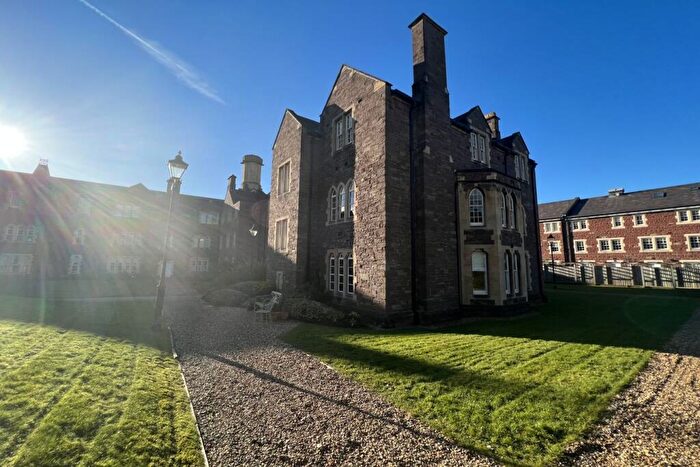
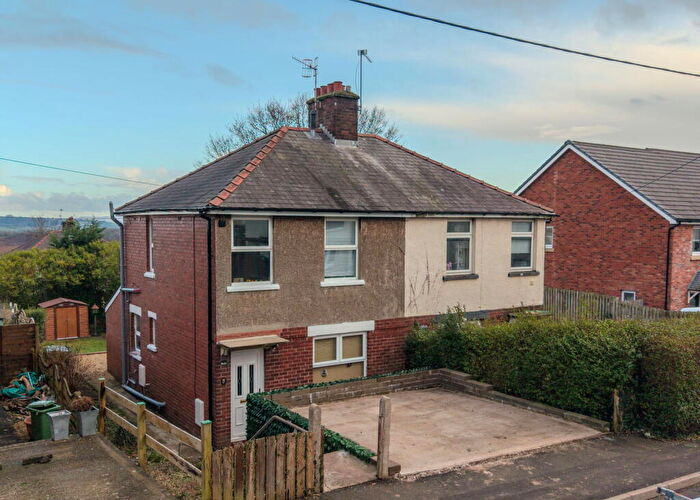
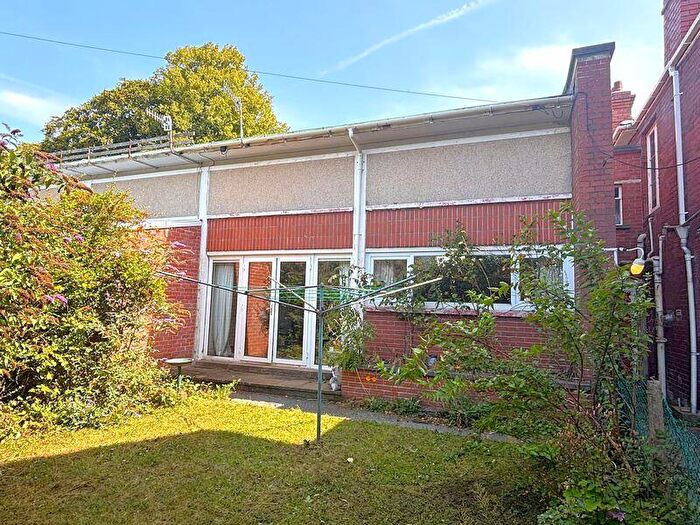
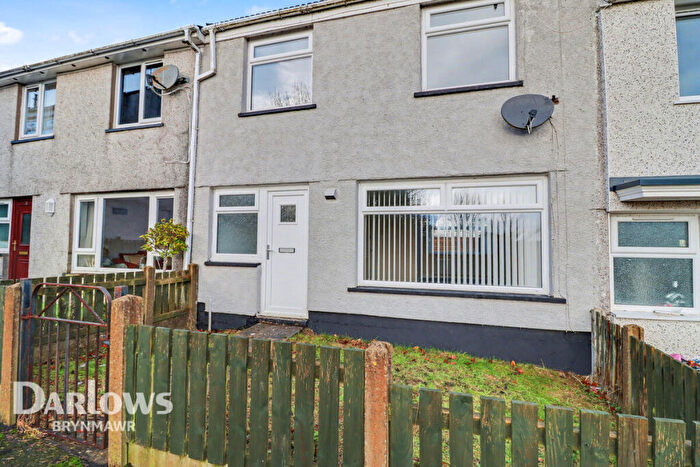
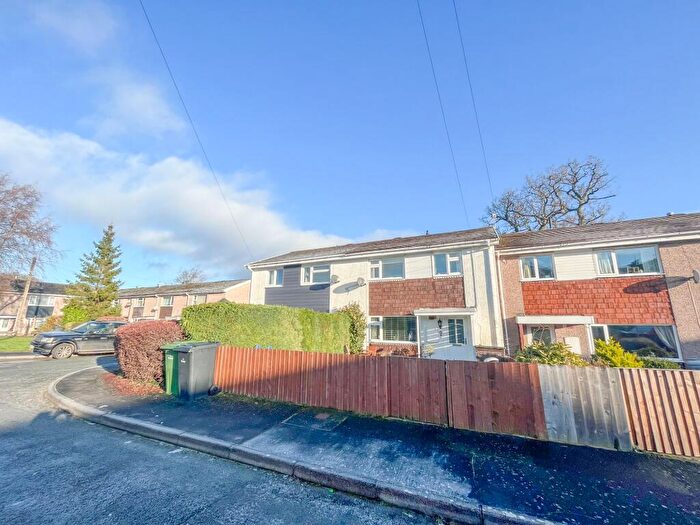
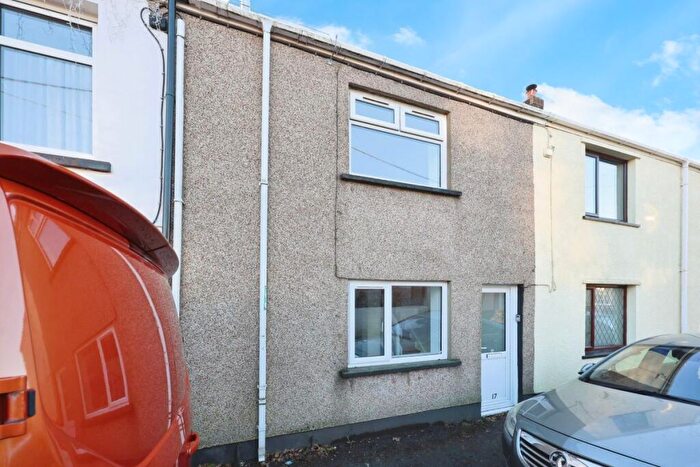
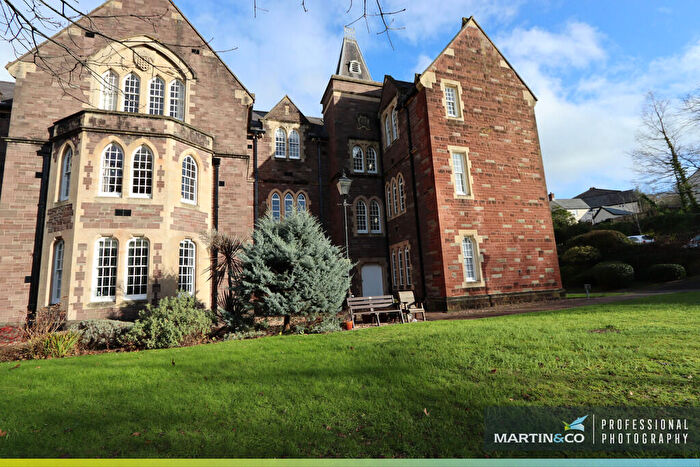
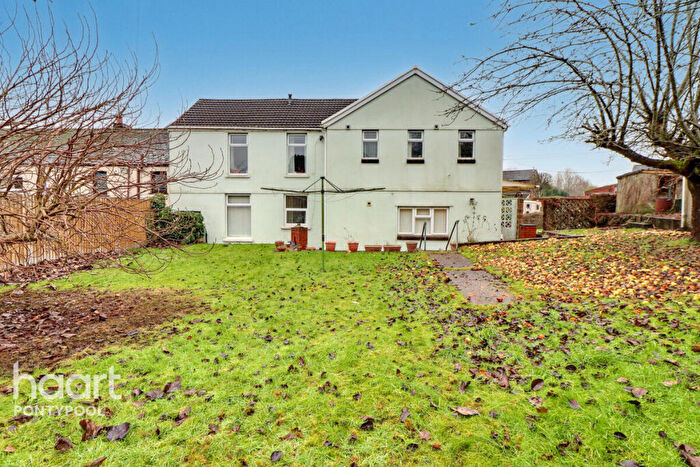
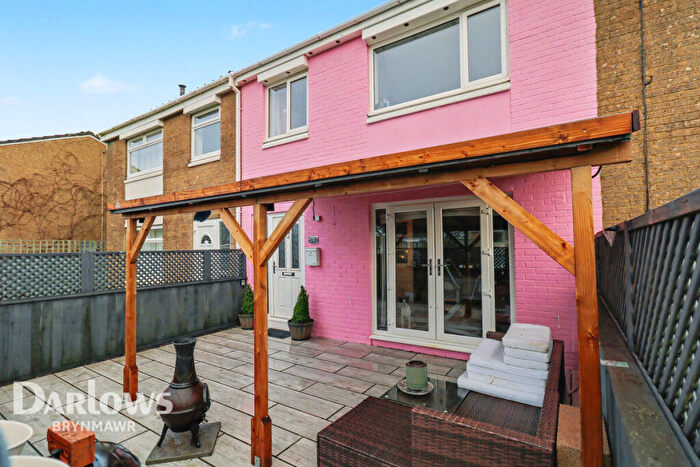
Properties for sale in Abergavenny
![]()
If you are looking to sell your house, let it out, or receive a property valuation, an expert can help you.
Click the button below to get started.

Neighbourhoods in Abergavenny
Navigate through our locations to find the location of your next house in Abergavenny, Sir Fynwy - Monmouthshire for sale or to rent.
Transport in Abergavenny
Please see below transportation links in this area:

- FAQ
- Price Paid By Year
- Property Type Price
Frequently asked questions about Abergavenny
What is the average price for a property for sale in Abergavenny?
The average price for a property for sale in Abergavenny is £340,622. This amount is 4% lower than the average price in Sir Fynwy - Monmouthshire. There are more than 10,000 property listings for sale in Abergavenny.
What locations have the most expensive properties for sale in Abergavenny?
The locations with the most expensive properties for sale in Abergavenny are Goetre Fawr at an average of £529,125, Crucorney at an average of £506,065 and Llanover at an average of £490,192.
What locations have the most affordable properties for sale in Abergavenny?
The locations with the most affordable properties for sale in Abergavenny are Priory at an average of £252,420, Grofield at an average of £260,026 and Croesonen at an average of £278,286.
Which train stations are available in or near Abergavenny?
Some of the train stations available in or near Abergavenny are Abergavenny, Ebbw Vale Town and Pontypool and New Inn.
Property Price Paid in Abergavenny by Year
The average sold property price by year was:
| Year | Average Sold Price | Price Change |
Sold Properties
|
|---|---|---|---|
| 2025 | £342,052 | -4% |
238 Properties |
| 2024 | £354,823 | 11% |
351 Properties |
| 2023 | £314,387 | -11% |
330 Properties |
| 2022 | £349,391 | 12% |
380 Properties |
| 2021 | £307,171 | 6% |
436 Properties |
| 2020 | £289,515 | 10% |
359 Properties |
| 2019 | £259,415 | -3% |
383 Properties |
| 2018 | £268,244 | 7% |
441 Properties |
| 2017 | £249,372 | 7% |
514 Properties |
| 2016 | £232,947 | -1% |
495 Properties |
| 2015 | £234,761 | 4% |
436 Properties |
| 2014 | £224,313 | 9% |
426 Properties |
| 2013 | £204,203 | -12% |
373 Properties |
| 2012 | £228,443 | 13% |
298 Properties |
| 2011 | £198,874 | -8% |
286 Properties |
| 2010 | £215,020 | 12% |
290 Properties |
| 2009 | £188,904 | -8% |
272 Properties |
| 2008 | £204,697 | -7% |
250 Properties |
| 2007 | £218,934 | 8% |
430 Properties |
| 2006 | £201,399 | 3% |
388 Properties |
| 2005 | £195,547 | 14% |
287 Properties |
| 2004 | £169,063 | 17% |
430 Properties |
| 2003 | £140,986 | 11% |
477 Properties |
| 2002 | £125,205 | 14% |
518 Properties |
| 2001 | £107,149 | 15% |
439 Properties |
| 2000 | £91,144 | 8% |
390 Properties |
| 1999 | £84,112 | 6% |
384 Properties |
| 1998 | £79,101 | 2% |
366 Properties |
| 1997 | £77,540 | 13% |
405 Properties |
| 1996 | £67,689 | 2% |
353 Properties |
| 1995 | £66,564 | - |
271 Properties |
Property Price per Property Type in Abergavenny
Here you can find historic sold price data in order to help with your property search.
The average Property Paid Price for specific property types in the last three years are:
| Property Type | Average Sold Price | Sold Properties |
|---|---|---|
| Semi Detached House | £308,897.00 | 333 Semi Detached Houses |
| Detached House | £455,399.00 | 515 Detached Houses |
| Terraced House | £251,122.00 | 324 Terraced Houses |
| Flat | £186,697.00 | 127 Flats |