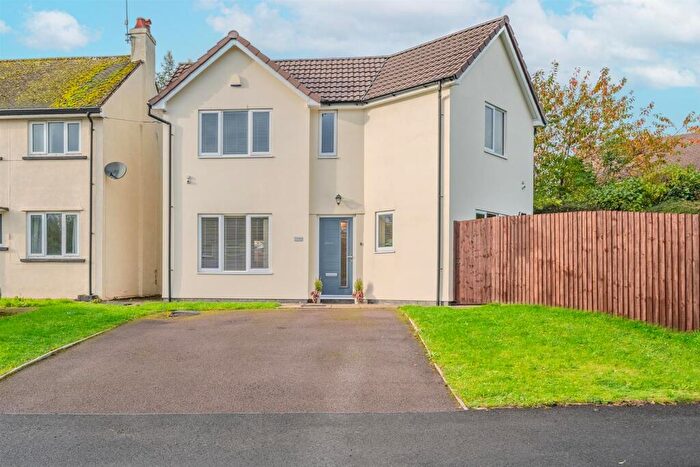
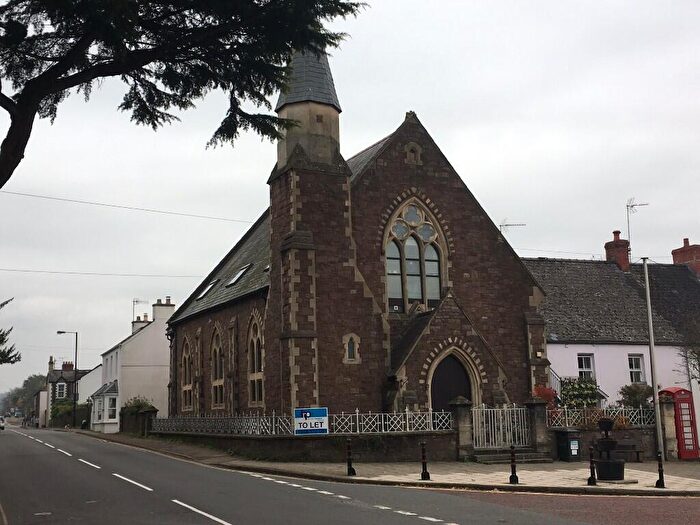
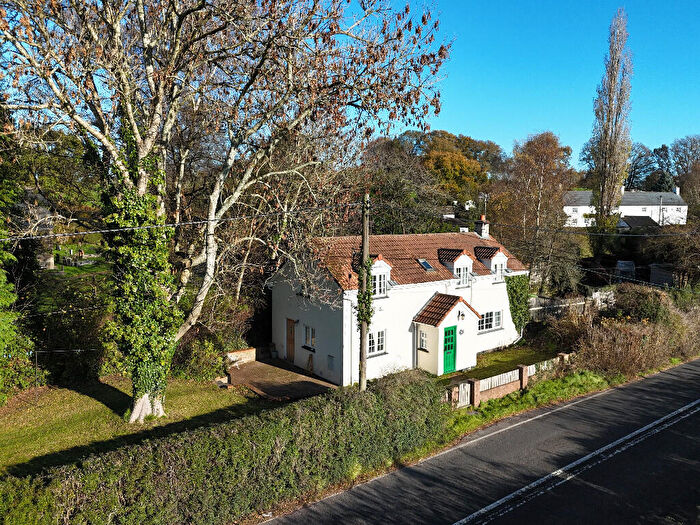
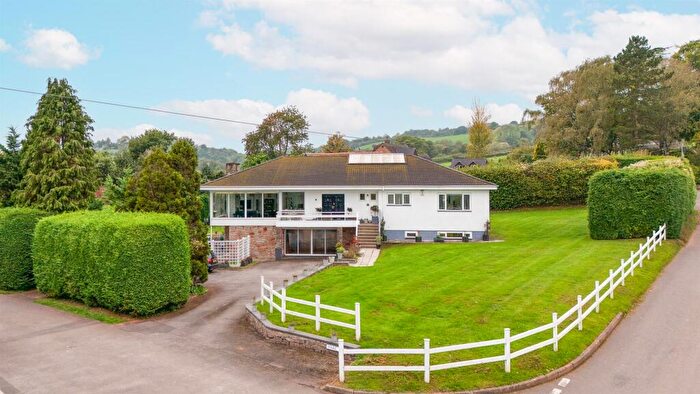
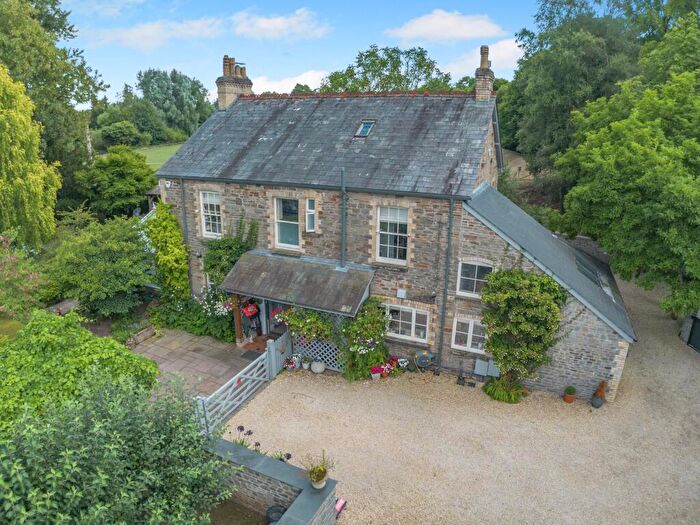
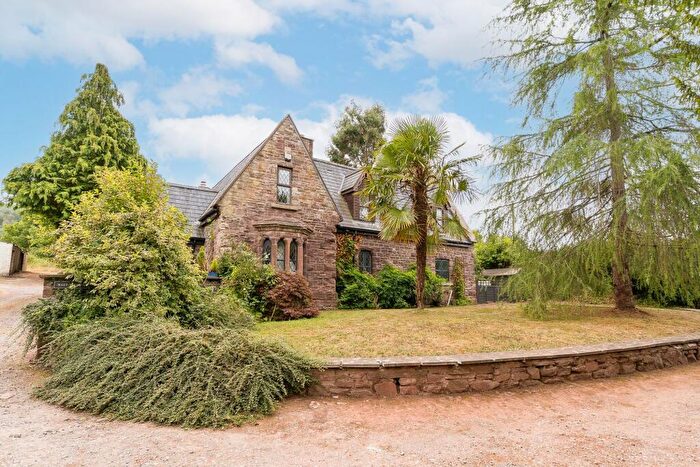
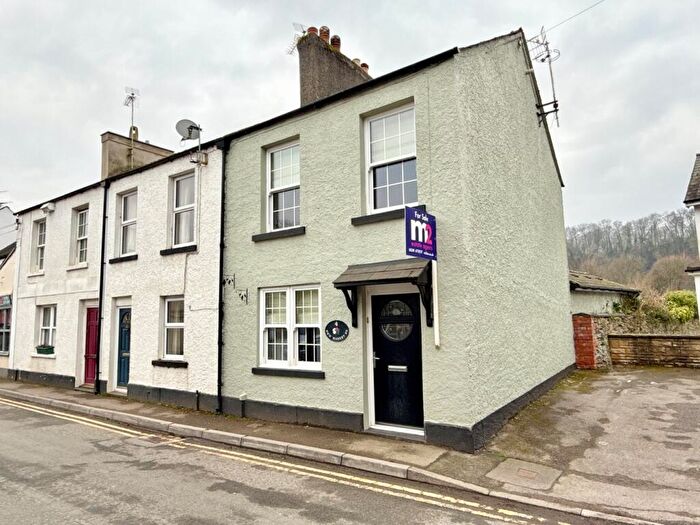
Houses for sale & to rent in Llanbadoc, Usk
House Prices in Llanbadoc
Properties in Llanbadoc have an average house price of £542,544.00 and had 36 Property Transactions within the last 3 years¹.
Llanbadoc is an area in Usk, Sir Fynwy - Monmouthshire with 415 households², where the most expensive property was sold for £2,000,000.00.
Properties for sale in Llanbadoc
Roads and Postcodes in Llanbadoc
Navigate through our locations to find the location of your next house in Llanbadoc, Usk for sale or to rent.
| Streets | Postcodes |
|---|---|
| Alexandra Place | NP15 1QJ |
| Alexandra Terrace | NP15 1QH |
| Beaufort Crescent | NP15 1QL |
| Cefn Mawr Road | NP15 1QS |
| Church Cottages | NP15 1SX |
| Church Road | NP15 1GY |
| Clytha Road | NP15 1JB |
| Hanley Cwrt | NP15 1TD |
| Kemeys Cottages | NP15 1JD |
| Kemeys Road | NP15 1JA |
| Monmouth Road | NP15 1QX |
| Prioress Mill Lane | NP15 1PU |
| Prospect Cottages | NP15 1TQ |
| Rhadyr | NP15 1PY |
| Rumble Street | NP15 1QG |
| The Steppes | NP15 1JZ |
| Ty Freeman Houses | NP15 1RL |
| Wainfield Lane | NP15 1RG NP15 1RP NP15 1RQ |
| West Road | NP15 1QR |
| Woodside | NP15 1TJ |
| Woodside Trading Estate | NP15 1SS |
| Yew Tree Cottages | NP15 1TB |
| NP15 1DD NP15 1HR NP15 1HS NP15 1JH NP15 1JQ NP15 1JU NP15 1LA NP15 1PS NP15 1QA NP15 1QB NP15 1QE NP15 1QT NP15 1RB NP15 1RD NP15 1RE NP15 1RH NP15 1RJ NP15 1RT NP15 1SU NP15 1SY NP15 1TE NP15 1TG NP15 1TL NP15 1GA NP15 1HT NP15 1HU NP15 1HY NP15 1HZ NP15 1JE NP15 1JF NP15 1JG NP15 1JX NP15 1LB NP15 1LD NP15 1PL NP15 1PP NP15 1PR NP15 1PT NP15 1PW NP15 1PX NP15 1RA NP15 1SZ NP15 1TA NP15 1TF NP15 1TP NP15 1XJ NP15 1XL NP15 9TA NP15 9ZZ |
Transport near Llanbadoc
-
Pontypool and New Inn Station
-
Cwmbran Station
-
Abergavenny Station
-
Llanhilleth Station
-
Newport (Gwent) Station
- FAQ
- Price Paid By Year
- Property Type Price
Frequently asked questions about Llanbadoc
What is the average price for a property for sale in Llanbadoc?
The average price for a property for sale in Llanbadoc is £542,544. This amount is 27% higher than the average price in Usk. There are 478 property listings for sale in Llanbadoc.
What streets have the most expensive properties for sale in Llanbadoc?
The streets with the most expensive properties for sale in Llanbadoc are Rhadyr at an average of £685,000, Wainfield Lane at an average of £637,500 and Woodside at an average of £290,000.
What streets have the most affordable properties for sale in Llanbadoc?
The streets with the most affordable properties for sale in Llanbadoc are Beaufort Crescent at an average of £218,285, Kemeys Road at an average of £230,000 and Alexandra Terrace at an average of £260,000.
Which train stations are available in or near Llanbadoc?
Some of the train stations available in or near Llanbadoc are Pontypool and New Inn, Cwmbran and Abergavenny.
Property Price Paid in Llanbadoc by Year
The average sold property price by year was:
| Year | Average Sold Price | Price Change |
Sold Properties
|
|---|---|---|---|
| 2025 | £482,500 | -9% |
2 Properties |
| 2024 | £525,681 | -8% |
11 Properties |
| 2023 | £566,125 | 4% |
12 Properties |
| 2022 | £544,600 | 19% |
11 Properties |
| 2021 | £442,088 | 11% |
17 Properties |
| 2020 | £391,400 | -37% |
5 Properties |
| 2019 | £534,875 | 34% |
16 Properties |
| 2018 | £352,410 | 24% |
9 Properties |
| 2017 | £268,531 | -37% |
16 Properties |
| 2016 | £369,226 | 23% |
13 Properties |
| 2015 | £284,969 | -38% |
18 Properties |
| 2014 | £392,642 | 55% |
14 Properties |
| 2013 | £174,995 | -131% |
10 Properties |
| 2012 | £403,611 | 56% |
9 Properties |
| 2011 | £178,750 | -57% |
4 Properties |
| 2010 | £281,117 | -43% |
13 Properties |
| 2009 | £402,666 | 19% |
9 Properties |
| 2008 | £328,000 | -25% |
5 Properties |
| 2007 | £411,450 | 33% |
21 Properties |
| 2006 | £277,500 | -62% |
14 Properties |
| 2005 | £449,600 | 48% |
10 Properties |
| 2004 | £234,449 | -15% |
17 Properties |
| 2003 | £269,817 | 48% |
11 Properties |
| 2002 | £140,622 | 6% |
20 Properties |
| 2001 | £132,650 | 13% |
10 Properties |
| 2000 | £115,550 | -2% |
10 Properties |
| 1999 | £118,326 | 35% |
17 Properties |
| 1998 | £76,797 | -36% |
19 Properties |
| 1997 | £104,428 | 3% |
7 Properties |
| 1996 | £100,838 | 21% |
13 Properties |
| 1995 | £79,306 | - |
8 Properties |
Property Price per Property Type in Llanbadoc
Here you can find historic sold price data in order to help with your property search.
The average Property Paid Price for specific property types in the last three years are:
| Property Type | Average Sold Price | Sold Properties |
|---|---|---|
| Detached House | £778,289.00 | 19 Detached Houses |
| Terraced House | £266,961.00 | 13 Terraced Houses |
| Semi Detached House | £318,400.00 | 4 Semi Detached Houses |

