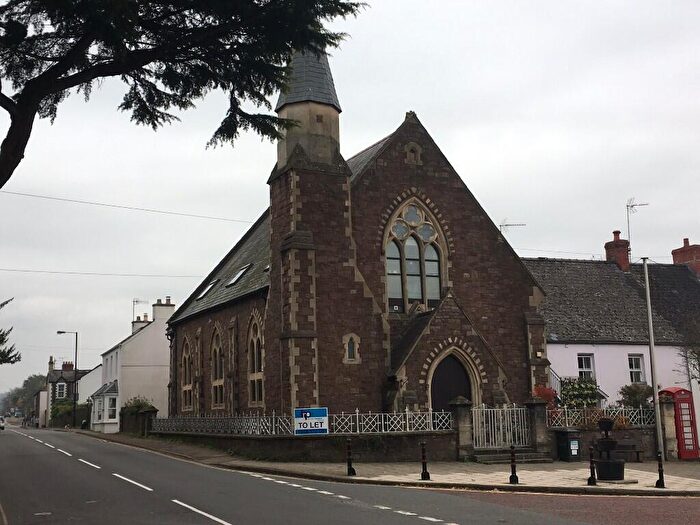
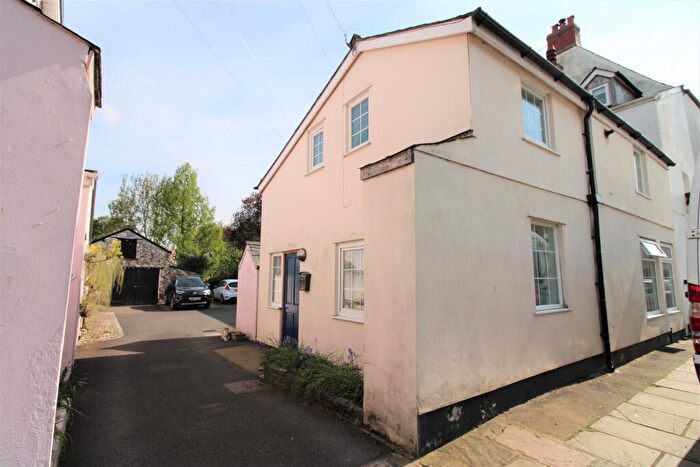
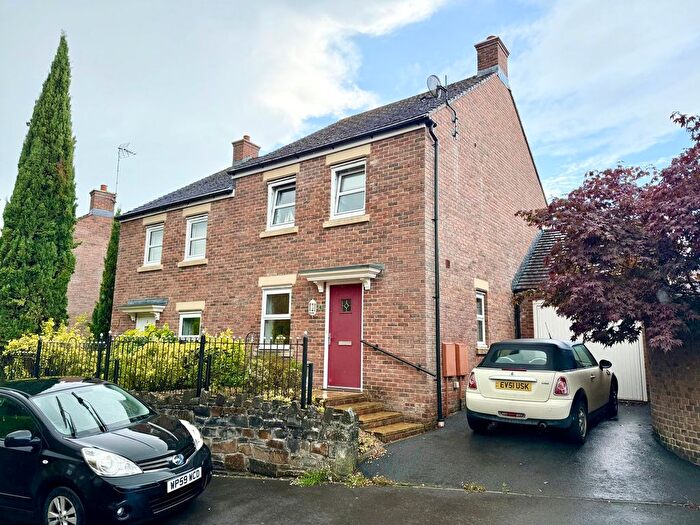
Houses for sale & to rent in Usk, Usk
House Prices in Usk
Properties in Usk have an average house price of £364,548.00 and had 175 Property Transactions within the last 3 years¹.
Usk is an area in Usk, Sir Fynwy - Monmouthshire with 1,153 households², where the most expensive property was sold for £1,050,000.00.
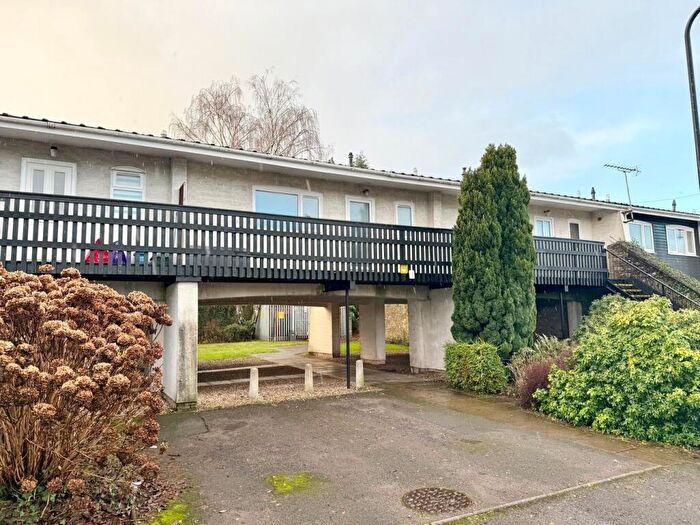
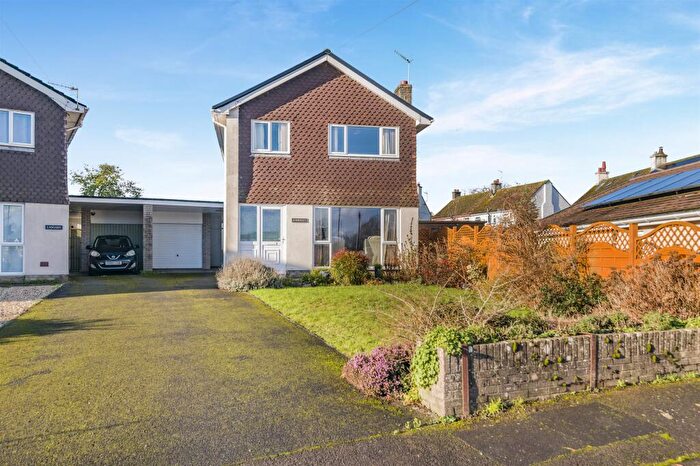
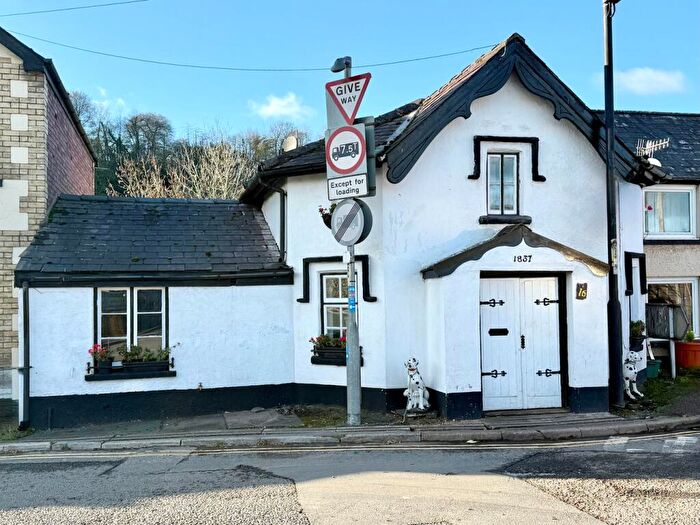
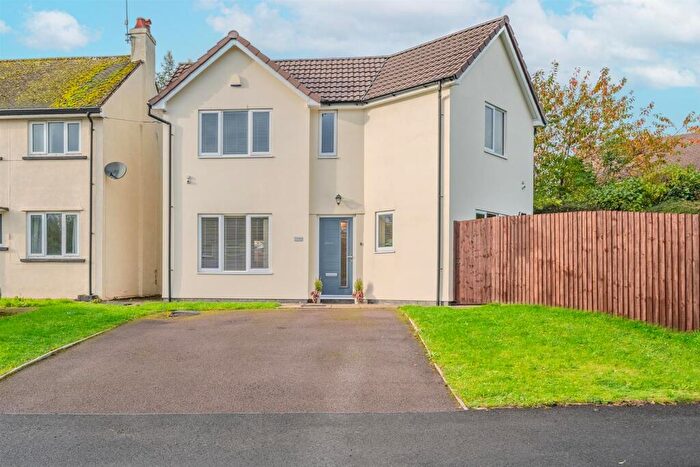
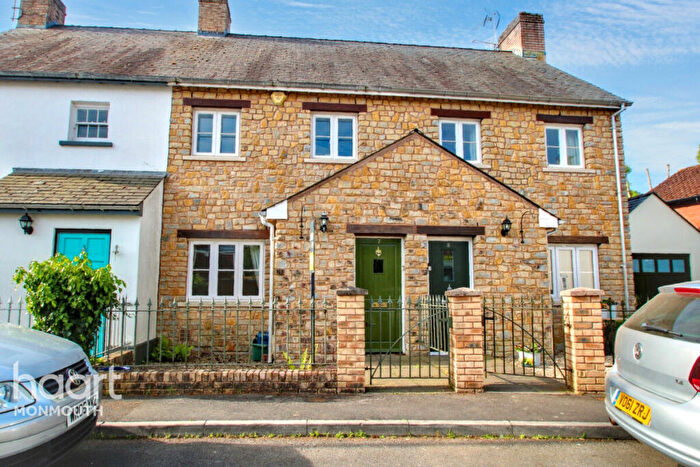
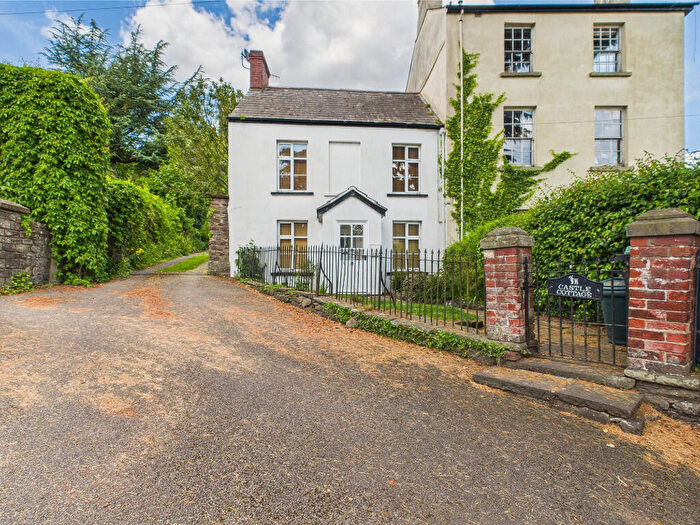
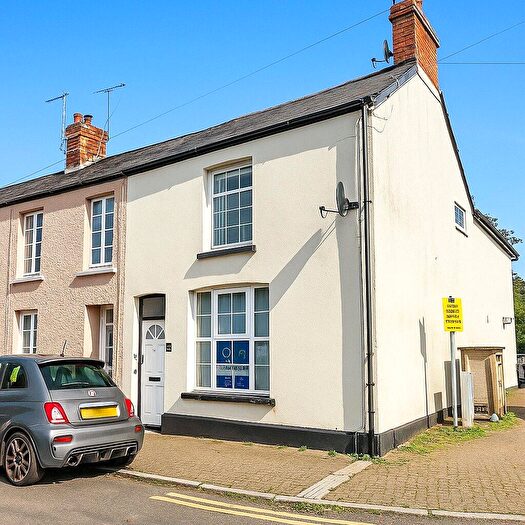
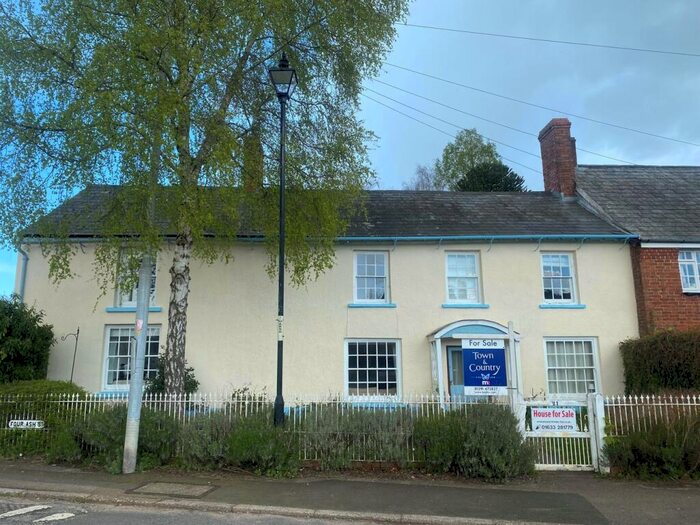
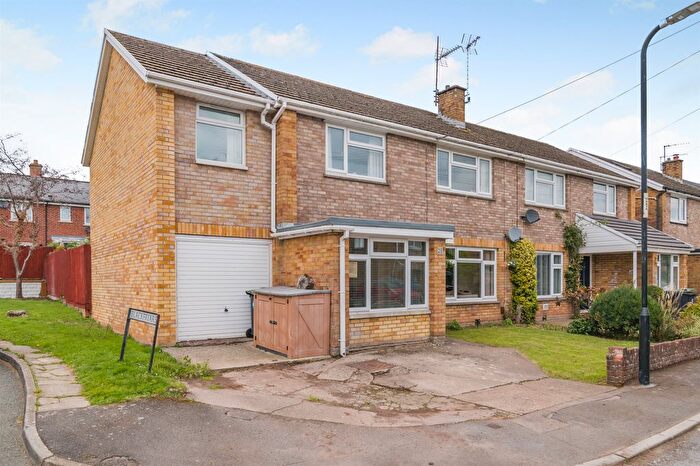
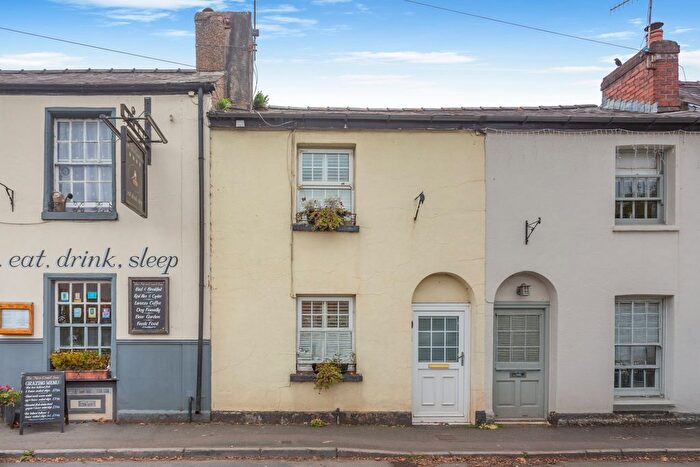
Properties for sale in Usk
Previously listed properties in Usk
Roads and Postcodes in Usk
Navigate through our locations to find the location of your next house in Usk, Usk for sale or to rent.
| Streets | Postcodes |
|---|---|
| Old Market Street | NP15 1AQ NP15 1AL NP15 1UA |
| Abergavenny Road | NP15 1SB NP15 1HX |
| Adam Close | NP15 1SN |
| Baron Street | NP15 1AS |
| Barons Court | NP15 1AY |
| Blackbarn Close | NP15 1BS |
| Blackbarn Lane | NP15 1BP |
| Blackbarn Mews | NP15 1GZ |
| Blestium Drive | NP15 1TS |
| Bridge Street | NP15 1BG NP15 1BQ NP15 1XD NP15 1XQ |
| Burrium Gate | NP15 1TN |
| Cassia Drive | NP15 1TZ |
| Castle Mews | NP15 1QW |
| Castle Oak | NP15 1SG |
| Castle Parade | NP15 1AA |
| Castle Street | NP15 1BU |
| Castle Wood | NP15 1SR |
| Chepstow Road | NP15 1BL NP15 1HN |
| Church Street | NP15 1AG NP15 1AX |
| Clos Croeso | NP15 1AZ |
| Conigar Crescent | NP15 1RX |
| Cwrt Bryn Derwen | NP15 1QN |
| Denbury Mews | NP15 1FB |
| Four Ash Court | NP15 1BE |
| Four Ash Street | NP15 1BN NP15 1BW |
| Ladyhill | NP15 1SH |
| Ladyhill Close | NP15 1SJ |
| Ladywood | NP15 1ST |
| Leybourne Houses | NP15 1BR |
| Manor Court | NP15 1DQ |
| Maryport Street | NP15 1AB NP15 1AD NP15 1AE NP15 1AF NP15 1AH NP15 1ED NP15 1EG NP15 1LH NP15 1RW NP15 1XP |
| Mill Street | NP15 1AN NP15 1AP NP15 1AW |
| Mill Street Close | NP15 1AR |
| Monmouth Road | NP15 1QY NP15 1RR NP15 1SE NP15 1SF NP15 1SD NP15 1SL |
| New Market Street | NP15 1AT NP15 1AU NP15 1BA |
| Porthycarne Close | NP15 1SA |
| Porthycarne Gate | NP15 1RU |
| Porthycarne Street | NP15 1RY NP15 1RZ |
| Priory Court | NP15 1BD |
| Priory Gardens | NP15 1AJ NP15 1BB |
| Priory Street | NP15 1BJ |
| Silure View | NP15 1TR |
| St Marys Way | NP15 1BX |
| The Meadows | NP15 1BT NP15 1BZ |
| Trelawny Close | NP15 1SP |
| Twyn Square | NP15 1BH |
| Ty Brith Gardens | NP15 1BY |
| Usk Bridge Mews | NP15 1SW |
| Wallace Close | NP15 1SQ |
| Woodbine Cottages | NP15 1QZ |
| NP15 1YN NP15 1YS NP15 9AR NP15 9AT NP15 9AX |
Transport near Usk
-
Pontypool and New Inn Station
-
Cwmbran Station
-
Newport (Gwent) Station
-
Abergavenny Station
-
Severn Tunnel Junction Station
- FAQ
- Price Paid By Year
- Property Type Price
Frequently asked questions about Usk
What is the average price for a property for sale in Usk?
The average price for a property for sale in Usk is £364,548. This amount is 15% lower than the average price in Usk. There are 303 property listings for sale in Usk.
What streets have the most expensive properties for sale in Usk?
The streets with the most expensive properties for sale in Usk are Cwrt Bryn Derwen at an average of £778,125, Woodbine Cottages at an average of £635,714 and Chepstow Road at an average of £630,000.
What streets have the most affordable properties for sale in Usk?
The streets with the most affordable properties for sale in Usk are Castle Wood at an average of £162,750, Bridge Street at an average of £207,500 and The Meadows at an average of £216,333.
Which train stations are available in or near Usk?
Some of the train stations available in or near Usk are Pontypool and New Inn, Cwmbran and Newport (Gwent).
Property Price Paid in Usk by Year
The average sold property price by year was:
| Year | Average Sold Price | Price Change |
Sold Properties
|
|---|---|---|---|
| 2025 | £307,921 | -19% |
32 Properties |
| 2024 | £365,771 | -4% |
55 Properties |
| 2023 | £379,212 | -2% |
35 Properties |
| 2022 | £387,785 | 12% |
53 Properties |
| 2021 | £340,381 | 5% |
79 Properties |
| 2020 | £322,752 | 13% |
39 Properties |
| 2019 | £280,898 | -9% |
43 Properties |
| 2018 | £306,311 | 8% |
56 Properties |
| 2017 | £281,058 | 19% |
42 Properties |
| 2016 | £227,470 | -9% |
55 Properties |
| 2015 | £248,980 | 0,4% |
51 Properties |
| 2014 | £247,934 | 7% |
45 Properties |
| 2013 | £231,484 | -15% |
45 Properties |
| 2012 | £266,872 | -13% |
45 Properties |
| 2011 | £301,283 | 15% |
41 Properties |
| 2010 | £255,917 | 8% |
51 Properties |
| 2009 | £234,478 | 3% |
54 Properties |
| 2008 | £226,534 | -19% |
46 Properties |
| 2007 | £269,129 | 11% |
58 Properties |
| 2006 | £240,848 | 18% |
57 Properties |
| 2005 | £196,727 | -17% |
42 Properties |
| 2004 | £230,013 | 25% |
50 Properties |
| 2003 | £173,398 | 11% |
48 Properties |
| 2002 | £154,028 | 16% |
64 Properties |
| 2001 | £129,514 | 17% |
75 Properties |
| 2000 | £107,105 | 26% |
44 Properties |
| 1999 | £79,369 | -7% |
50 Properties |
| 1998 | £84,950 | 19% |
56 Properties |
| 1997 | £69,145 | -26% |
52 Properties |
| 1996 | £87,111 | -1% |
47 Properties |
| 1995 | £88,140 | - |
32 Properties |
Property Price per Property Type in Usk
Here you can find historic sold price data in order to help with your property search.
The average Property Paid Price for specific property types in the last three years are:
| Property Type | Average Sold Price | Sold Properties |
|---|---|---|
| Semi Detached House | £339,761.00 | 52 Semi Detached Houses |
| Detached House | £559,040.00 | 49 Detached Houses |
| Terraced House | £316,887.00 | 45 Terraced Houses |
| Flat | £154,327.00 | 29 Flats |

