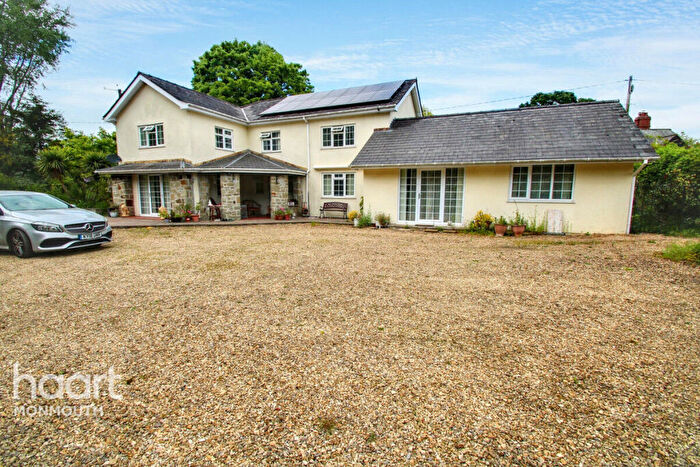
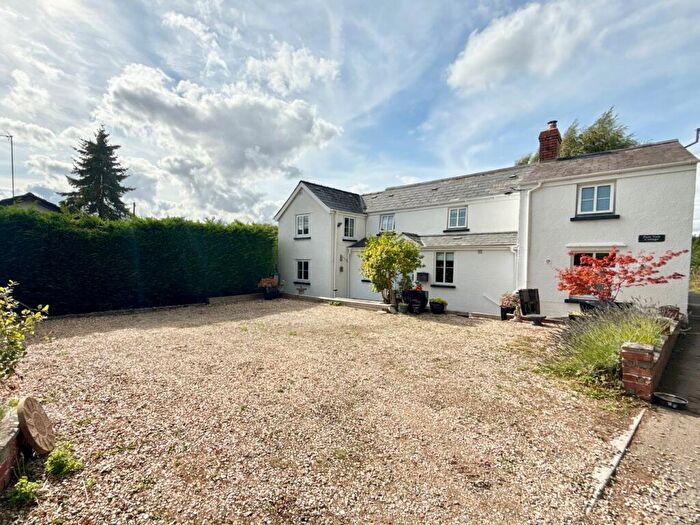
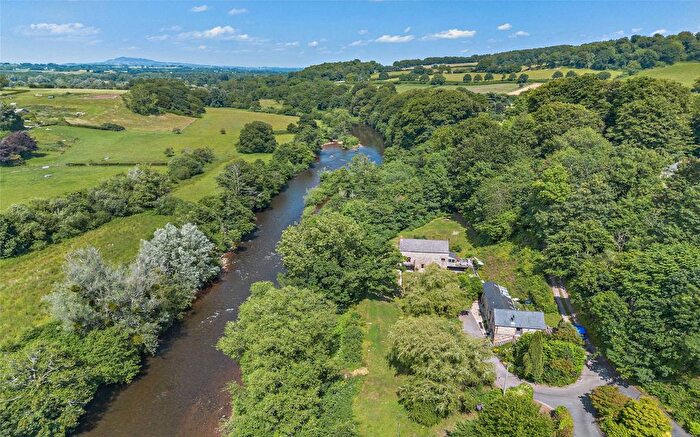
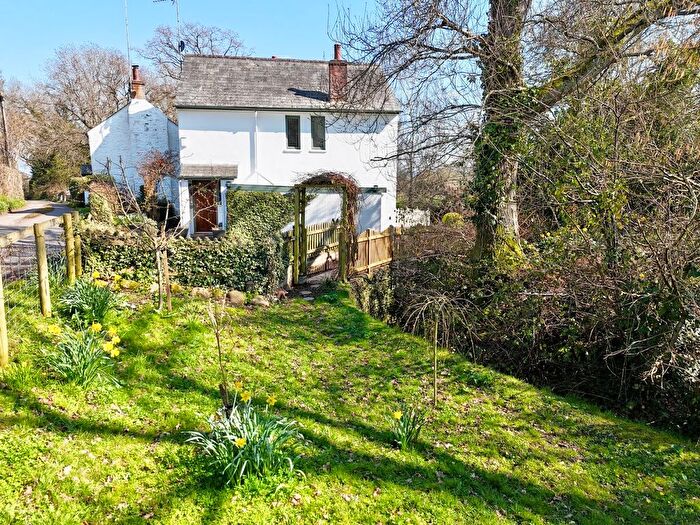
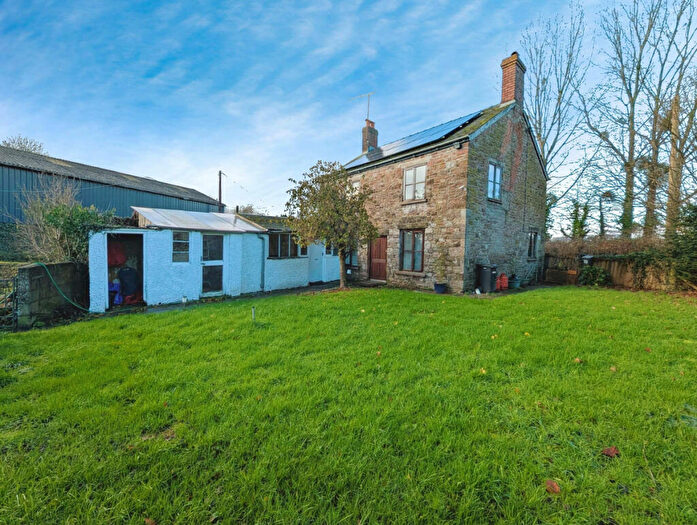
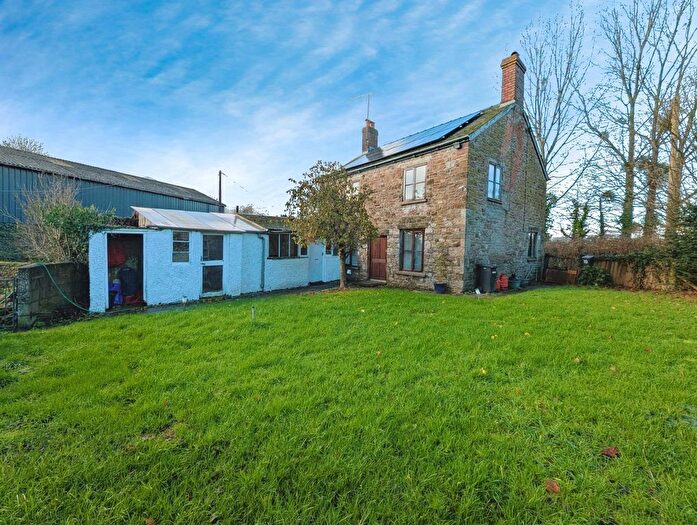
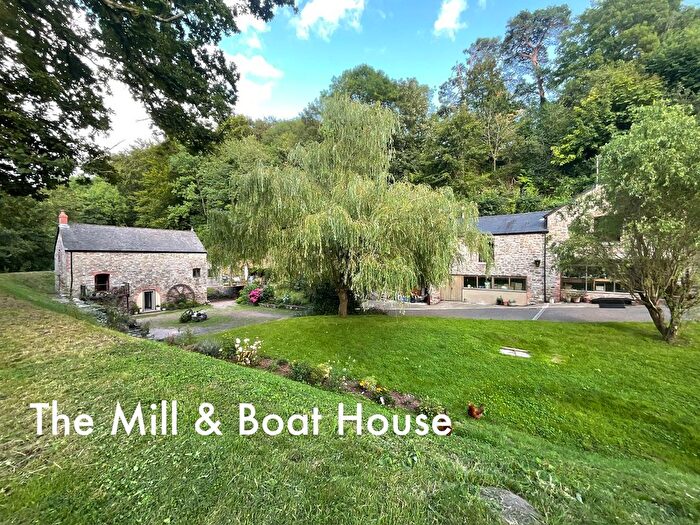
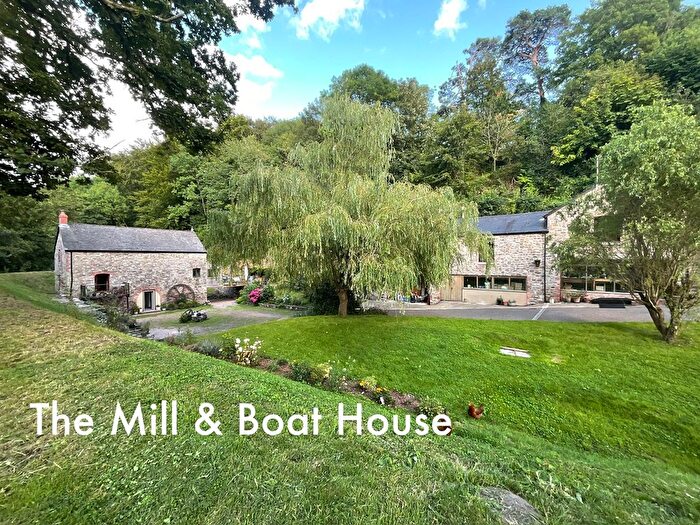
Houses for sale & to rent in Llanover, Usk
House Prices in Llanover
Properties in Llanover have an average house price of £529,800.00 and had 10 Property Transactions within the last 3 years¹.
Llanover is an area in Usk, Sir Fynwy - Monmouthshire with 245 households², where the most expensive property was sold for £925,000.00.
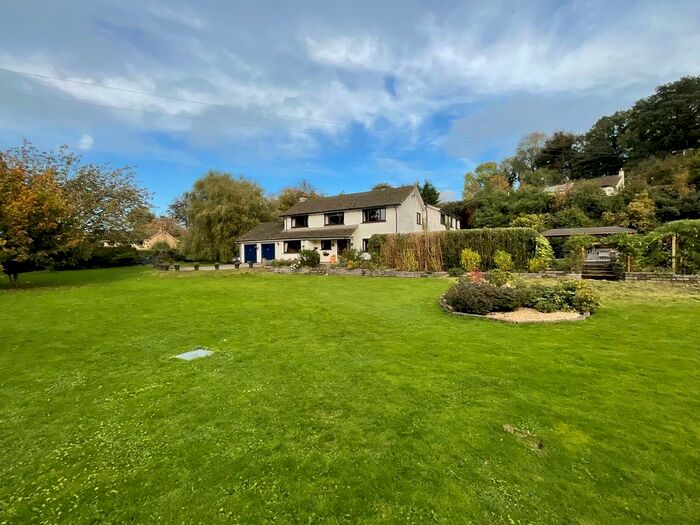
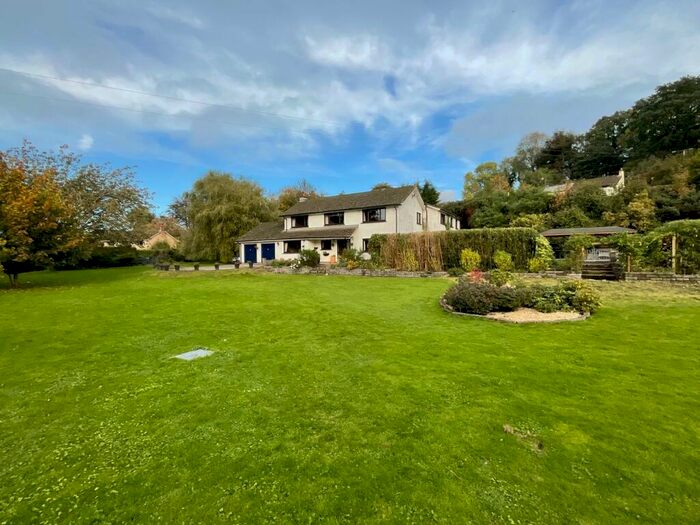
Properties for sale in Llanover
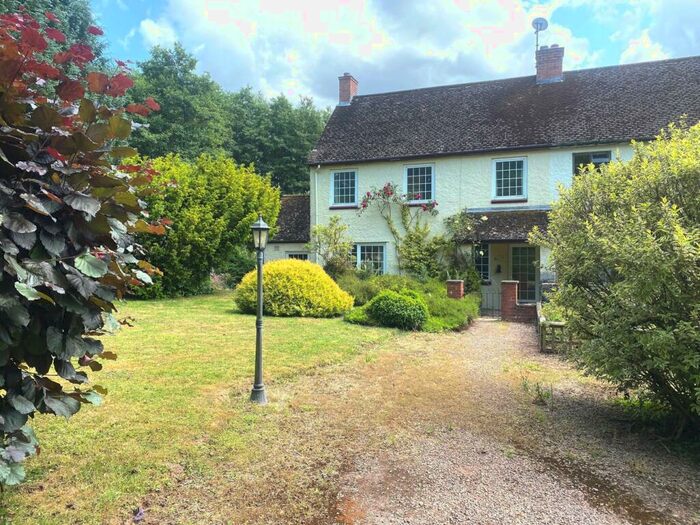
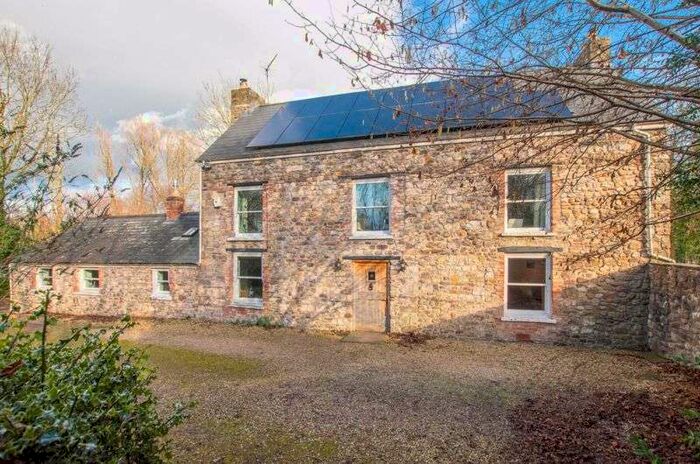
Previously listed properties in Llanover
Roads and Postcodes in Llanover
Navigate through our locations to find the location of your next house in Llanover, Usk for sale or to rent.
| Streets | Postcodes |
|---|---|
| The Pitt | NP15 2BB NP15 2BA NP15 2AP NP15 2BE |
| Abergavenny Road | NP15 2AB NP15 2BH |
| Bersondy | NP15 2AY |
| Black Bear Close | NP15 1EQ |
| Bryncyn | NP15 2AT |
| Bryngwyn | NP15 2AE NP15 2BN NP15 2DA NP15 2DD NP15 2BL NP15 2BS NP15 2BW NP15 2DN NP15 2JH |
| Brynteg | NP15 2AX |
| Cae Capel | NP15 2AQ |
| Clytha | NP15 2BQ |
| Clytha Hill | NP15 2BP NP15 2JJ |
| Croes Bychan | NP15 2JQ |
| Great Oak | NP15 2AG NP15 2AN NP15 2AH NP15 2BJ |
| Great Oak Road | NP15 2AF |
| Llanarth | NP15 2AU NP15 2AR NP15 2BR NP15 2LU NP15 2LY NP15 2LZ NP15 2NA NP15 2YB NP15 2YD |
| Maes Gwynne | NP15 2BD |
| Pen-y-parc | NP15 2AS |
| Plas Ivor | NP15 2AZ |
| Plas Newydd | NP15 2AW |
| Tyr Gwent | NP15 2LX |
| Wern-y-cwrt | NP15 2JG |
| NP15 1JN NP15 1JP NP15 1JS NP15 1JT NP15 1JW NP15 1JY NP15 1JJ NP15 1JL NP15 1JR NP15 2AJ NP15 2AL NP15 2DB NP15 2JP NP15 2NB |
Transport near Llanover
- FAQ
- Price Paid By Year
- Property Type Price
Frequently asked questions about Llanover
What is the average price for a property for sale in Llanover?
The average price for a property for sale in Llanover is £529,800. This amount is 24% higher than the average price in Usk. There are 28 property listings for sale in Llanover.
What streets have the most expensive properties for sale in Llanover?
The street with the most expensive properties for sale in Llanover is Black Bear Close at an average of £731,500.
What streets have the most affordable properties for sale in Llanover?
The street with the most affordable properties for sale in Llanover is Bryngwyn at an average of £540,000.
Which train stations are available in or near Llanover?
Some of the train stations available in or near Llanover are Abergavenny, Pontypool and New Inn and Cwmbran.
Property Price Paid in Llanover by Year
The average sold property price by year was:
| Year | Average Sold Price | Price Change |
Sold Properties
|
|---|---|---|---|
| 2025 | £535,000 | -24% |
1 Property |
| 2024 | £665,000 | 41% |
4 Properties |
| 2023 | £391,000 | -19% |
3 Properties |
| 2022 | £465,000 | -2% |
2 Properties |
| 2021 | £475,000 | 27% |
3 Properties |
| 2019 | £345,000 | -11% |
2 Properties |
| 2018 | £381,666 | 3% |
3 Properties |
| 2017 | £370,490 | -56% |
5 Properties |
| 2016 | £576,400 | 37% |
5 Properties |
| 2015 | £360,400 | 11% |
5 Properties |
| 2014 | £320,000 | 9% |
1 Property |
| 2013 | £289,875 | -37% |
4 Properties |
| 2012 | £398,500 | -20% |
4 Properties |
| 2011 | £480,000 | 39% |
2 Properties |
| 2009 | £293,500 | -7% |
2 Properties |
| 2008 | £315,000 | 5% |
3 Properties |
| 2007 | £300,000 | -2% |
3 Properties |
| 2006 | £305,802 | -50% |
2 Properties |
| 2005 | £457,500 | 12% |
3 Properties |
| 2003 | £404,000 | 33% |
3 Properties |
| 2002 | £271,500 | 45% |
5 Properties |
| 2001 | £150,375 | 1% |
4 Properties |
| 2000 | £149,000 | 11% |
1 Property |
| 1999 | £133,053 | -24% |
6 Properties |
| 1998 | £164,750 | 35% |
2 Properties |
| 1997 | £107,833 | -38% |
3 Properties |
| 1996 | £148,500 | 24% |
4 Properties |
| 1995 | £112,500 | - |
5 Properties |
Property Price per Property Type in Llanover
Here you can find historic sold price data in order to help with your property search.
The average Property Paid Price for specific property types in the last three years are:
| Property Type | Average Sold Price | Sold Properties |
|---|---|---|
| Semi Detached House | £297,500.00 | 2 Semi Detached Houses |
| Detached House | £587,875.00 | 8 Detached Houses |

