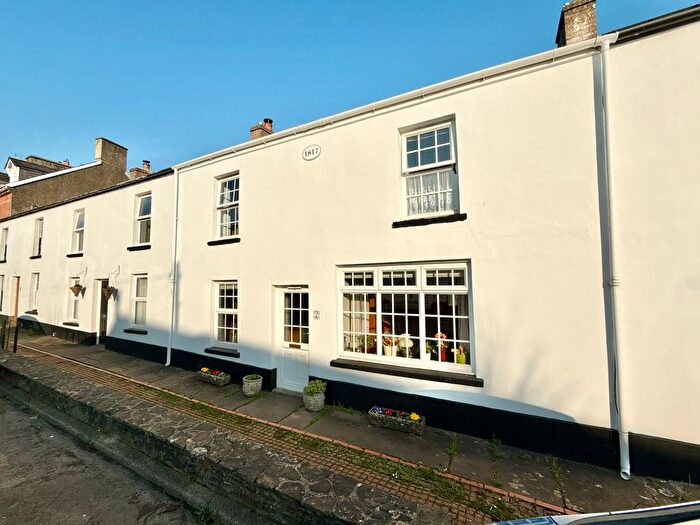
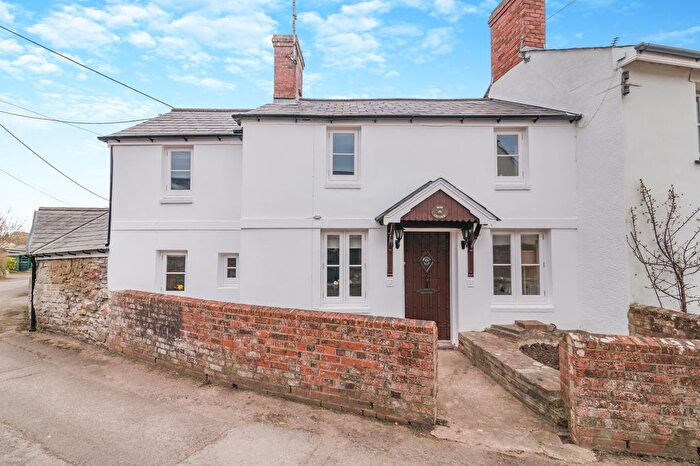
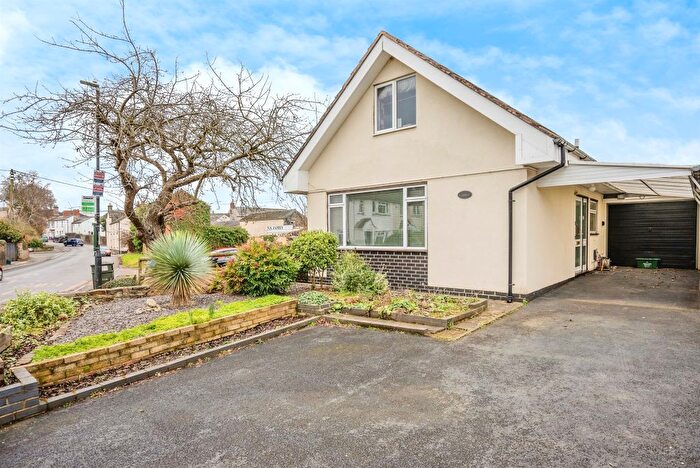
Houses for sale & to rent in Raglan, Usk
House Prices in Raglan
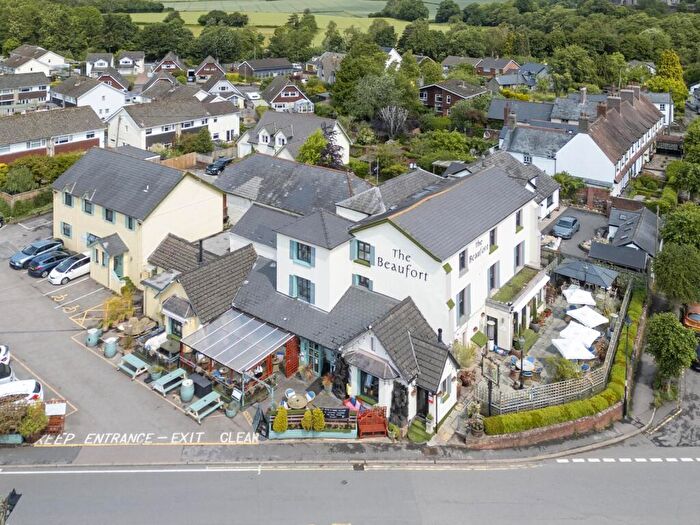
Properties in Raglan have an average house price of £423,108.00 and had 61 Property Transactions within the last 3 years¹.
Raglan is an area in Usk, Sir Fynwy - Monmouthshire with 789 households², where the most expensive property was sold for £862,500.00.
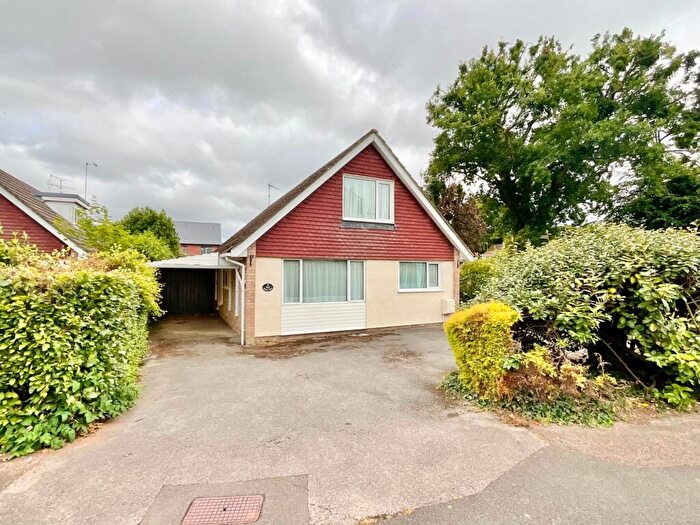
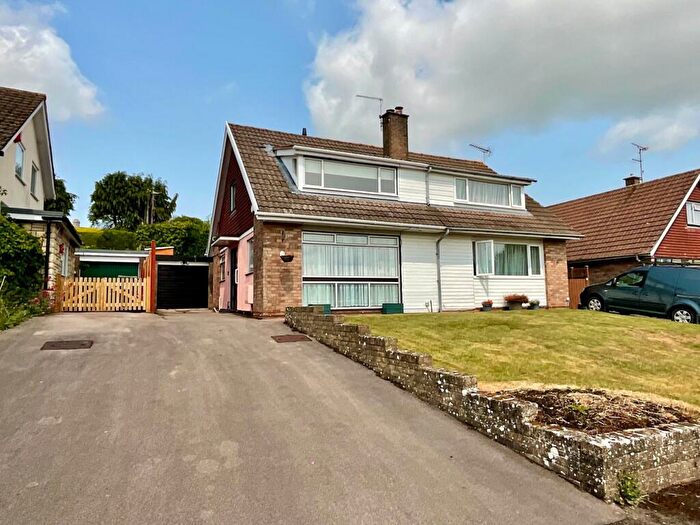
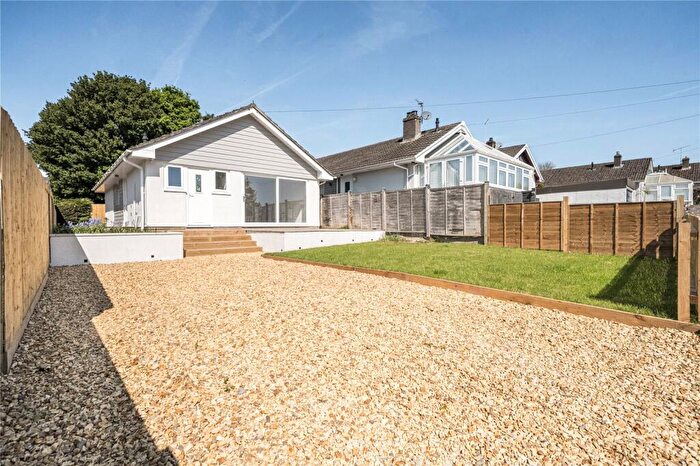
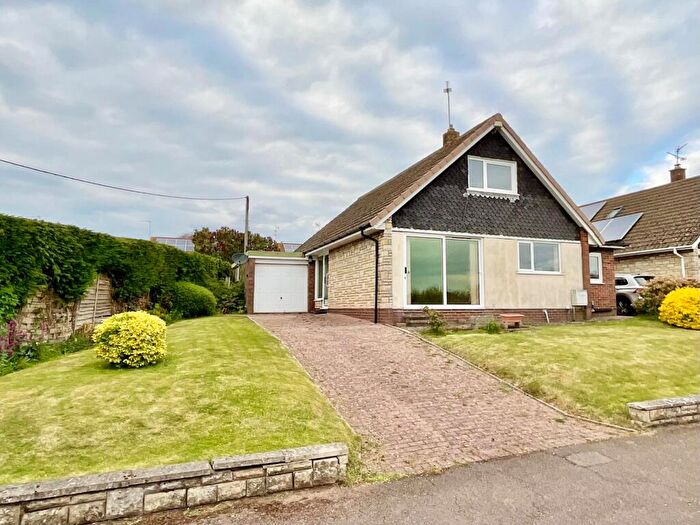
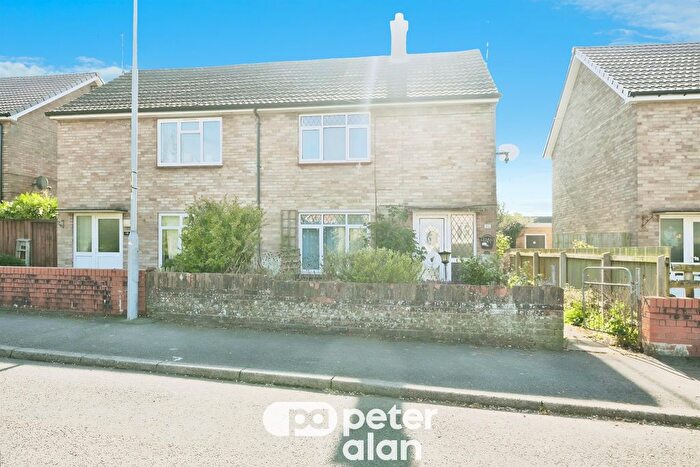
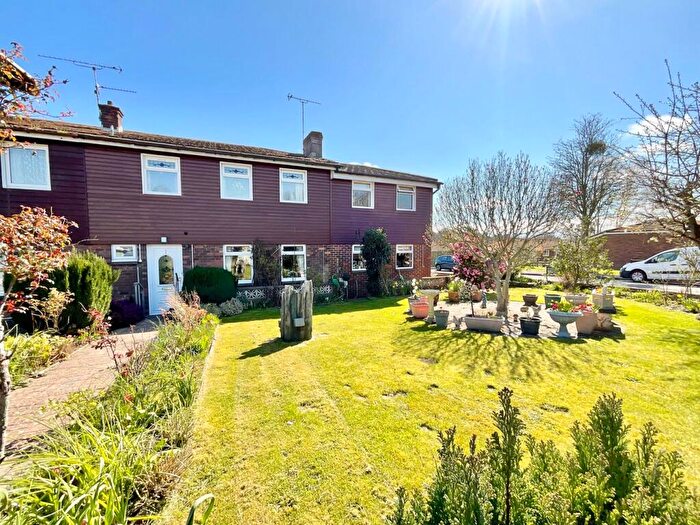
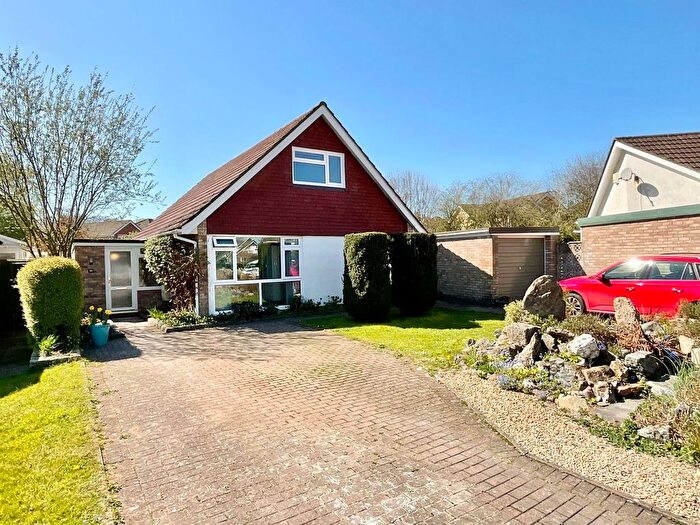
Properties for sale in Raglan
Previously listed properties in Raglan
Roads and Postcodes in Raglan
Navigate through our locations to find the location of your next house in Raglan, Usk for sale or to rent.
| Streets | Postcodes |
|---|---|
| Abergavenny Road | NP15 2AA |
| Barton Bridge Close | NP15 2JW |
| Barton Bridge Rise | NP15 2JU |
| Beaufort Gardens | NP15 2DP |
| Broom Lane | NP15 2HN NP15 2HW |
| Caestory Avenue | NP15 2EH |
| Caestory Crescent | NP15 2EG NP15 2EQ |
| Castle Hill | NP15 2DT |
| Castle Road | NP15 2JZ |
| Castle Street | NP15 2DS |
| Chapel Close | NP15 2EW |
| Chepstow Road | NP15 2EN NP15 2HY NP15 2HZ NP15 2HX |
| Cuckoos Row | NP15 2HH |
| Elms Road | NP15 2EX NP15 2EY NP15 2DX NP15 2EZ |
| Ethley Drive | NP15 2FD |
| Fairfax View | NP15 2DR |
| Fayre Oaks | NP15 2HA |
| High Street | NP15 2DY NP15 2EA |
| Hillside | NP15 1DW |
| Monmouth Road | NP15 2ET NP15 2EU NP15 2HG NP15 2HQ NP15 2LA NP15 2LB |
| Old Monmouth Road | NP15 2JX NP15 2JY |
| Orchard Close | NP15 2EL |
| Orchard Cottages | NP15 1DZ |
| Primrose Green | NP15 2DU |
| Prince Charles Close | NP15 2AD NP15 2HD |
| Prince Charles Road | NP15 2FB |
| Raglan Enterprise Park | NP15 2JB |
| Rhiwlas | NP15 2JL |
| Somerset Drive | NP15 2DW |
| Station Road | NP15 2EP NP15 2ER NP15 2ES |
| Sunnyvale | NP15 2EF |
| The Beeches | NP15 2HE |
| The Hawthornes | NP15 2HF |
| The Walks | NP15 1DR |
| The Willows | NP15 2HB |
| Ton Lane | NP15 2HU |
| Ton Mawr | NP15 1DY |
| Twyn Lane | NP15 2HP |
| Twyn Y Sherriff | NP15 2HT |
| Usk Road | NP15 2EB NP15 2HJ NP15 2HL NP15 2HR NP15 2HS NP15 2ED |
| Warrage Road | NP15 2LD |
| Wilcae Terrace | NP15 2EE |
| NP15 1DH NP15 1DL NP15 1DN NP15 1DS NP15 1EE NP15 2BX NP15 2EJ NP15 2JA NP15 1DG NP15 1DJ NP15 1DP NP15 1EB NP15 1RS NP15 2BT |
Transport near Raglan
- FAQ
- Price Paid By Year
- Property Type Price
Frequently asked questions about Raglan
What is the average price for a property for sale in Raglan?
The average price for a property for sale in Raglan is £423,108. This amount is 1% lower than the average price in Usk. There are 126 property listings for sale in Raglan.
What streets have the most expensive properties for sale in Raglan?
The streets with the most expensive properties for sale in Raglan are Elms Road at an average of £800,000, The Walks at an average of £755,000 and Monmouth Road at an average of £558,500.
What streets have the most affordable properties for sale in Raglan?
The streets with the most affordable properties for sale in Raglan are Sunnyvale at an average of £265,800, Fairfax View at an average of £277,683 and Primrose Green at an average of £280,000.
Which train stations are available in or near Raglan?
Some of the train stations available in or near Raglan are Abergavenny, Pontypool and New Inn and Cwmbran.
Property Price Paid in Raglan by Year
The average sold property price by year was:
| Year | Average Sold Price | Price Change |
Sold Properties
|
|---|---|---|---|
| 2025 | £529,843 | 12% |
8 Properties |
| 2024 | £464,125 | 8% |
12 Properties |
| 2023 | £425,730 | 17% |
21 Properties |
| 2022 | £353,050 | -21% |
20 Properties |
| 2021 | £427,117 | 30% |
32 Properties |
| 2020 | £299,041 | -14% |
12 Properties |
| 2019 | £339,472 | 17% |
26 Properties |
| 2018 | £282,078 | -2% |
28 Properties |
| 2017 | £287,972 | 5% |
20 Properties |
| 2016 | £274,647 | -10% |
20 Properties |
| 2015 | £302,406 | 7% |
22 Properties |
| 2014 | £281,782 | 7% |
20 Properties |
| 2013 | £261,070 | 4% |
12 Properties |
| 2012 | £249,877 | -0,1% |
18 Properties |
| 2011 | £250,163 | -2% |
15 Properties |
| 2010 | £255,423 | 6% |
13 Properties |
| 2009 | £240,909 | -59% |
11 Properties |
| 2008 | £382,065 | 27% |
10 Properties |
| 2007 | £278,869 | 3% |
23 Properties |
| 2006 | £271,026 | -1% |
30 Properties |
| 2005 | £274,780 | 12% |
23 Properties |
| 2004 | £243,083 | 16% |
18 Properties |
| 2003 | £203,980 | 24% |
31 Properties |
| 2002 | £155,616 | 10% |
47 Properties |
| 2001 | £140,651 | 8% |
33 Properties |
| 2000 | £128,812 | 17% |
16 Properties |
| 1999 | £106,637 | 12% |
32 Properties |
| 1998 | £93,570 | 13% |
17 Properties |
| 1997 | £81,482 | -10% |
29 Properties |
| 1996 | £89,518 | 18% |
25 Properties |
| 1995 | £73,169 | - |
30 Properties |
Property Price per Property Type in Raglan
Here you can find historic sold price data in order to help with your property search.
The average Property Paid Price for specific property types in the last three years are:
| Property Type | Average Sold Price | Sold Properties |
|---|---|---|
| Semi Detached House | £313,430.00 | 18 Semi Detached Houses |
| Detached House | £486,468.00 | 36 Detached Houses |
| Terraced House | £379,285.00 | 7 Terraced Houses |

