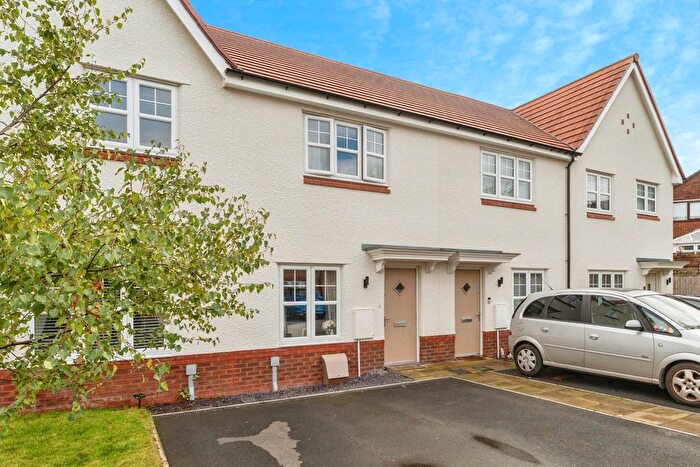
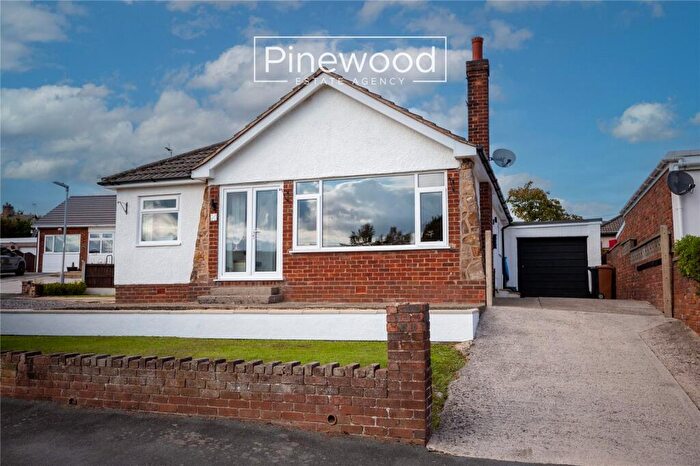
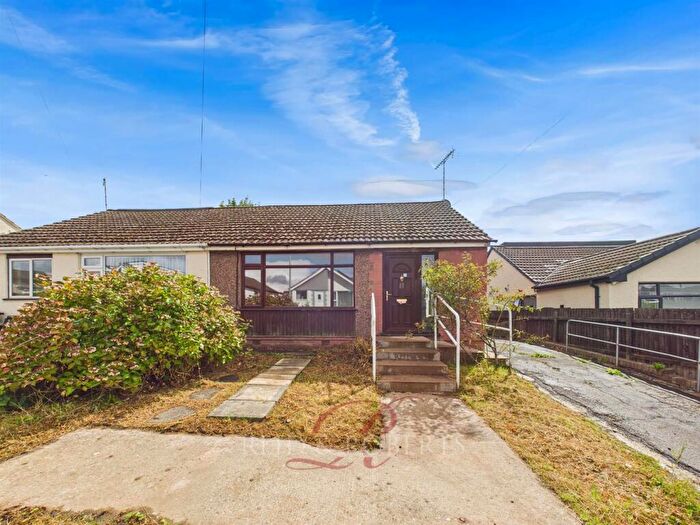
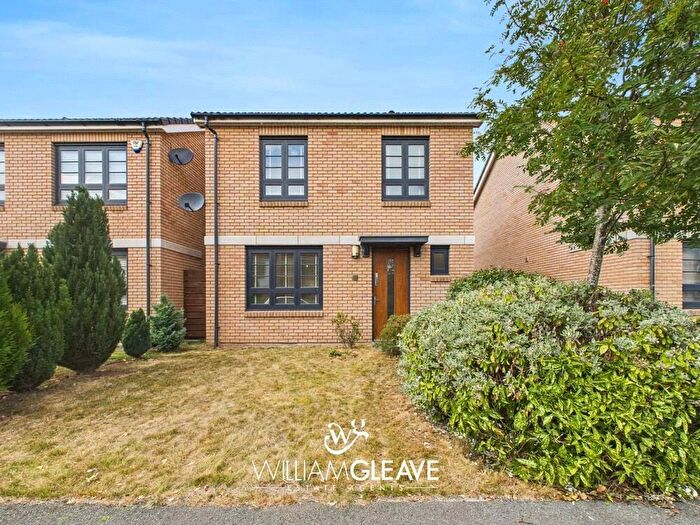
Houses for sale & to rent in Buckley Bistre East, Buckley
House Prices in Buckley Bistre East
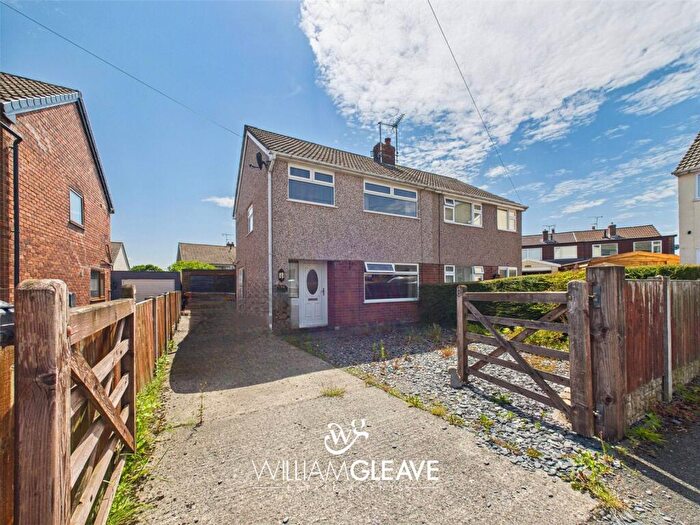
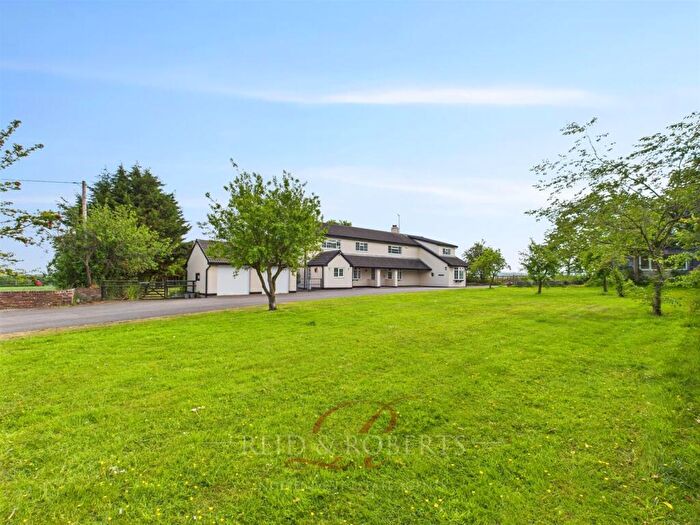
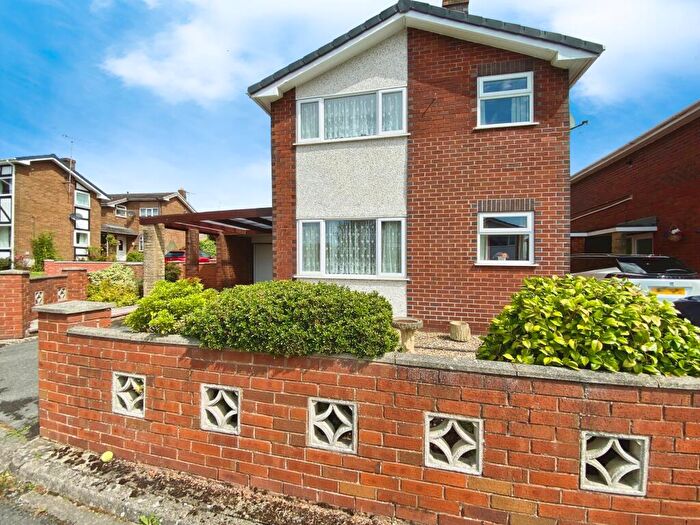
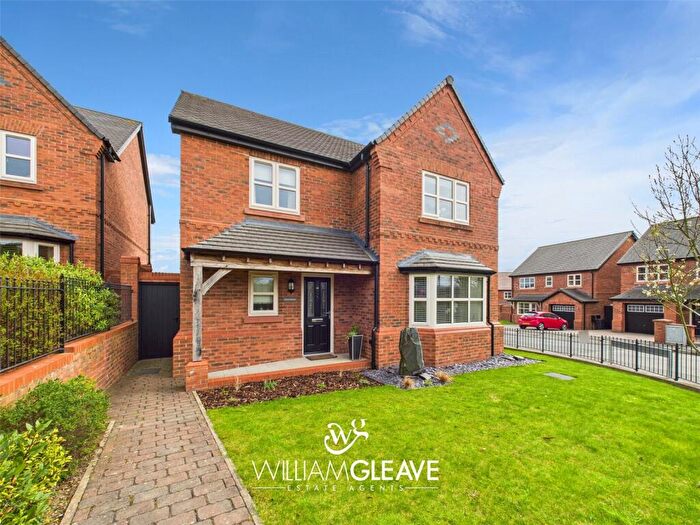
Properties in Buckley Bistre East have an average house price of £202,593.00 and had 189 Property Transactions within the last 3 years¹.
Buckley Bistre East is an area in Buckley, Sir y Fflint - Flintshire with 1,460 households², where the most expensive property was sold for £475,000.00.
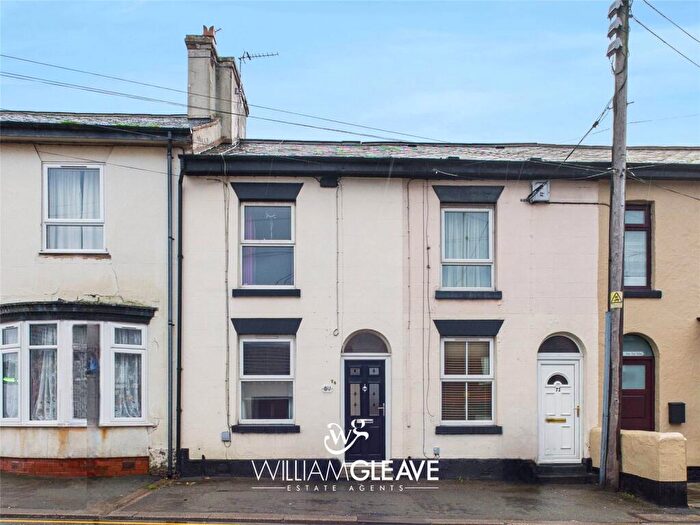
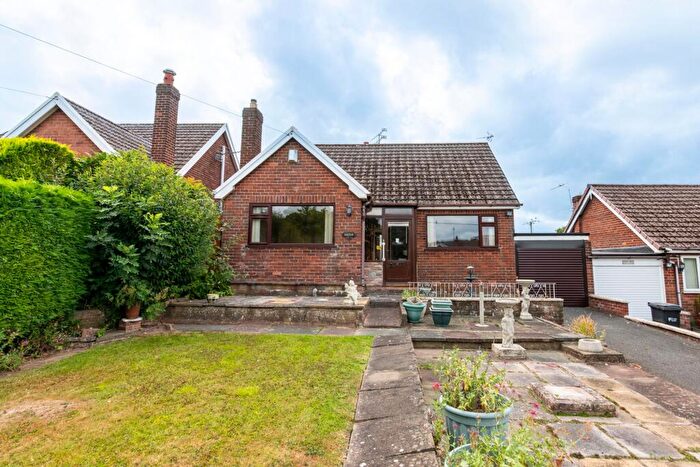
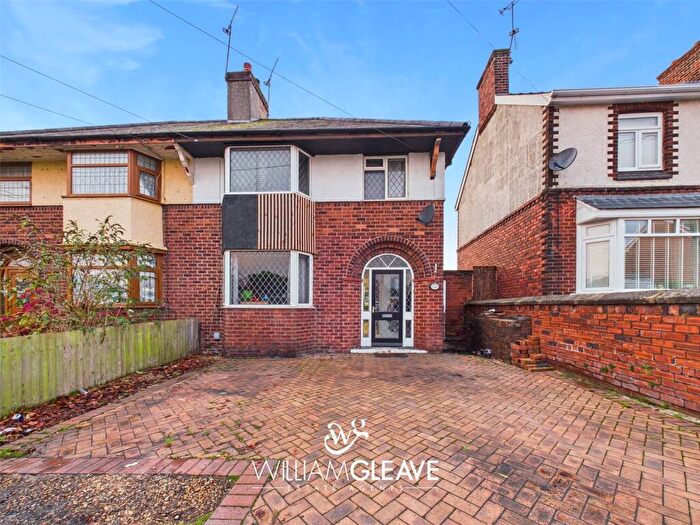
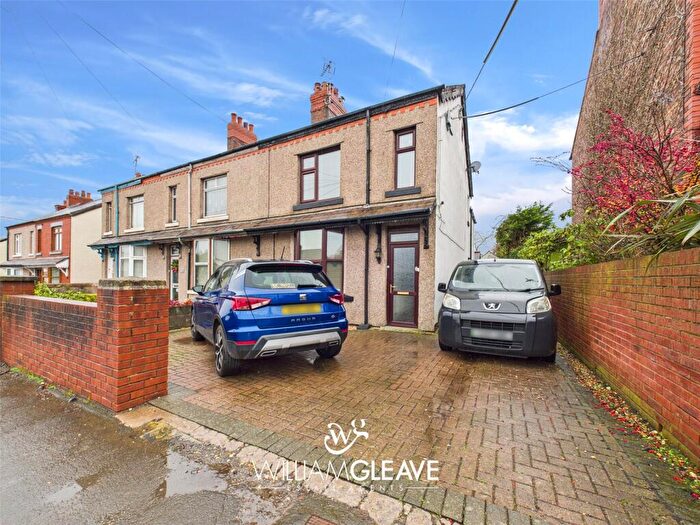
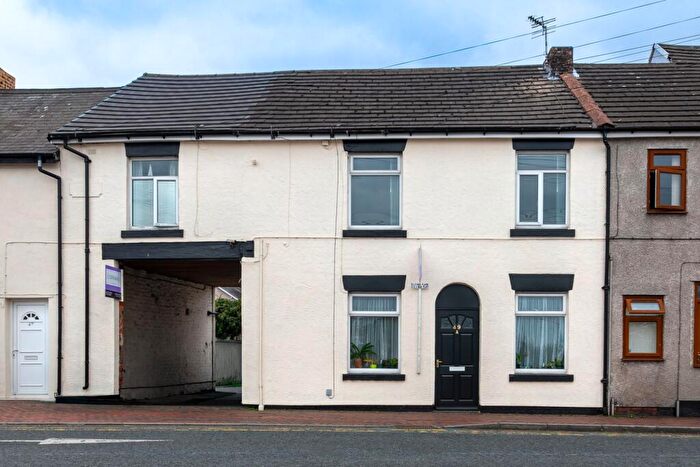
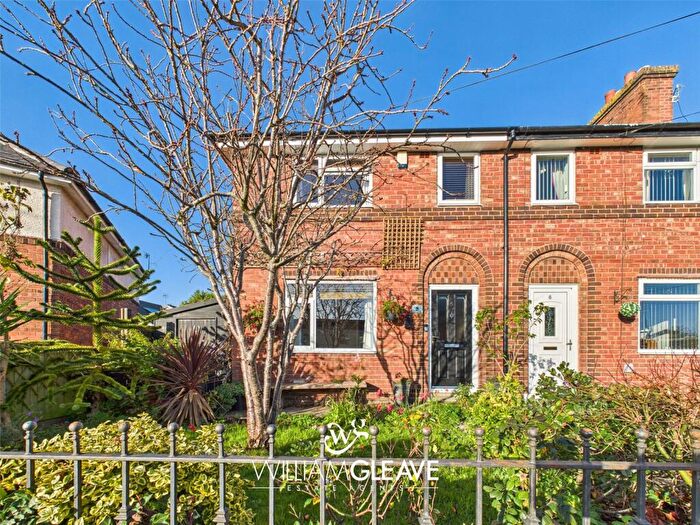
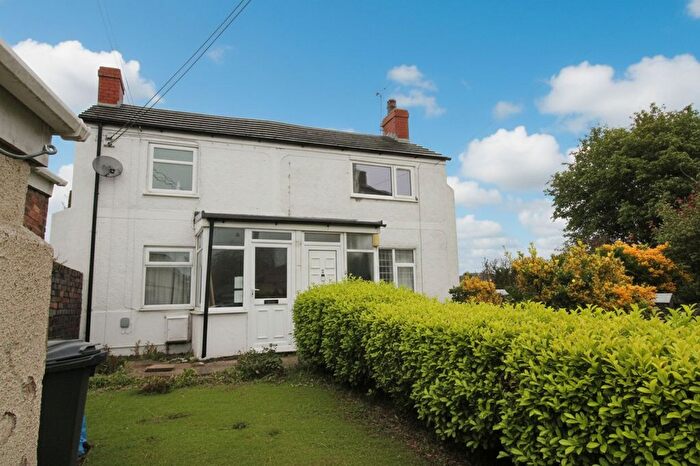
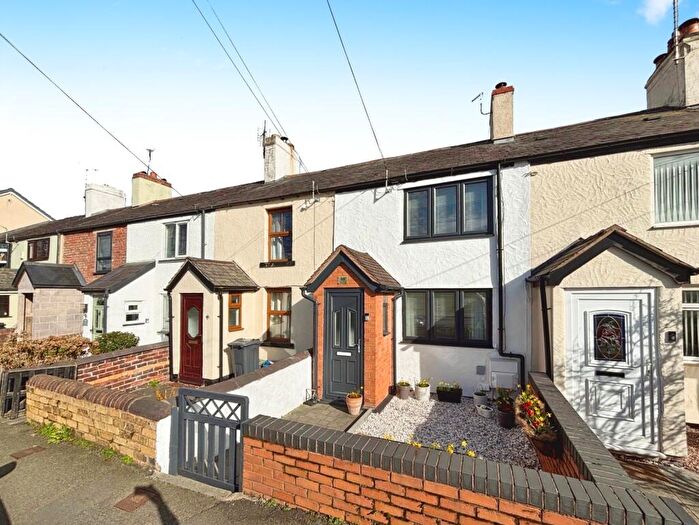
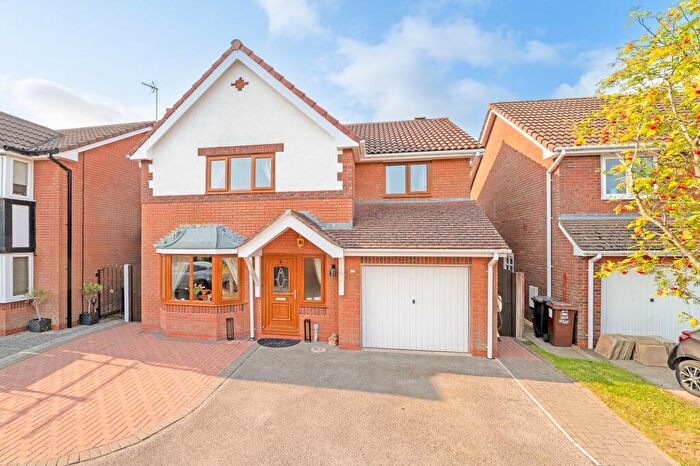
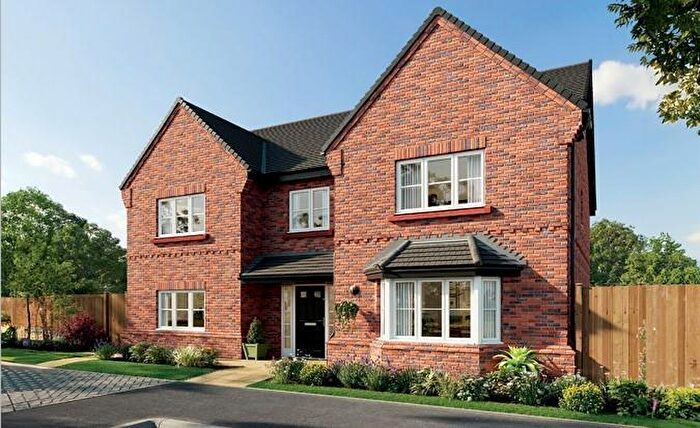
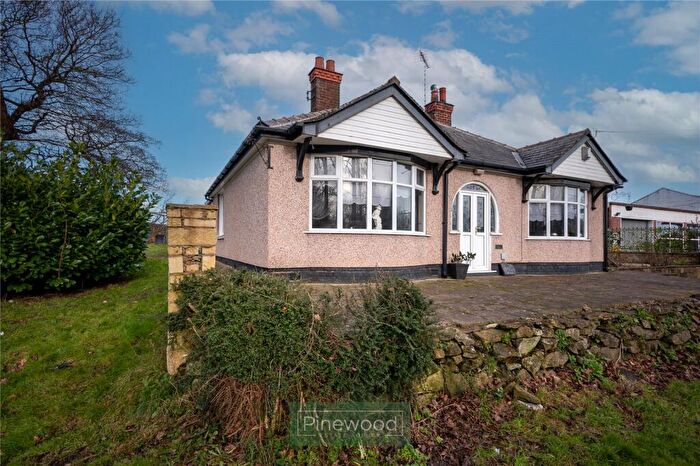
Properties for sale in Buckley Bistre East
Roads and Postcodes in Buckley Bistre East
Navigate through our locations to find the location of your next house in Buckley Bistre East, Buckley for sale or to rent.
| Streets | Postcodes |
|---|---|
| Alexandra Court | CH7 2DA |
| Army Lane | CH7 3FN |
| Avondale Road | CH7 3BP CH7 3BW |
| Bank Row | CH7 3BJ |
| Bannel Lane | CH7 3AP |
| Berwyn Close | CH7 2BG |
| Birch Close | CH7 2AY |
| Boundary Row | CH7 2DH |
| Bramble Close | CH7 2BD |
| Briar Drive | CH7 2AN CH7 2AP CH7 2AS CH7 2AW |
| Brickfields | CH7 3BE |
| Brook Street | CH7 3AL |
| Brunswick Road | CH7 2EF CH7 2EP CH7 2ER |
| Chester Road | CH7 3AH |
| Conway Avenue | CH7 3BS |
| Coppa View | CH7 2AA |
| Coppafield Close | CH7 2AH |
| Cwrt Brenig | CH7 2AF |
| Delamere Avenue | CH7 3BU |
| Duffryn Close | CH7 3BT |
| Fern Leigh | CH7 3AN |
| Ffordd Dol Gwyn Buckley | CH7 2DQ |
| Hanmer Close | CH7 2QL |
| Hawthorne Avenue | CH7 2QN |
| Highfield Drive | CH7 2AL |
| Jubilee Court | CH7 2DJ CH7 2DL |
| Jubilee Road | CH7 2BF |
| Lambs Lane | CH7 2HW |
| Laurel Drive | CH7 2QP |
| Lea Drive | CH7 2BQ |
| Lexham Green Close | CH7 2HP CH7 2HS |
| Little Mountain Industrial Estate | CH7 3AG |
| Little Mountain Road | CH7 3BB CH7 3BY |
| Lyme Grove | CH7 2AB CH7 2AD |
| Maelor Close | CH7 2AT |
| Manor Drive | CH7 2HX |
| Marbury Avenue | CH7 2QJ |
| Meadow View | CH7 3BX |
| Megs Lane | CH7 2AE CH7 2AG |
| Moorefields | CH7 2AQ |
| Newthorn Place | CH7 2EY |
| Oakfield Road | CH7 2AR |
| Overton Close | CH7 2AU CH7 2AX |
| Padeswood Court | CH7 2HH |
| Padeswood Road | CH7 2JP CH7 2JW |
| Penley Road | CH7 2BB |
| Precinct Way | CH7 2EG |
| Prince Of Wales Court | CH7 3AS CH7 3AT |
| Roman Way | CH7 2EQ |
| Rose Mount | CH7 3AW |
| South View | CH7 2AZ |
| Spon Green | CH7 3BH CH7 3BL CH7 3BN CH7 3BQ |
| Station Road | CH7 3AY |
| Swain Avenue | CH7 3BR |
| Warren Crescent | CH7 3BZ |
| West View | CH7 2BA |
| Westbrook Drive | CH7 2AJ |
| Westbury Drive | CH7 3BA |
| Wheatley Court | CH7 2DN |
| CH7 2DP CH7 2DR CH7 2DT |
Transport near Buckley Bistre East
- FAQ
- Price Paid By Year
- Property Type Price
Frequently asked questions about Buckley Bistre East
What is the average price for a property for sale in Buckley Bistre East?
The average price for a property for sale in Buckley Bistre East is £202,593. This amount is 5% lower than the average price in Buckley. There are 568 property listings for sale in Buckley Bistre East.
What streets have the most expensive properties for sale in Buckley Bistre East?
The streets with the most expensive properties for sale in Buckley Bistre East are Ffordd Dol Gwyn Buckley at an average of £347,590, Meadow View at an average of £325,000 and Bannel Lane at an average of £303,333.
What streets have the most affordable properties for sale in Buckley Bistre East?
The streets with the most affordable properties for sale in Buckley Bistre East are Newthorn Place at an average of £88,062, Brickfields at an average of £88,500 and Lambs Lane at an average of £106,000.
Which train stations are available in or near Buckley Bistre East?
Some of the train stations available in or near Buckley Bistre East are Buckley, Penyffordd and Hawarden.
Property Price Paid in Buckley Bistre East by Year
The average sold property price by year was:
| Year | Average Sold Price | Price Change |
Sold Properties
|
|---|---|---|---|
| 2025 | £173,768 | -17% |
25 Properties |
| 2024 | £203,330 | 1% |
59 Properties |
| 2023 | £200,443 | -8% |
48 Properties |
| 2022 | £216,284 | 17% |
57 Properties |
| 2021 | £179,540 | 5% |
52 Properties |
| 2020 | £170,036 | 4% |
51 Properties |
| 2019 | £162,998 | 6% |
58 Properties |
| 2018 | £152,886 | 1% |
68 Properties |
| 2017 | £151,345 | 7% |
50 Properties |
| 2016 | £140,115 | -6% |
53 Properties |
| 2015 | £148,294 | 15% |
44 Properties |
| 2014 | £125,434 | -9% |
42 Properties |
| 2013 | £137,048 | 19% |
52 Properties |
| 2012 | £111,288 | -10% |
25 Properties |
| 2011 | £122,945 | 0,2% |
23 Properties |
| 2010 | £122,757 | -1% |
34 Properties |
| 2009 | £123,759 | -10% |
22 Properties |
| 2008 | £136,705 | -1% |
25 Properties |
| 2007 | £137,688 | 3% |
49 Properties |
| 2006 | £133,745 | 3% |
66 Properties |
| 2005 | £129,119 | 18% |
51 Properties |
| 2004 | £106,167 | 16% |
52 Properties |
| 2003 | £89,580 | 10% |
66 Properties |
| 2002 | £80,633 | 23% |
104 Properties |
| 2001 | £62,251 | 13% |
77 Properties |
| 2000 | £54,026 | 14% |
56 Properties |
| 1999 | £46,700 | 1% |
37 Properties |
| 1998 | £46,003 | -11% |
42 Properties |
| 1997 | £50,990 | 20% |
65 Properties |
| 1996 | £40,710 | -12% |
59 Properties |
| 1995 | £45,711 | - |
64 Properties |
Property Price per Property Type in Buckley Bistre East
Here you can find historic sold price data in order to help with your property search.
The average Property Paid Price for specific property types in the last three years are:
| Property Type | Average Sold Price | Sold Properties |
|---|---|---|
| Semi Detached House | £173,812.00 | 93 Semi Detached Houses |
| Detached House | £269,299.00 | 69 Detached Houses |
| Terraced House | £140,954.00 | 22 Terraced Houses |
| Flat | £88,600.00 | 5 Flats |

