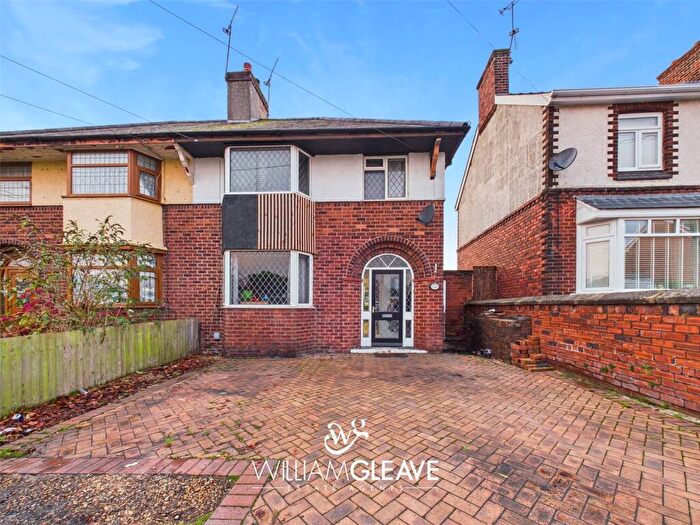
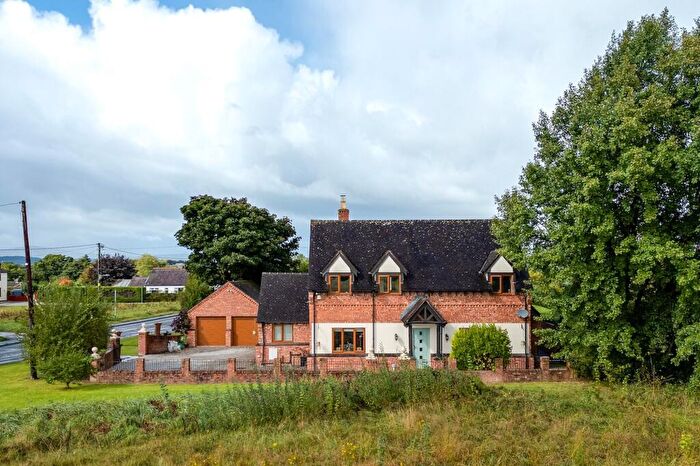
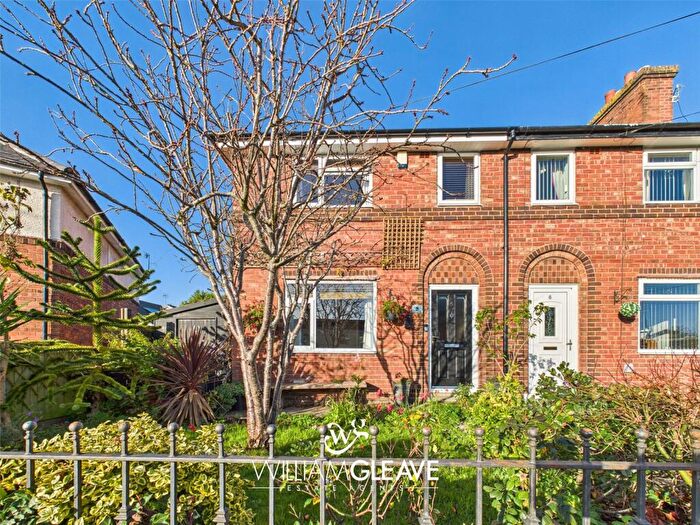
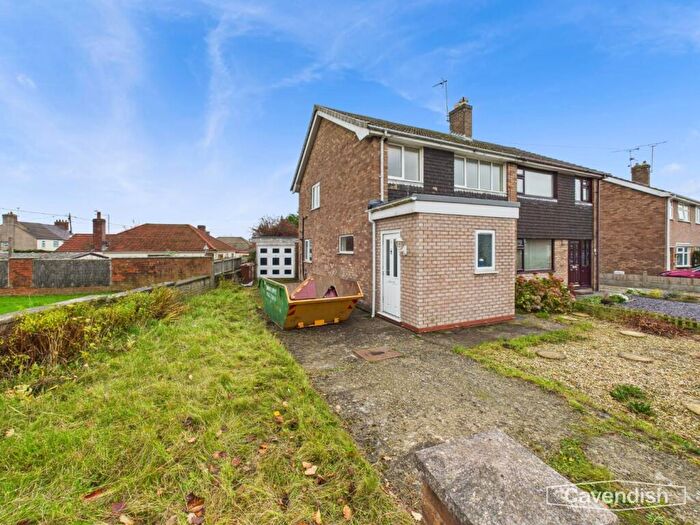
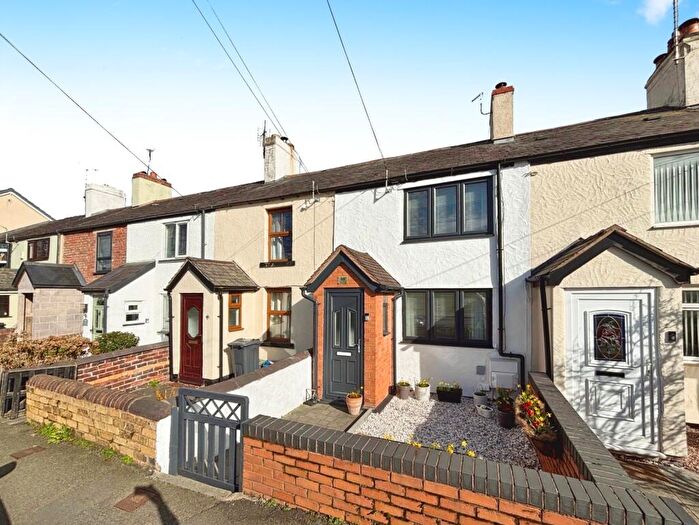
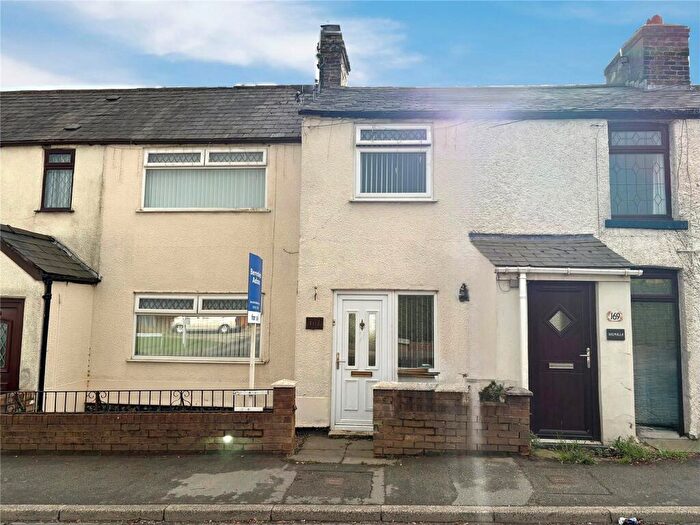
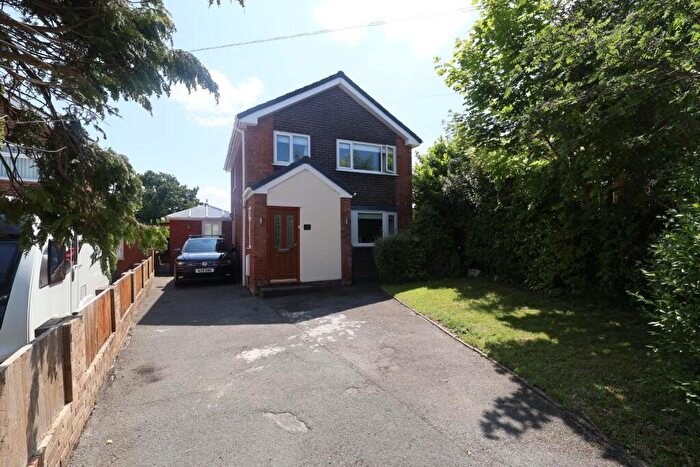
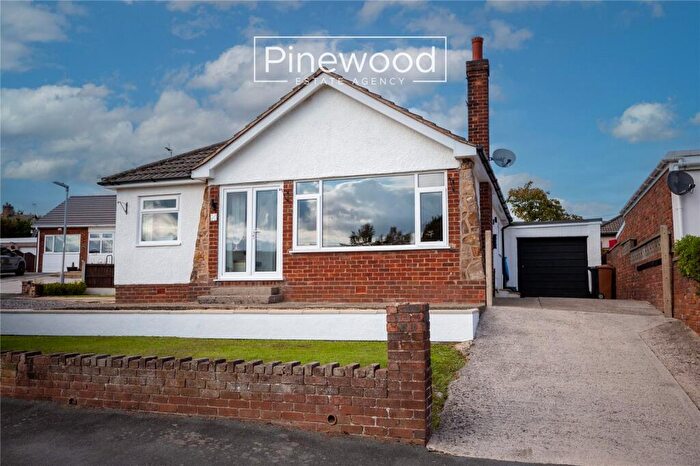
Houses for sale & to rent in Buckley Bistre West, Buckley
House Prices in Buckley Bistre West
Properties in Buckley Bistre West have an average house price of £181,088.00 and had 172 Property Transactions within the last 3 years¹.
Buckley Bistre West is an area in Buckley, Sir y Fflint - Flintshire with 1,959 households², where the most expensive property was sold for £435,000.00.
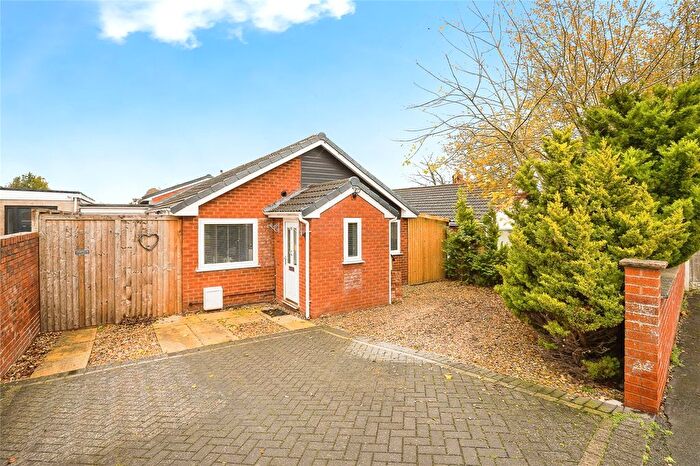
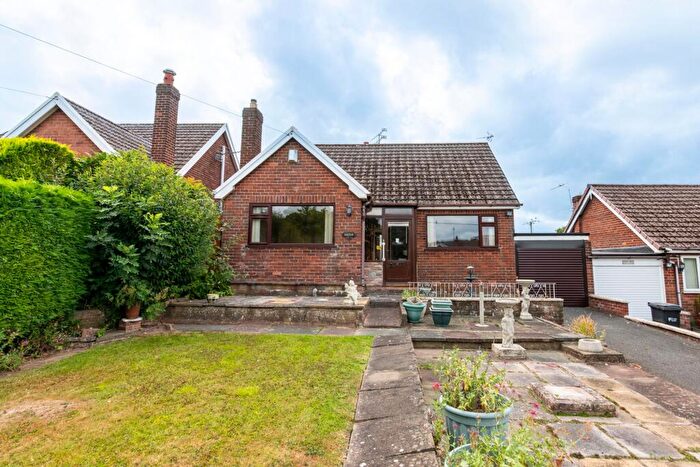
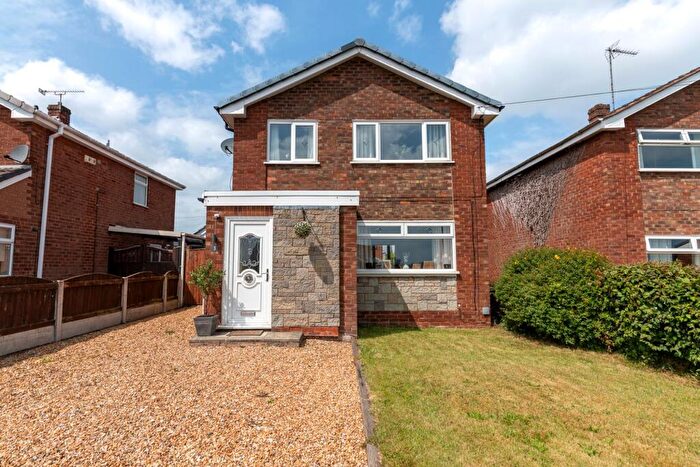
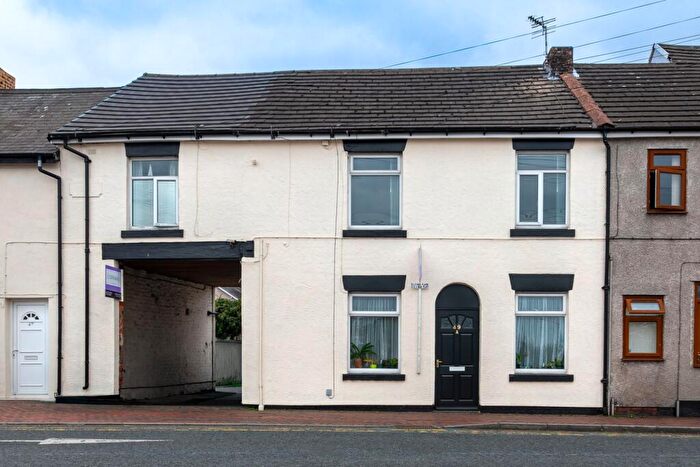
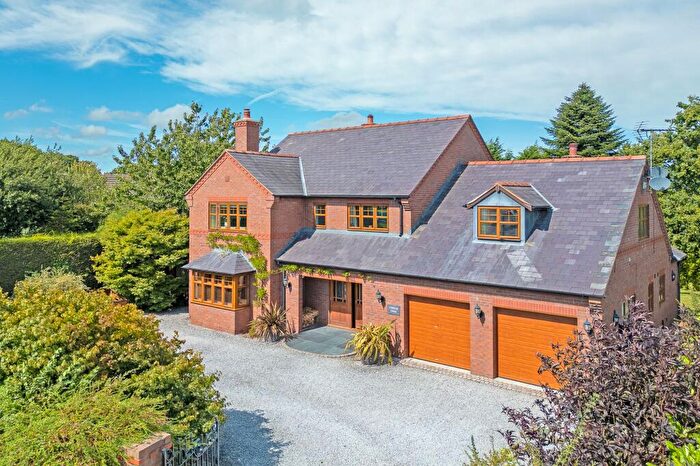
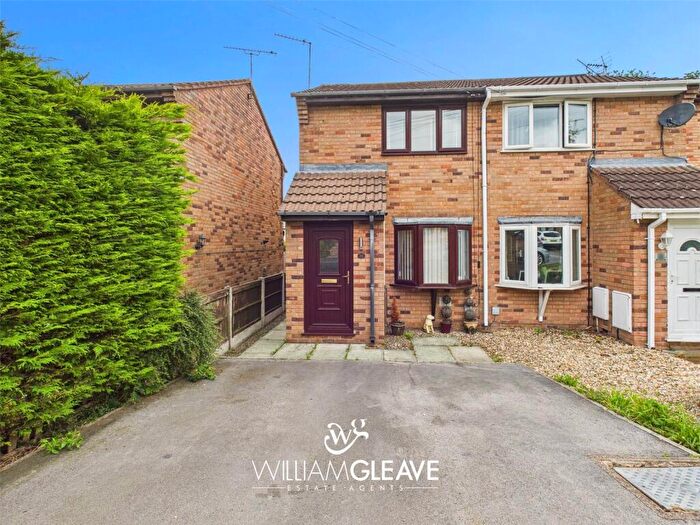
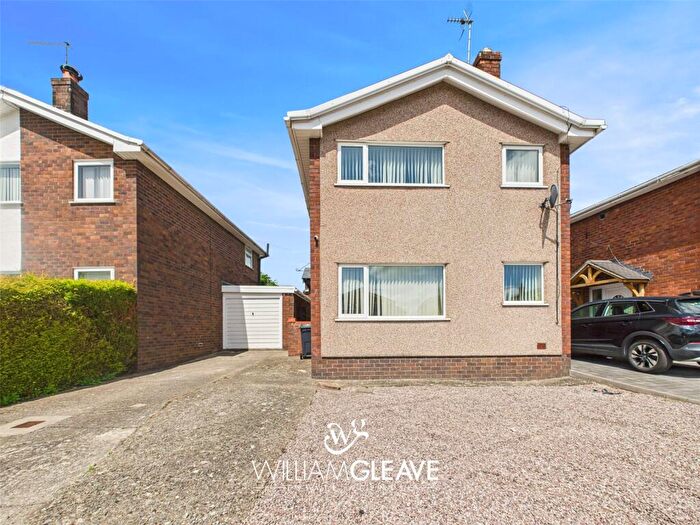
Properties for sale in Buckley Bistre West
Roads and Postcodes in Buckley Bistre West
Navigate through our locations to find the location of your next house in Buckley Bistre West, Buckley for sale or to rent.
| Streets | Postcodes |
|---|---|
| Alyn Road | CH7 2JX CH7 2JY CH7 2JZ |
| Becketts Lane | CH7 2BH |
| Bistre Avenue | CH7 2JE |
| Bod Offa Drive | CH7 2PB |
| Bryn Awelon | CH7 2QA CH7 2QB CH7 2QF CH7 2QG CH7 2RD |
| Bryn Mawr | CH7 2DY |
| Bryn Wood Drive | CH7 2BU |
| Clwyd Grove | CH7 2LG |
| Daleside | CH7 2PP CH7 2PW |
| Dawn Close | CH7 2SA |
| Eglwys Close | CH7 2QW |
| Elm Grove | CH7 2LU CH7 2LT |
| Farm Close | CH7 2DF |
| Farm Road | CH7 2NY |
| Fraser Drive | CH7 2LE CH7 2LF |
| Hancocks Lane | CH7 2DB |
| Hewitts Lane | CH7 2NQ |
| Hibberts Courtyard | CH7 2RA |
| Hillary Grove | CH7 2LL |
| Hillside Crescent | CH7 2BW CH7 2JS |
| Hillsview Road | CH7 2LX CH7 2LZ |
| Langford Crescent | CH7 2PR |
| Leeswood Road | CH7 2NA |
| Mayfield Drive | CH7 2PL CH7 2PN |
| Melbourne Road | CH7 2LH CH7 2LQ |
| Moel View Road | CH7 2BT |
| Mold Road | CH7 2JA CH7 2NG CH7 2NH CH7 2NU |
| Monza Close | CH7 2QH |
| Nant Glyn | CH7 2BX |
| Nant Mawr Court | CH7 2PG |
| Nant Mawr Crescent | CH7 2PY CH7 2PZ |
| Nant Mawr Road | CH7 2BJ CH7 2BR CH7 2BS CH7 2PU CH7 2PX CH7 2BL |
| Nant View Court | CH7 2DD |
| Orchard Close | CH7 2HY |
| Padeswood Road | CH7 2BN CH7 2JL CH7 2JN |
| Pant Y Fawnog Drive | CH7 2PD |
| Pen Y Maes | CH7 2QD CH7 2QE |
| Powell Road | CH7 2BY CH7 2BZ |
| Princess Avenue | CH7 2BP CH7 2LN CH7 2LP CH7 2LR CH7 2LS CH7 2LW CH7 2LY |
| Princess Court | CH7 2DG |
| Queens Drive | CH7 2LJ |
| Silverstone Drive | CH7 2QQ |
| Springfield Drive | CH7 2PH |
| Stanley Estate | CH7 2PT |
| Stanley Road | CH7 2PE CH7 2PF |
| Tabernacle Street | CH7 2JT CH7 2JU |
| Terrig Crescent | CH7 2LA |
| The Brackens | CH7 2RB |
| Watery Lane | CH7 2PS |
| Watts Court | CH7 2PJ |
| Well Street | CH7 2PQ |
| West Court | CH7 2RF |
| Westbourne Crescent | CH7 2LB CH7 2LD |
| CH7 2BE |
Transport near Buckley Bistre West
- FAQ
- Price Paid By Year
- Property Type Price
Frequently asked questions about Buckley Bistre West
What is the average price for a property for sale in Buckley Bistre West?
The average price for a property for sale in Buckley Bistre West is £181,088. This amount is 15% lower than the average price in Buckley. There are 607 property listings for sale in Buckley Bistre West.
What streets have the most expensive properties for sale in Buckley Bistre West?
The streets with the most expensive properties for sale in Buckley Bistre West are Dawn Close at an average of £275,000, Silverstone Drive at an average of £235,000 and Springfield Drive at an average of £230,562.
What streets have the most affordable properties for sale in Buckley Bistre West?
The streets with the most affordable properties for sale in Buckley Bistre West are Elm Grove at an average of £81,500, Nant View Court at an average of £95,000 and Queens Drive at an average of £128,333.
Which train stations are available in or near Buckley Bistre West?
Some of the train stations available in or near Buckley Bistre West are Buckley, Penyffordd and Hawarden.
Property Price Paid in Buckley Bistre West by Year
The average sold property price by year was:
| Year | Average Sold Price | Price Change |
Sold Properties
|
|---|---|---|---|
| 2025 | £173,558 | -8% |
34 Properties |
| 2024 | £187,021 | -2% |
45 Properties |
| 2023 | £190,067 | 9% |
41 Properties |
| 2022 | £173,797 | 3% |
52 Properties |
| 2021 | £168,793 | 11% |
62 Properties |
| 2020 | £150,755 | 6% |
48 Properties |
| 2019 | £141,267 | -7% |
72 Properties |
| 2018 | £150,923 | 5% |
50 Properties |
| 2017 | £143,726 | 8% |
64 Properties |
| 2016 | £132,683 | 9% |
69 Properties |
| 2015 | £120,894 | -4% |
47 Properties |
| 2014 | £125,176 | 2% |
69 Properties |
| 2013 | £122,255 | 0,5% |
52 Properties |
| 2012 | £121,674 | -2% |
36 Properties |
| 2011 | £123,930 | 6% |
30 Properties |
| 2010 | £116,373 | -3% |
34 Properties |
| 2009 | £119,658 | -9% |
29 Properties |
| 2008 | £130,454 | 1% |
36 Properties |
| 2007 | £128,535 | 4% |
51 Properties |
| 2006 | £123,516 | 6% |
75 Properties |
| 2005 | £116,413 | 0,1% |
63 Properties |
| 2004 | £116,275 | 21% |
102 Properties |
| 2003 | £91,932 | 20% |
95 Properties |
| 2002 | £73,086 | 21% |
96 Properties |
| 2001 | £57,952 | 12% |
90 Properties |
| 2000 | £50,861 | 11% |
79 Properties |
| 1999 | £45,327 | 2% |
45 Properties |
| 1998 | £44,333 | -2% |
38 Properties |
| 1997 | £45,109 | 3% |
80 Properties |
| 1996 | £43,628 | 7% |
70 Properties |
| 1995 | £40,360 | - |
59 Properties |
Property Price per Property Type in Buckley Bistre West
Here you can find historic sold price data in order to help with your property search.
The average Property Paid Price for specific property types in the last three years are:
| Property Type | Average Sold Price | Sold Properties |
|---|---|---|
| Semi Detached House | £176,033.00 | 101 Semi Detached Houses |
| Detached House | £238,164.00 | 32 Detached Houses |
| Terraced House | £154,050.00 | 31 Terraced Houses |
| Flat | £121,375.00 | 8 Flats |

