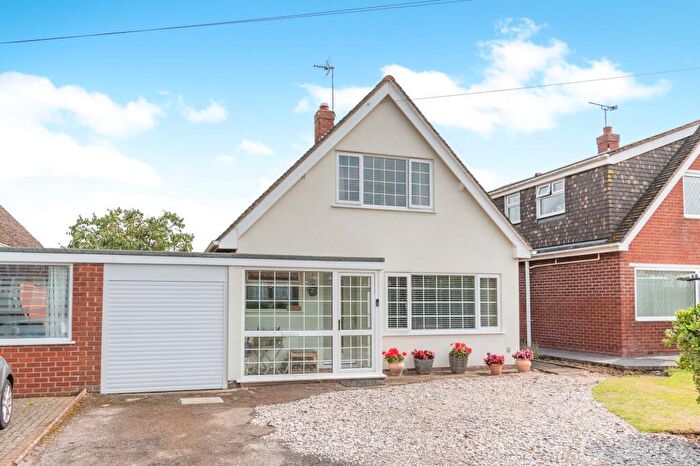
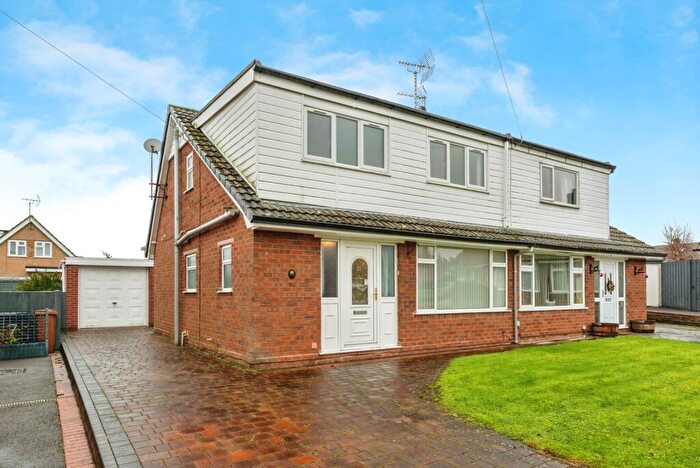
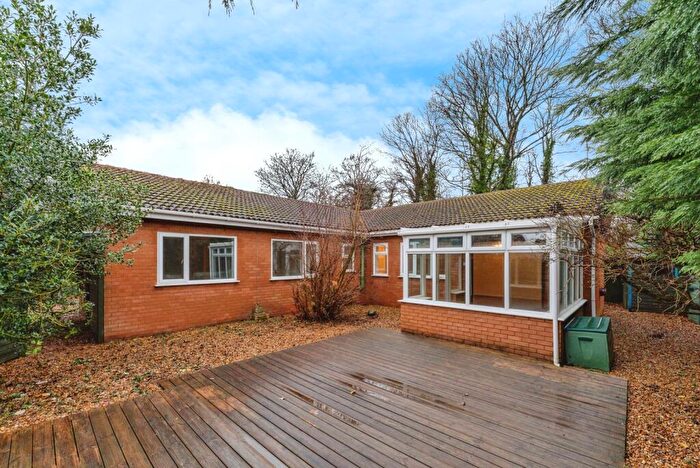
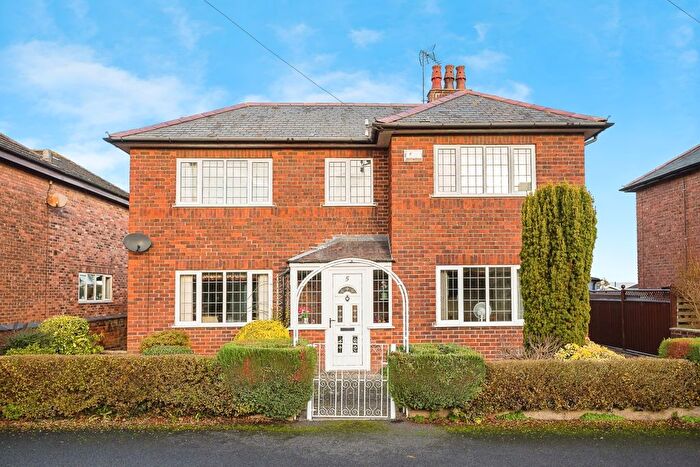
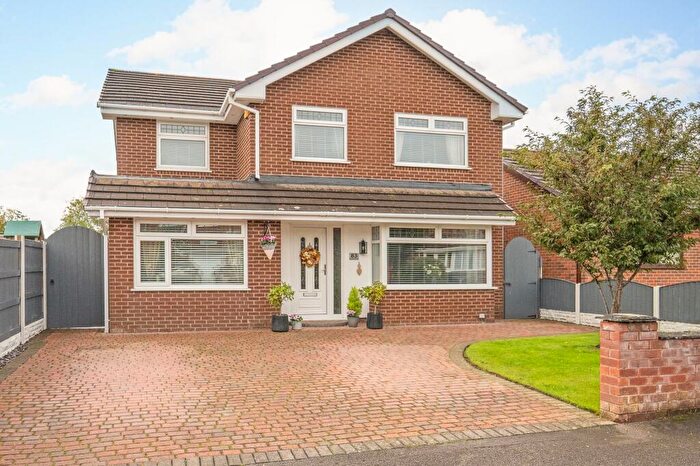
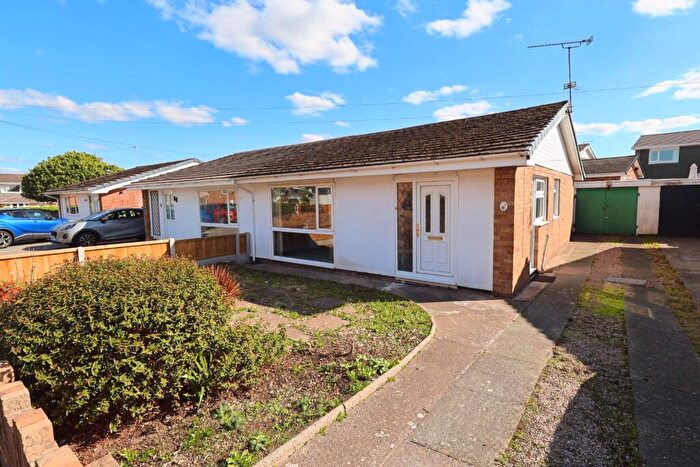
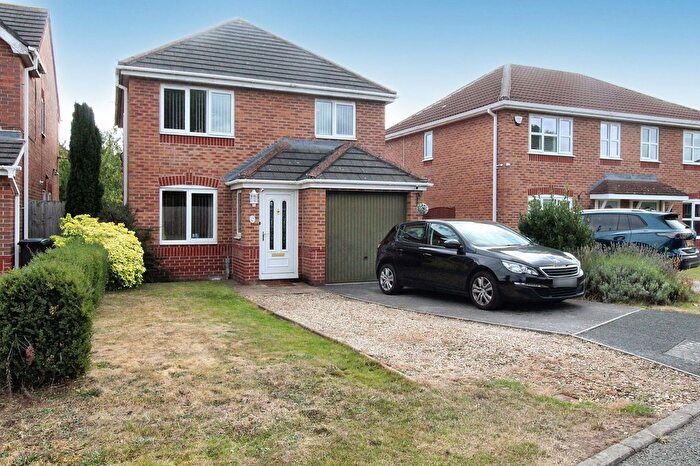
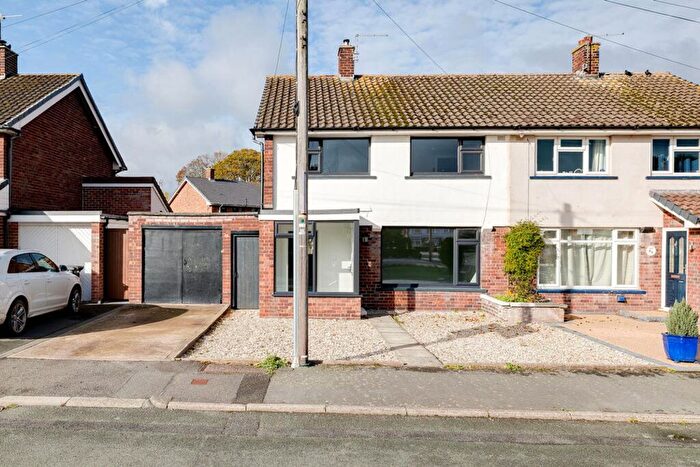
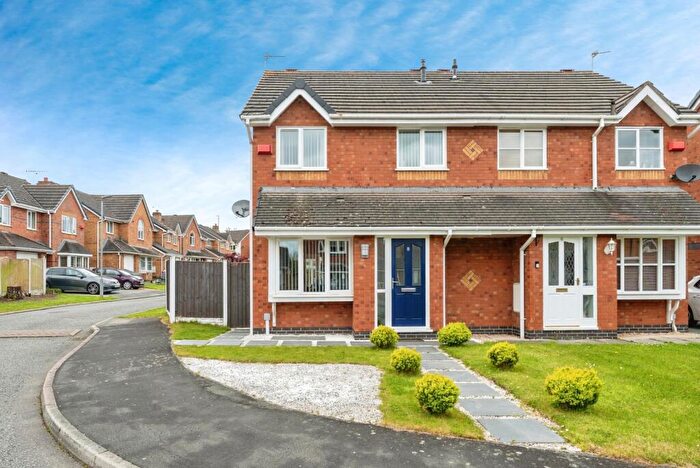
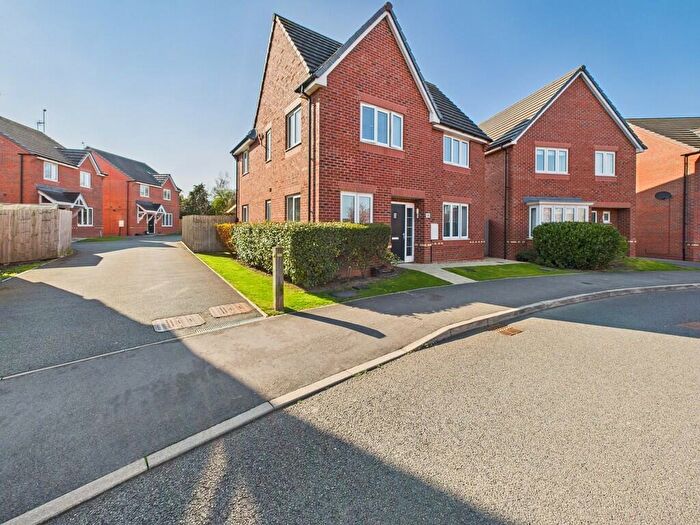
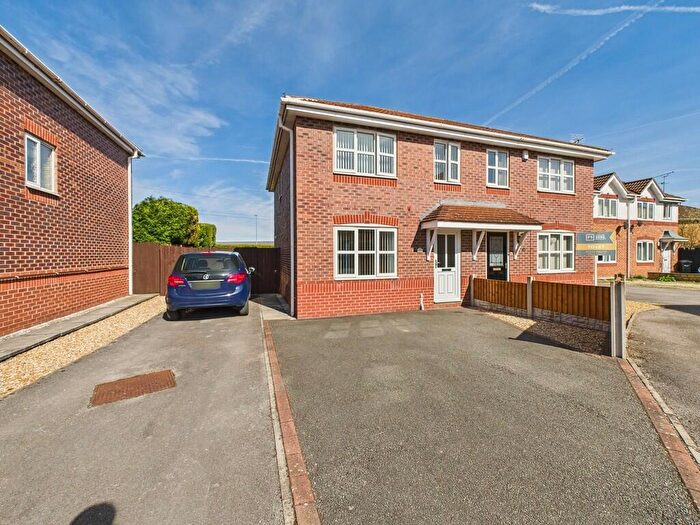
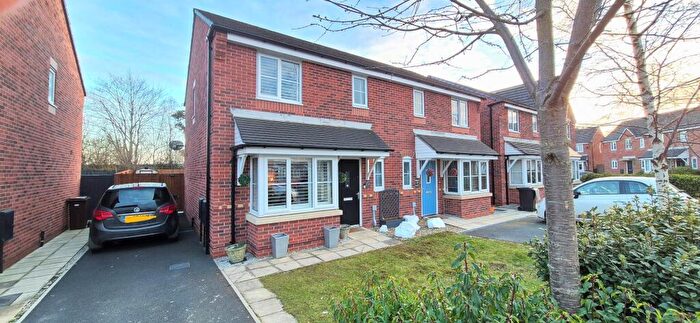
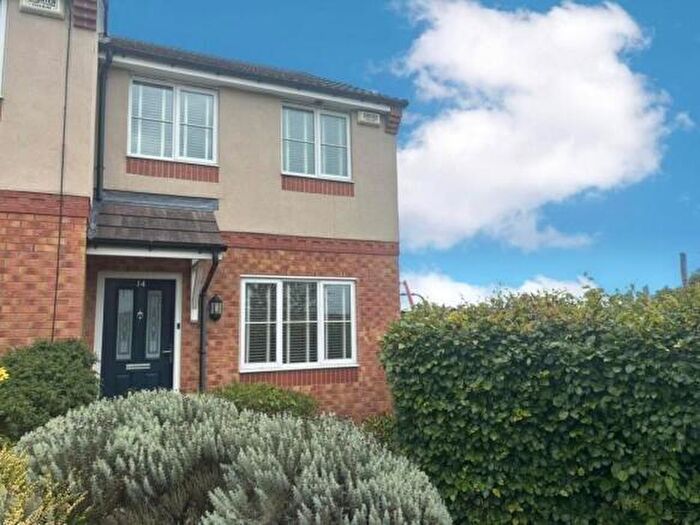
Houses for sale & to rent in Broughton South, Chester
House Prices in Broughton South
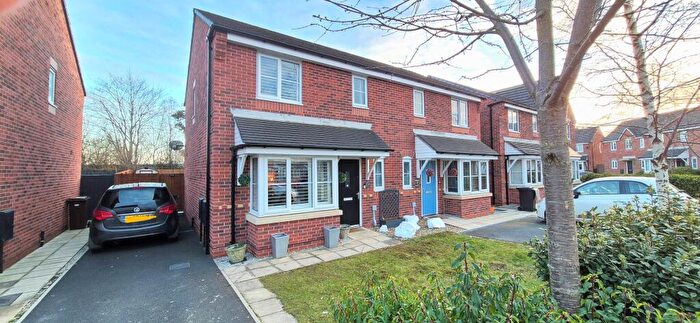
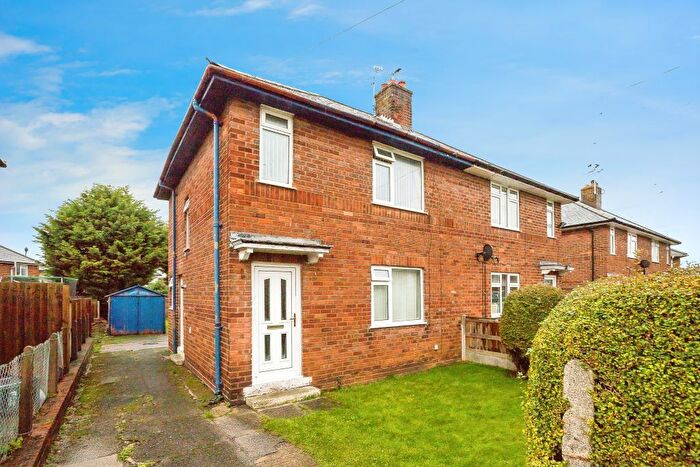
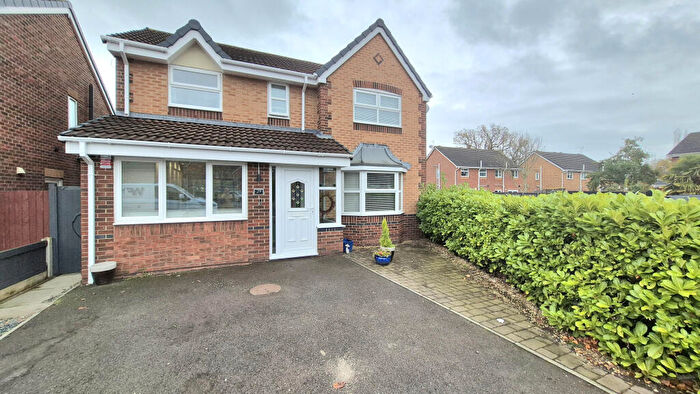
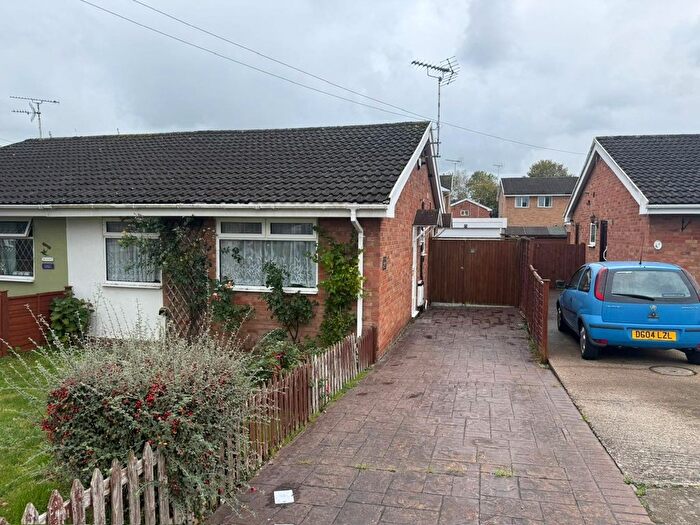
Properties in Broughton South have an average house price of £235,110.00 and had 238 Property Transactions within the last 3 years¹.
Broughton South is an area in Chester, Sir y Fflint - Flintshire with 1,590 households², where the most expensive property was sold for £2,035,000.00.
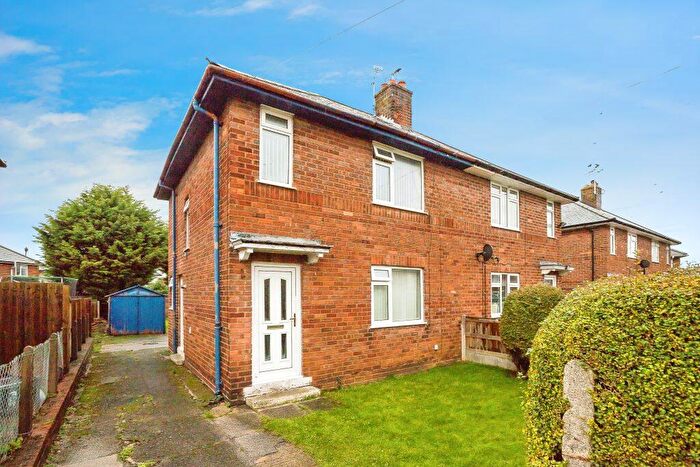
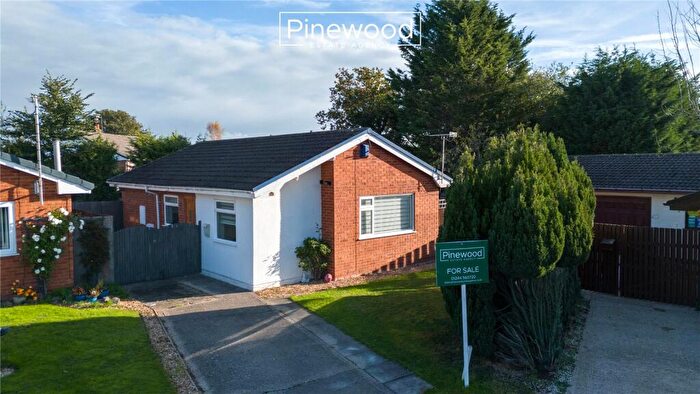
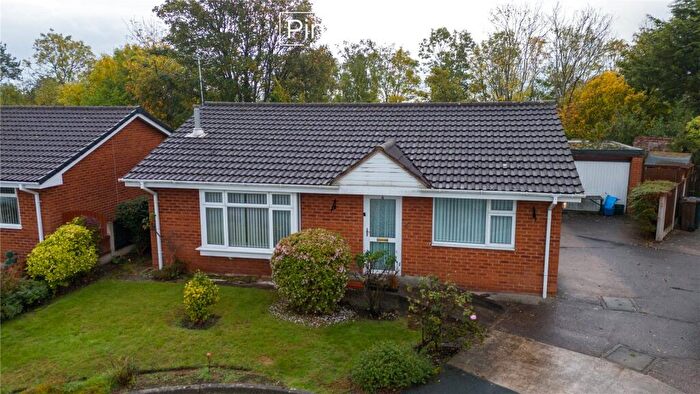
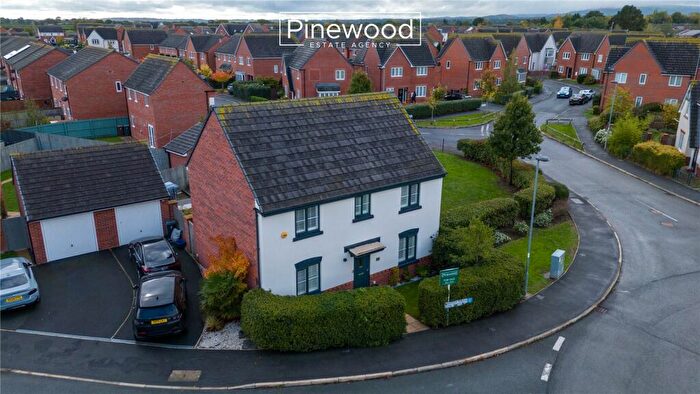
Properties for sale in Broughton South
Previously listed properties in Broughton South
Roads and Postcodes in Broughton South
Navigate through our locations to find the location of your next house in Broughton South, Chester for sale or to rent.
| Streets | Postcodes |
|---|---|
| Arnolds Crescent | CH4 0PX |
| Beeby Way | CH4 0TP |
| Beeston Road | CH4 0SB |
| Blackthorn Close | CH4 0PY |
| Bracken Close | CH4 0SL |
| Bretton Drive | CH4 0RS |
| Broad Oak Avenue | CH4 0PP |
| Brookes Avenue | CH4 0RD |
| Broughton Hall Road | CH4 0QN CH4 0QW CH4 0QS |
| Castlemere Close | CH4 0FH |
| Centenary Close | CH4 0FY |
| Cherry Dale Road | CH4 0FA CH4 0FG |
| Colinwood Avenue | CH4 0RB |
| Congleton Road | CH4 0SX |
| Copeswood Close | CH4 0PR |
| Copper Beech Close | CH4 0QY |
| Denford Close | CH4 0SP |
| Devonshire Road | CH4 0SH |
| Evans Court | CH4 0FS |
| Farndon Close | CH4 0SU |
| Firbeck Close | CH4 0TG |
| Forest Drive | CH4 0QJ CH4 0QT |
| Gala Close | CH4 0TE |
| Harbridge Road | CH4 0FT |
| Hawker Close | CH4 0SQ |
| Honeysuckle Close | CH4 0QA |
| Hope Road | CH4 0RT CH4 0RU |
| Lancaster Park | CH4 0PL |
| Lesters Lane | CH4 0HG |
| Long Road | CH4 0FQ |
| Madeley Close | CH4 0ST |
| Main Road | CH4 0NT |
| Marlwood Place | CH4 0PB |
| Marton Road | CH4 0TB |
| Memorial Close | CH4 0FW |
| Messham Close | CH4 0TN |
| Mold Road | CH4 0EH CH4 0EW CH4 0PQ |
| Oakdale Close | CH4 0PA |
| Old Warren | CH4 0EG CH4 0ED CH4 0EE CH4 0EF |
| Parkfield Road | CH4 0SA CH4 0SE CH4 0SF |
| Penny Bank Close | CH4 0FD |
| Pinetree Close | CH4 0QU |
| Robins Court | CH4 0TQ |
| Rosemary Close | CH4 0SJ |
| Sandwood Avenue | CH4 0RJ |
| Siddeley Close | CH4 0SG |
| Silver Birch Croft | CH4 0TF |
| Simpsons Way | CH4 0RA |
| Somerford Road | CH4 0SY CH4 0SZ |
| Summerfield Close | CH4 0FF |
| Sycamore Grove | CH4 0PZ |
| The Birches | CH4 0PS |
| The Boulevard | CH4 0SN CH4 0SW |
| The Rookery | CH4 0RX |
| The Rowans | CH4 0TD |
| Thornhill Close | CH4 0FB |
| Vale Close | CH4 0TA |
| Warren Drive | CH4 0PT CH4 0PU |
| Warren Hall Court | CH4 0SD |
| Watsons Close | CH4 0SS |
| Webster Close | CH4 0SR |
| Westminster Road | CH4 0RY CH4 0RZ |
| Whitley Drive | CH4 0TL |
| Willow Way | CH4 0RH |
| Windsor Drive | CH4 0PN CH4 0PW |
| Woodfield Close | CH4 0FE |
| Yarrow Close | CH4 0QL |
| Yew Tree Close | CH4 0QX |
| CH4 0NU |
Transport near Broughton South
- FAQ
- Price Paid By Year
- Property Type Price
Frequently asked questions about Broughton South
What is the average price for a property for sale in Broughton South?
The average price for a property for sale in Broughton South is £235,110. This amount is 7% lower than the average price in Chester. There are 246 property listings for sale in Broughton South.
What streets have the most expensive properties for sale in Broughton South?
The streets with the most expensive properties for sale in Broughton South are Old Warren at an average of £446,010, Mold Road at an average of £443,285 and Penny Bank Close at an average of £325,000.
What streets have the most affordable properties for sale in Broughton South?
The streets with the most affordable properties for sale in Broughton South are Copper Beech Close at an average of £132,900, Lancaster Park at an average of £148,062 and Windsor Drive at an average of £157,800.
Which train stations are available in or near Broughton South?
Some of the train stations available in or near Broughton South are Hawarden, Buckley and Penyffordd.
Property Price Paid in Broughton South by Year
The average sold property price by year was:
| Year | Average Sold Price | Price Change |
Sold Properties
|
|---|---|---|---|
| 2025 | £238,423 | -4% |
39 Properties |
| 2024 | £247,419 | 8% |
68 Properties |
| 2023 | £226,485 | -1% |
53 Properties |
| 2022 | £228,585 | 11% |
78 Properties |
| 2021 | £202,781 | 2% |
101 Properties |
| 2020 | £198,566 | 8% |
48 Properties |
| 2019 | £183,560 | 7% |
82 Properties |
| 2018 | £171,003 | -9% |
84 Properties |
| 2017 | £185,737 | -1% |
105 Properties |
| 2016 | £188,517 | -3% |
175 Properties |
| 2015 | £193,936 | 13% |
161 Properties |
| 2014 | £168,957 | 13% |
108 Properties |
| 2013 | £146,920 | -7% |
50 Properties |
| 2012 | £157,351 | 9% |
34 Properties |
| 2011 | £143,704 | 1% |
45 Properties |
| 2010 | £141,900 | -3% |
41 Properties |
| 2009 | £145,702 | -5% |
39 Properties |
| 2008 | £153,151 | -6% |
34 Properties |
| 2007 | £162,336 | -2% |
73 Properties |
| 2006 | £166,325 | 12% |
74 Properties |
| 2005 | £146,540 | 12% |
60 Properties |
| 2004 | £128,597 | 11% |
83 Properties |
| 2003 | £115,078 | 24% |
82 Properties |
| 2002 | £87,106 | -0,2% |
110 Properties |
| 2001 | £87,287 | 14% |
108 Properties |
| 2000 | £74,776 | 17% |
95 Properties |
| 1999 | £62,277 | -5% |
59 Properties |
| 1998 | £65,640 | 4% |
99 Properties |
| 1997 | £62,859 | 16% |
150 Properties |
| 1996 | £53,057 | 12% |
87 Properties |
| 1995 | £46,715 | - |
56 Properties |
Property Price per Property Type in Broughton South
Here you can find historic sold price data in order to help with your property search.
The average Property Paid Price for specific property types in the last three years are:
| Property Type | Average Sold Price | Sold Properties |
|---|---|---|
| Semi Detached House | £199,478.00 | 129 Semi Detached Houses |
| Detached House | £336,704.00 | 65 Detached Houses |
| Terraced House | £206,833.00 | 33 Terraced Houses |
| Flat | £137,490.00 | 11 Flats |

