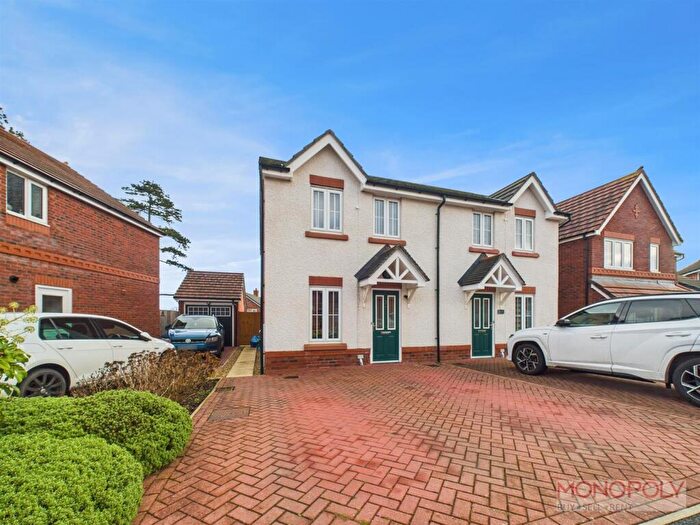
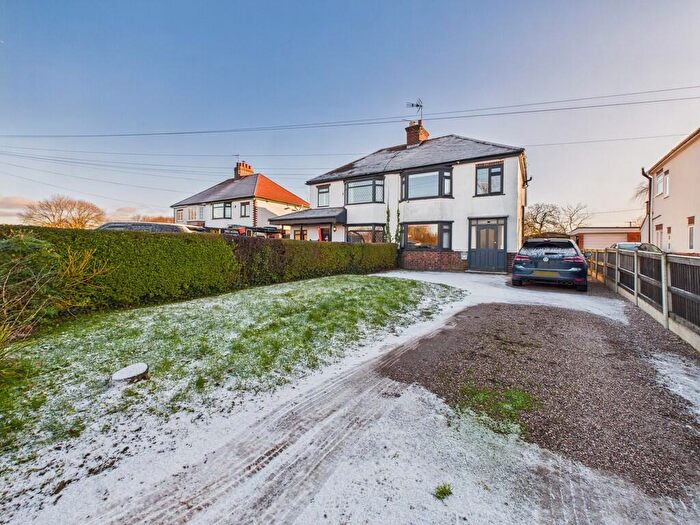
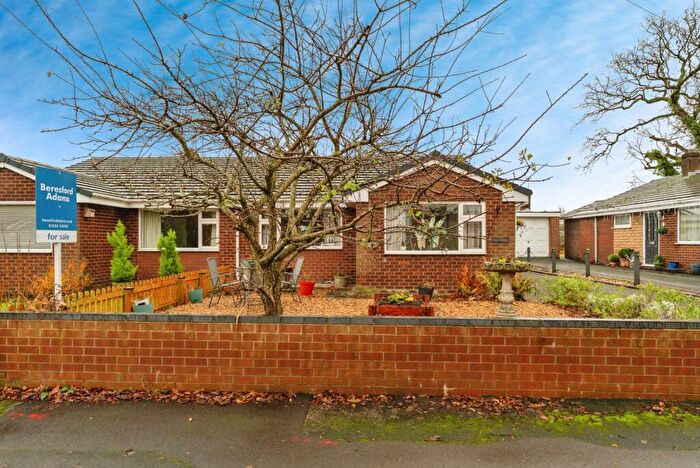
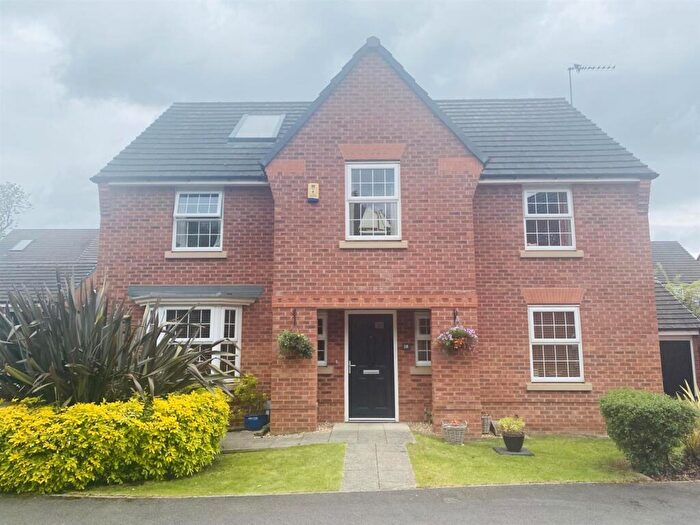
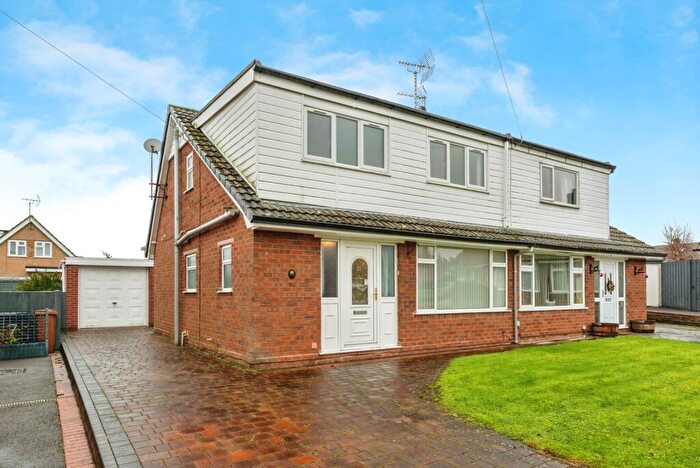
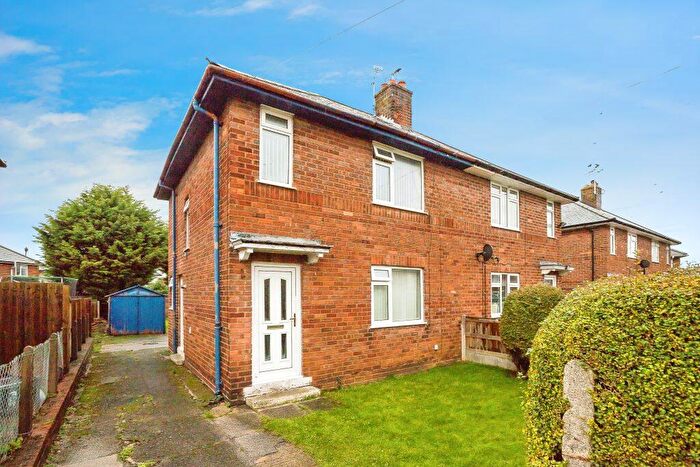
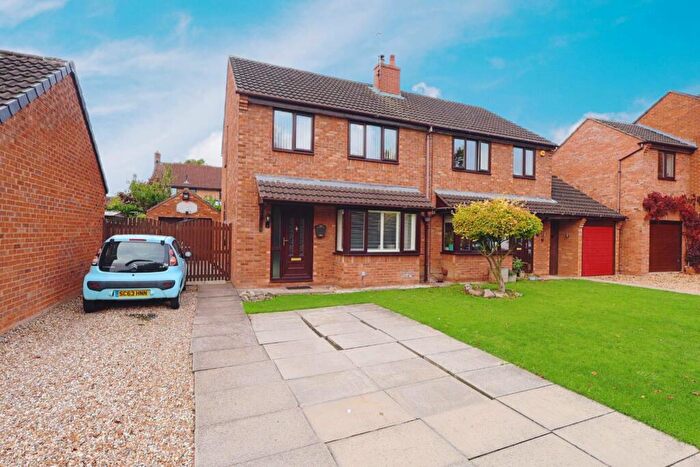
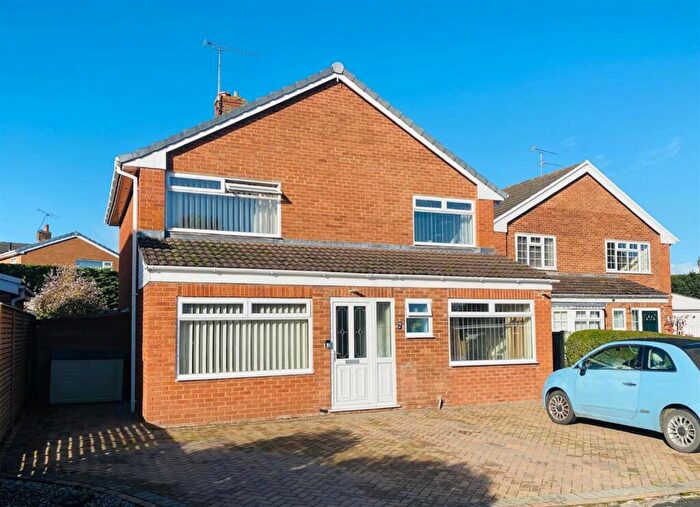
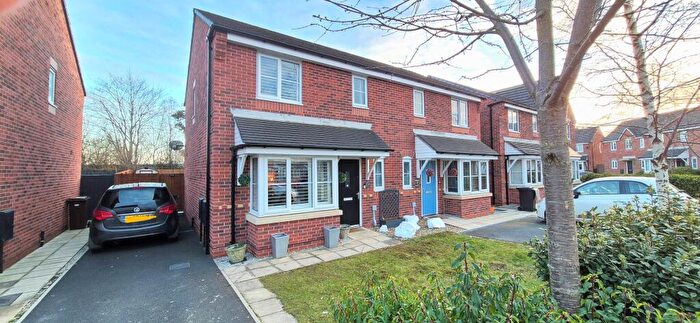
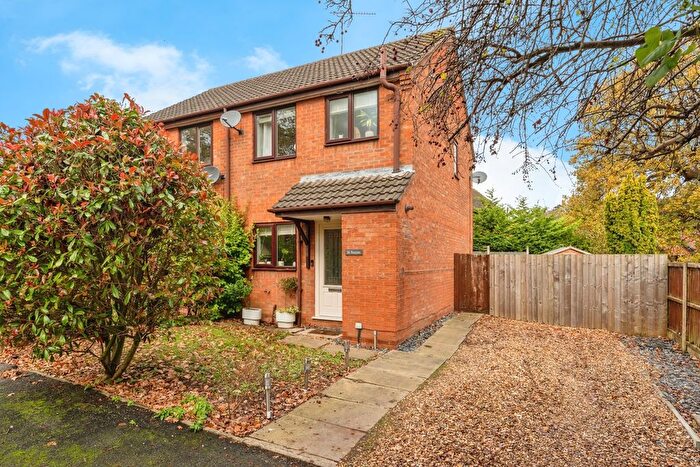
Houses for sale & to rent in Higher Kinnerton, Chester
House Prices in Higher Kinnerton
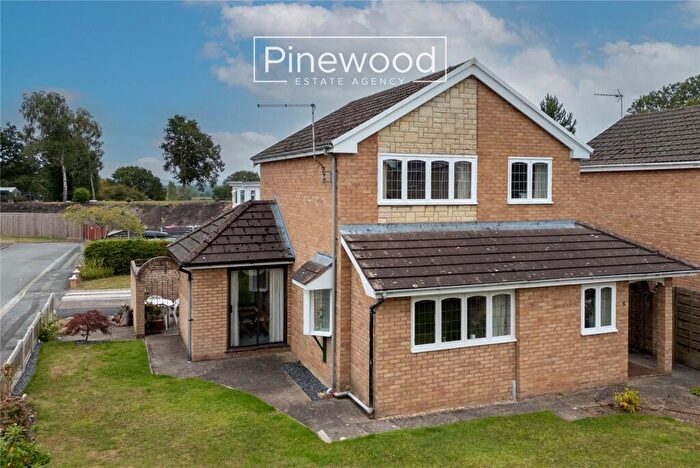
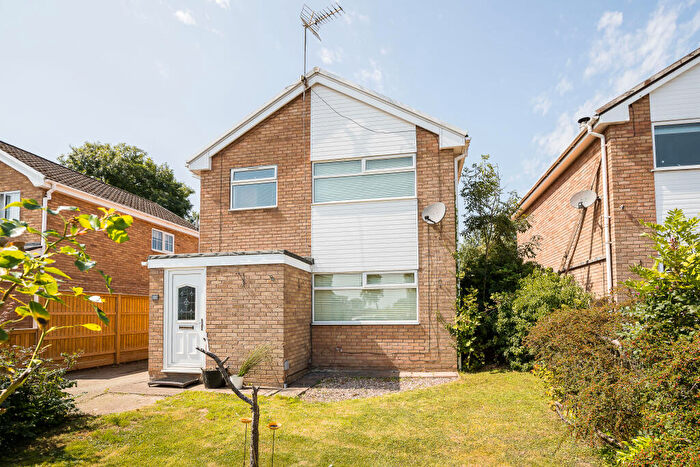
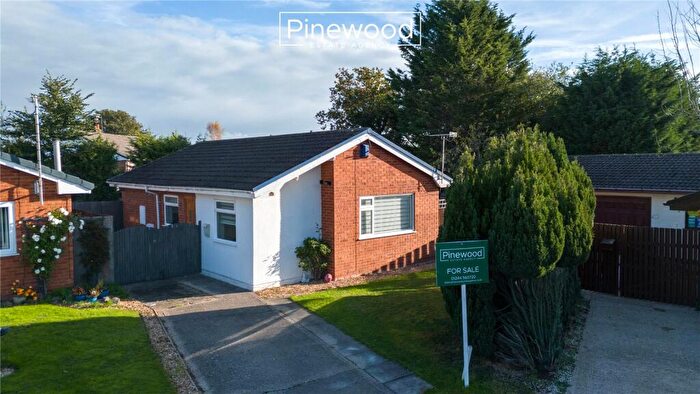
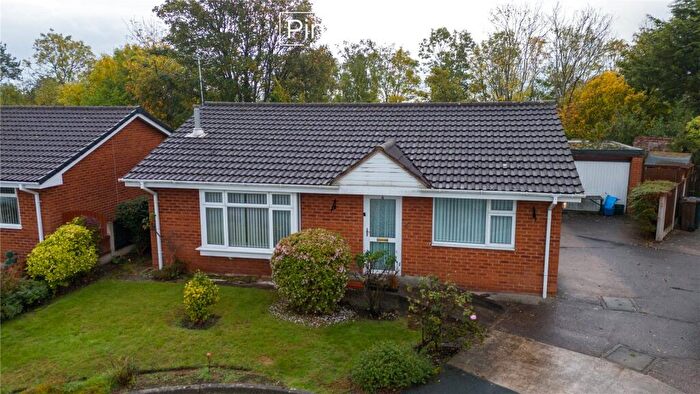
Properties in Higher Kinnerton have an average house price of £340,054.00 and had 85 Property Transactions within the last 3 years¹.
Higher Kinnerton is an area in Chester, Sir y Fflint - Flintshire with 667 households², where the most expensive property was sold for £1,200,000.00.
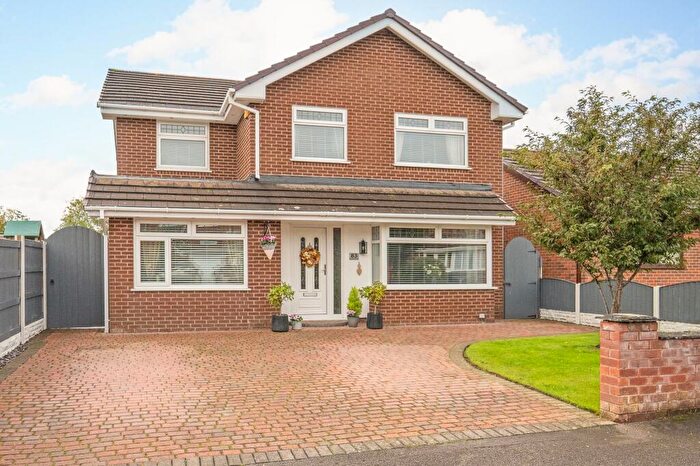
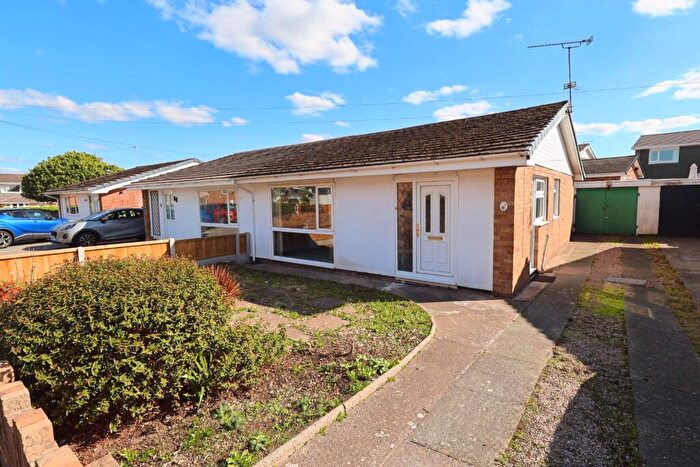
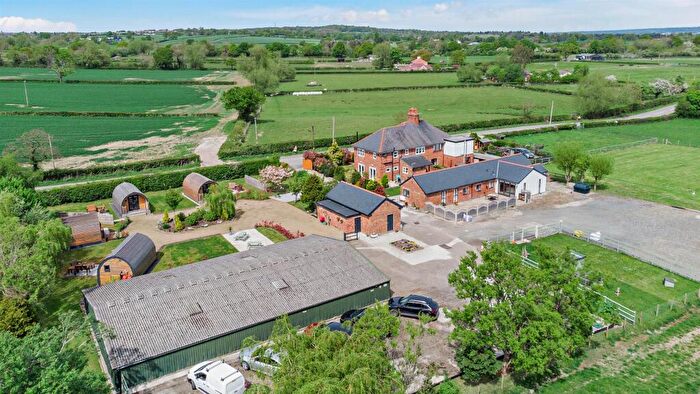
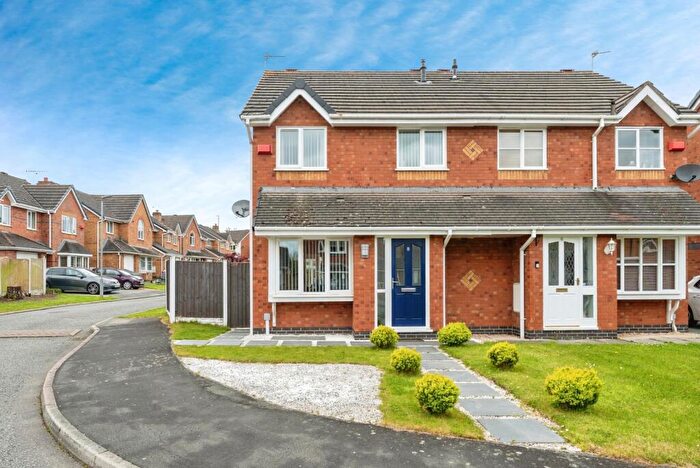
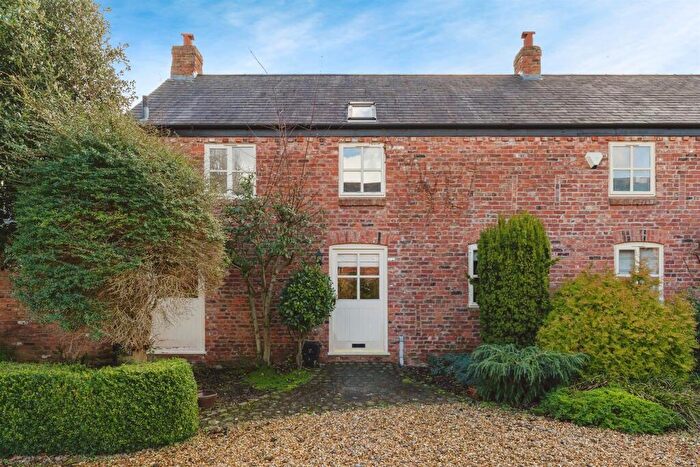
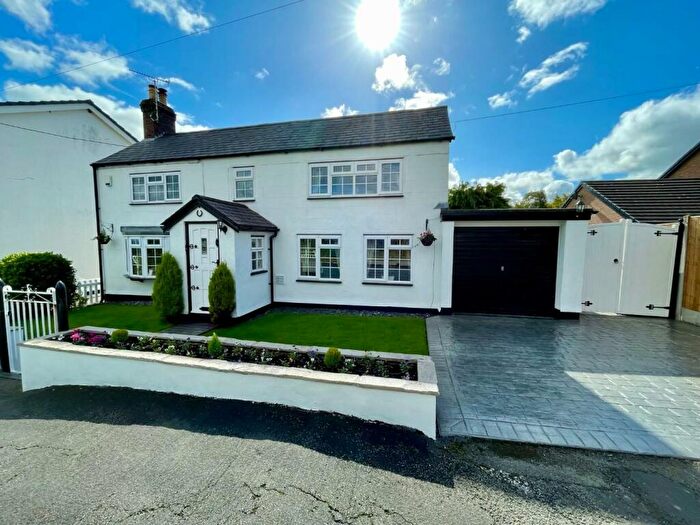
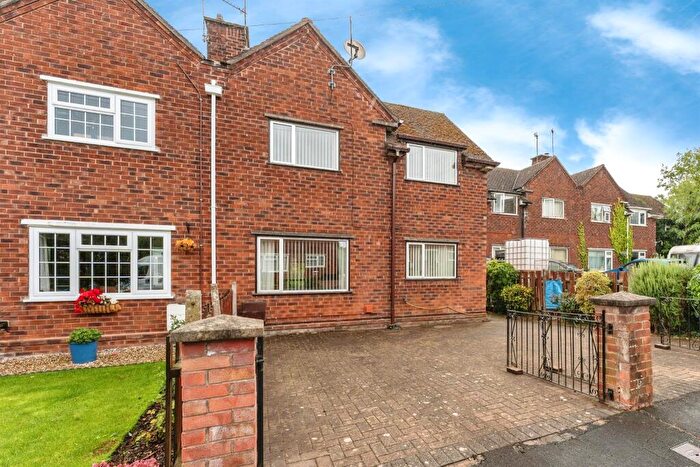
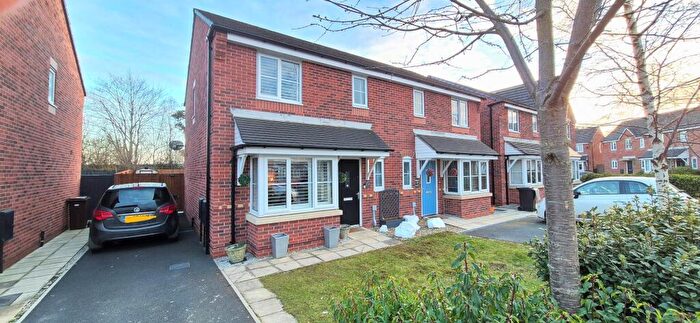
Properties for sale in Higher Kinnerton
Previously listed properties in Higher Kinnerton
Roads and Postcodes in Higher Kinnerton
Navigate through our locations to find the location of your next house in Higher Kinnerton, Chester for sale or to rent.
| Streets | Postcodes |
|---|---|
| Barrack Lane | CH4 9BB |
| Beeston Road | CH4 9EA |
| Bennetts Lane | CH4 9AR |
| Blantern Road | CH4 9DA |
| Bramley Lane | CH4 9AX |
| Burton Drive | CH4 9AB |
| Cae Babilon | CH4 9GD |
| Cannon Way | CH4 9PG |
| Crompton Close | CH4 9AT |
| Davies Court | CH4 9GW |
| Deansway | CH4 9DZ |
| Eccleston Road | CH4 9DY |
| Faulkners Close | CH4 9BH |
| Foxes Walk | CH4 9PB |
| Greenfield Avenue | CH4 9BX |
| Harley Drive | CH4 9GG |
| Hartley Close | CH4 9PF |
| Hill Road | CH4 9FX |
| Hunters Croft | CH4 9PD |
| Ithell Close | CH4 9GF |
| Jones Way | CH4 9FW |
| Kinnerton Heights | CH4 9EH |
| Kinnerton Lane | CH4 9BE CH4 9BG |
| Kinnerton Road | CH4 9AN |
| Kirkett Avenue | CH4 9BN |
| Lesters Lane | CH4 9BQ |
| Llys Derwen | CH4 9AA |
| Lower Mountain Road | CH4 0EX |
| Main Road | CH4 9AJ CH4 9AL CH4 9AP |
| Meadowcroft | CH4 9AY |
| Middle Lane | CH4 9AU |
| Moor Lane | CH4 9AQ CH4 9AH |
| Myrtle Avenue | CH4 9DX |
| Oak Drive | CH4 9BT |
| Paddock Way | CH4 9BA |
| Park Avenue | CH4 9AS |
| Sandy Lane | CH4 9BS CH4 9BJ CH4 9BL |
| Springfield Close | CH4 9BU |
| Springfield Court | CH4 9BY |
| Stringers Lane | CH4 9BR |
| The Brackens | CH4 9BF |
| The Chase | CH4 9PA |
| The Dale | CH4 9AW |
| The Green | CH4 9BZ CH4 9DB |
| Willow Court | CH4 9AZ |
Transport near Higher Kinnerton
- FAQ
- Price Paid By Year
- Property Type Price
Frequently asked questions about Higher Kinnerton
What is the average price for a property for sale in Higher Kinnerton?
The average price for a property for sale in Higher Kinnerton is £340,054. This amount is 35% higher than the average price in Chester. There are 264 property listings for sale in Higher Kinnerton.
What streets have the most expensive properties for sale in Higher Kinnerton?
The streets with the most expensive properties for sale in Higher Kinnerton are Sandy Lane at an average of £514,850, Harley Drive at an average of £447,200 and Hartley Close at an average of £418,750.
What streets have the most affordable properties for sale in Higher Kinnerton?
The streets with the most affordable properties for sale in Higher Kinnerton are Crompton Close at an average of £190,000, Greenfield Avenue at an average of £241,350 and Park Avenue at an average of £246,833.
Which train stations are available in or near Higher Kinnerton?
Some of the train stations available in or near Higher Kinnerton are Penyffordd, Hope (Clwyd) and Buckley.
Property Price Paid in Higher Kinnerton by Year
The average sold property price by year was:
| Year | Average Sold Price | Price Change |
Sold Properties
|
|---|---|---|---|
| 2025 | £326,744 | 4% |
9 Properties |
| 2024 | £312,950 | -5% |
20 Properties |
| 2023 | £328,235 | -12% |
23 Properties |
| 2022 | £368,348 | 19% |
33 Properties |
| 2021 | £299,255 | -10% |
33 Properties |
| 2020 | £329,490 | 18% |
45 Properties |
| 2019 | £269,464 | -8% |
59 Properties |
| 2018 | £291,928 | -0,1% |
33 Properties |
| 2017 | £292,230 | 4% |
28 Properties |
| 2016 | £280,487 | 15% |
20 Properties |
| 2015 | £238,219 | -8% |
41 Properties |
| 2014 | £258,178 | -32% |
31 Properties |
| 2013 | £340,488 | 22% |
19 Properties |
| 2012 | £264,147 | 21% |
17 Properties |
| 2011 | £209,571 | -21% |
7 Properties |
| 2010 | £253,133 | 15% |
15 Properties |
| 2009 | £213,905 | 14% |
16 Properties |
| 2008 | £182,996 | -39% |
13 Properties |
| 2007 | £255,112 | -14% |
32 Properties |
| 2006 | £289,643 | 17% |
24 Properties |
| 2005 | £240,201 | 3% |
26 Properties |
| 2004 | £233,266 | 18% |
28 Properties |
| 2003 | £191,496 | 20% |
28 Properties |
| 2002 | £152,621 | 13% |
57 Properties |
| 2001 | £132,044 | 24% |
31 Properties |
| 2000 | £99,877 | 17% |
46 Properties |
| 1999 | £82,794 | -6% |
27 Properties |
| 1998 | £88,051 | 4% |
29 Properties |
| 1997 | £84,254 | 12% |
33 Properties |
| 1996 | £74,151 | 7% |
29 Properties |
| 1995 | £68,618 | - |
27 Properties |
Property Price per Property Type in Higher Kinnerton
Here you can find historic sold price data in order to help with your property search.
The average Property Paid Price for specific property types in the last three years are:
| Property Type | Average Sold Price | Sold Properties |
|---|---|---|
| Semi Detached House | £267,558.00 | 26 Semi Detached Houses |
| Detached House | £385,724.00 | 54 Detached Houses |
| Terraced House | £223,800.00 | 5 Terraced Houses |

