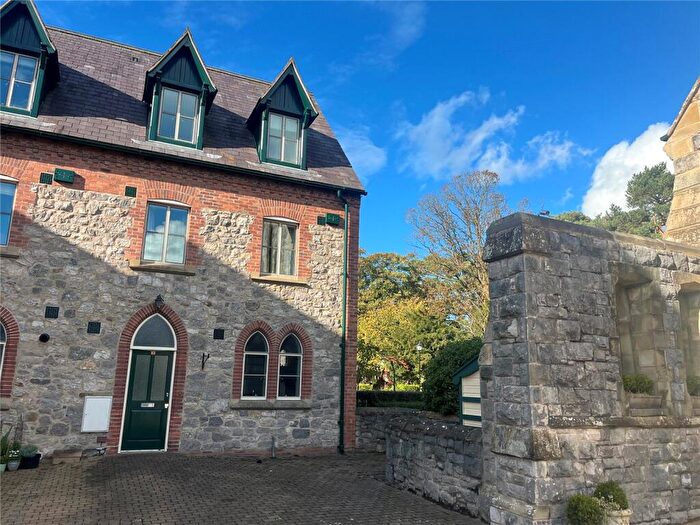
Houses for sale & to rent in Caerwys, Mold
House Prices in Caerwys
Properties in Caerwys have an average house price of £253,169.00 and had 73 Property Transactions within the last 3 years¹.
Caerwys is an area in Mold, Sir y Fflint - Flintshire with 634 households², where the most expensive property was sold for £680,000.00.
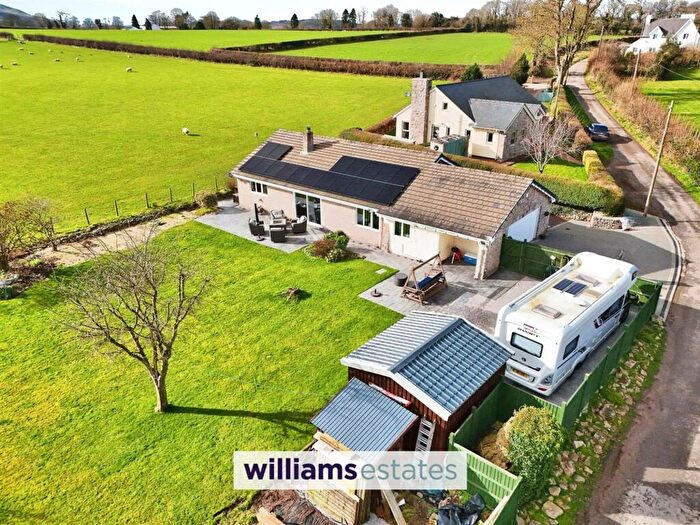
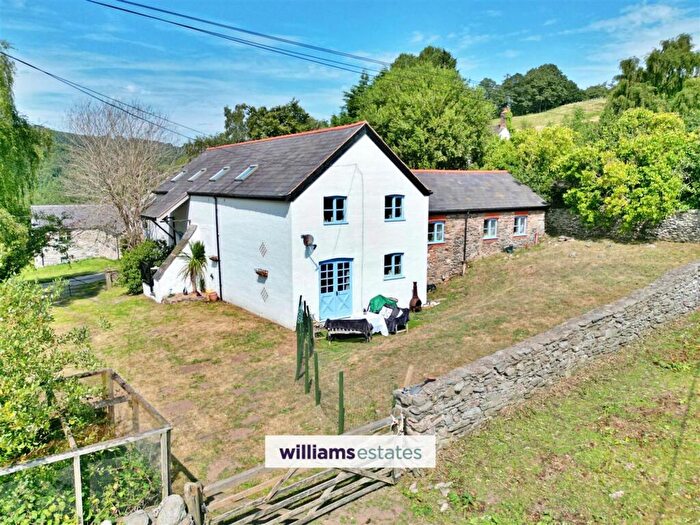
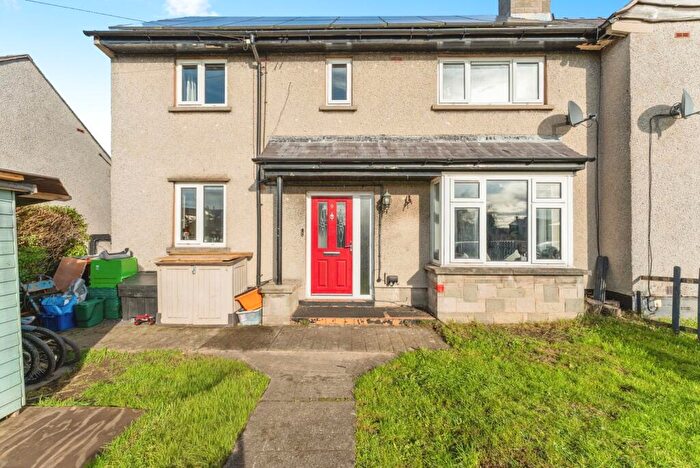
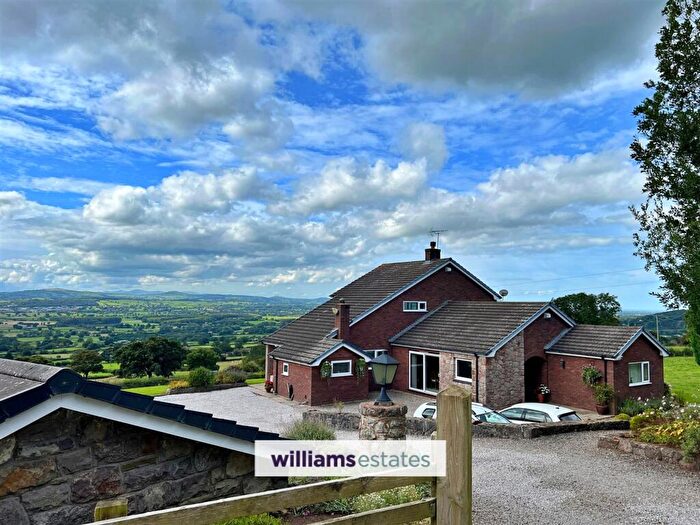
Properties for sale in Caerwys
Roads and Postcodes in Caerwys
Navigate through our locations to find the location of your next house in Caerwys, Mold for sale or to rent.
| Streets | Postcodes |
|---|---|
| Bryn Aur | CH7 5BR |
| Bryn Eithin Road | CH7 5UU CH7 5UX |
| Bryn Hyfryd | CH7 5AX |
| Bryn Llwyd | CH7 5FE |
| Cae Delyn | CH7 5BY |
| Caerwys Hill | CH7 5AD |
| Chapel Street | CH7 5AE |
| Coed Farm Lane | CH7 5AQ |
| Crossways Road | CH7 5BP |
| Cwrt Melyd | CH7 5FB |
| Denbigh Road | CH7 5AB CH7 5RH CH7 5UB |
| Erw Las | CH7 5PW |
| Fairview Close | CH7 5AG |
| Felingonglog Road | CH7 5UW |
| Ffordd Angharad | CH7 5PY |
| Ffoulkes Terrace | CH7 5UQ |
| Glasdir Terrace | CH7 5AU |
| High Street | CH7 5BB CH7 5BD |
| Holywell Road | CH7 5AR |
| Jocelyn Terrace | CH7 5UH |
| Lixwm Road | CH7 5RQ |
| Llys Pendre | CH7 5BJ |
| Llys Y Goron | CH7 5BU |
| Llys Y Pentre | CH7 5UY |
| Lon Syr Herbert | CH7 5PX |
| Lon Y Porthmyn | CH7 5AP |
| Lon Yr Ysgol | CH7 5PZ |
| Maes Y Coed Cottages | CH7 5UG |
| Maes Y Dre | CH7 5AS |
| Mill Terrace | CH7 5UF |
| North Street | CH7 5AW CH7 5AN |
| Parc Hafod | CH7 5XA |
| Park Grove | CH7 5BX |
| Park View | CH7 5UE |
| Pen Y Cefn | CH7 5BN CH7 5BQ CH7 5BW |
| Pen Y Cefn Road | CH7 5BE CH7 5BG CH7 5BH CH7 5BA |
| Railway Terrace | CH7 5UD |
| South Street | CH7 5AF CH7 5AH CH7 5AL CH7 5AJ |
| Sportsman Terrace | CH7 5UJ |
| St Michaels Close | CH7 5BT |
| St Michaels Drive | CH7 5BS |
| Trefechan Road | CH7 5UR CH7 5UT CH7 5US |
| Ty Newydd Road | CH7 5UN |
| Water Street | CH7 5AT CH7 5AZ CH7 5AY |
| CH7 5UL CH7 5BZ |
Transport near Caerwys
- FAQ
- Price Paid By Year
- Property Type Price
Frequently asked questions about Caerwys
What is the average price for a property for sale in Caerwys?
The average price for a property for sale in Caerwys is £253,169. This amount is 2% higher than the average price in Mold. There are 325 property listings for sale in Caerwys.
What streets have the most expensive properties for sale in Caerwys?
The streets with the most expensive properties for sale in Caerwys are Felingonglog Road at an average of £680,000, Lixwm Road at an average of £480,000 and Erw Las at an average of £435,000.
What streets have the most affordable properties for sale in Caerwys?
The streets with the most affordable properties for sale in Caerwys are Sportsman Terrace at an average of £137,500, Railway Terrace at an average of £153,750 and Glasdir Terrace at an average of £160,000.
Which train stations are available in or near Caerwys?
Some of the train stations available in or near Caerwys are Flint, Prestatyn and Rhyl.
Property Price Paid in Caerwys by Year
The average sold property price by year was:
| Year | Average Sold Price | Price Change |
Sold Properties
|
|---|---|---|---|
| 2025 | £260,643 | 2% |
24 Properties |
| 2024 | £256,136 | 5% |
22 Properties |
| 2023 | £244,107 | 12% |
27 Properties |
| 2022 | £214,331 | -21% |
27 Properties |
| 2021 | £258,723 | -15% |
24 Properties |
| 2020 | £297,071 | 24% |
20 Properties |
| 2019 | £225,196 | 7% |
28 Properties |
| 2018 | £209,973 | 2% |
21 Properties |
| 2017 | £205,740 | 6% |
36 Properties |
| 2016 | £193,954 | 2% |
24 Properties |
| 2015 | £189,535 | 3% |
27 Properties |
| 2014 | £183,388 | 13% |
18 Properties |
| 2013 | £158,923 | -31% |
13 Properties |
| 2012 | £208,117 | 4% |
17 Properties |
| 2011 | £199,595 | 0,3% |
21 Properties |
| 2010 | £199,092 | -2% |
21 Properties |
| 2009 | £203,666 | 3% |
12 Properties |
| 2008 | £197,083 | 3% |
14 Properties |
| 2007 | £190,939 | 4% |
29 Properties |
| 2006 | £182,899 | 10% |
16 Properties |
| 2005 | £165,428 | 21% |
21 Properties |
| 2004 | £131,058 | 6% |
29 Properties |
| 2003 | £123,826 | 11% |
36 Properties |
| 2002 | £109,867 | 22% |
35 Properties |
| 2001 | £85,367 | -15% |
23 Properties |
| 2000 | £98,275 | 23% |
34 Properties |
| 1999 | £75,361 | 7% |
17 Properties |
| 1998 | £70,372 | 9% |
18 Properties |
| 1997 | £63,928 | -5% |
23 Properties |
| 1996 | £67,093 | 39% |
32 Properties |
| 1995 | £41,029 | - |
12 Properties |
Property Price per Property Type in Caerwys
Here you can find historic sold price data in order to help with your property search.
The average Property Paid Price for specific property types in the last three years are:
| Property Type | Average Sold Price | Sold Properties |
|---|---|---|
| Semi Detached House | £223,421.00 | 14 Semi Detached Houses |
| Detached House | £324,784.00 | 35 Detached Houses |
| Terraced House | £169,260.00 | 23 Terraced Houses |
| Flat | £93,000.00 | 1 Flat |

