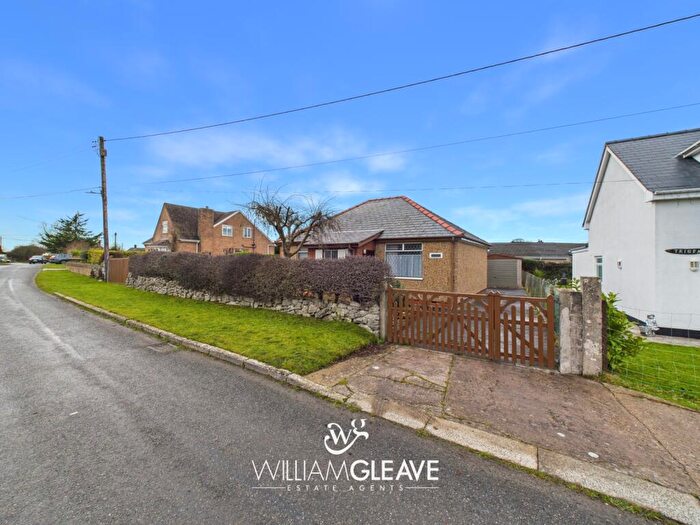
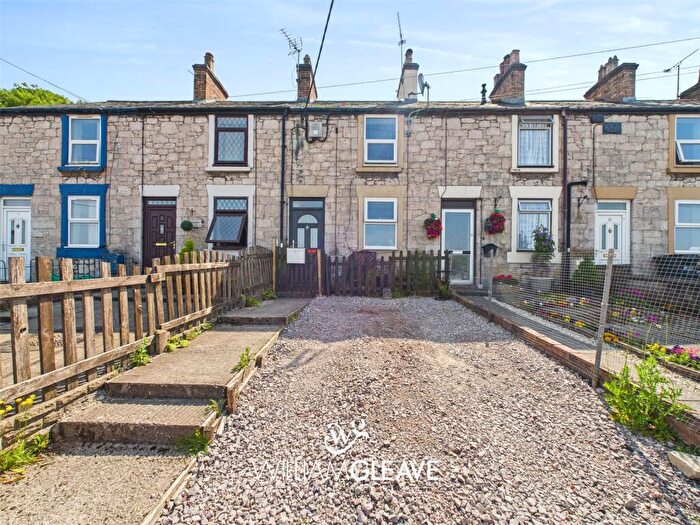
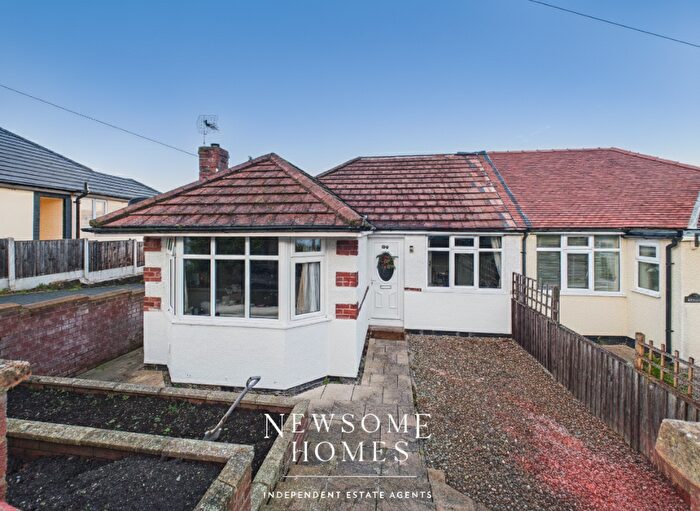
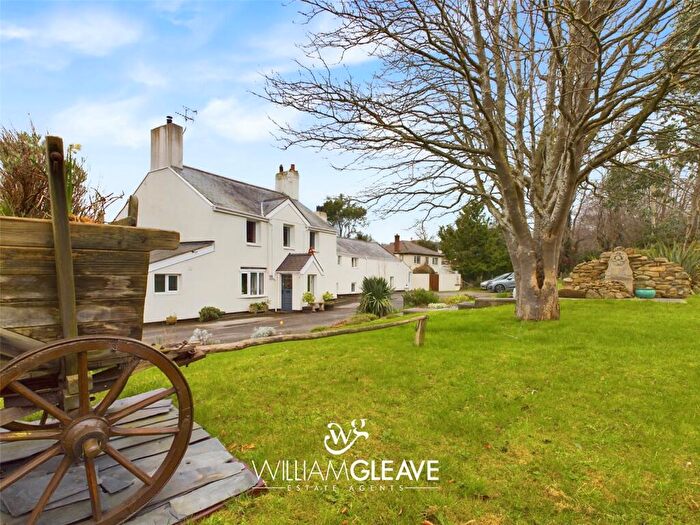
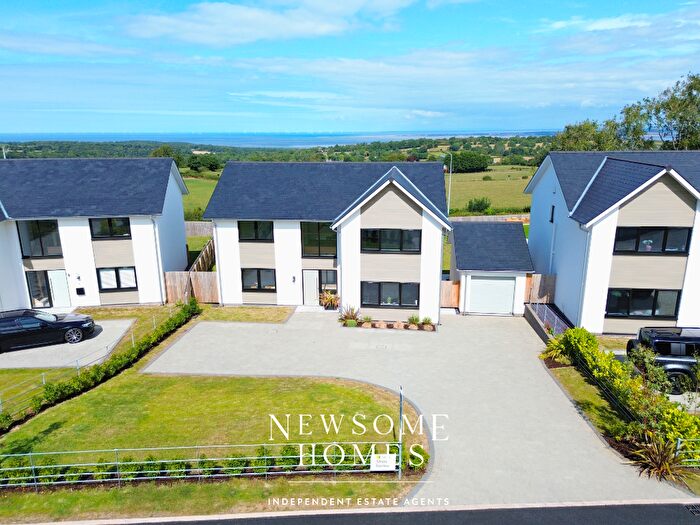
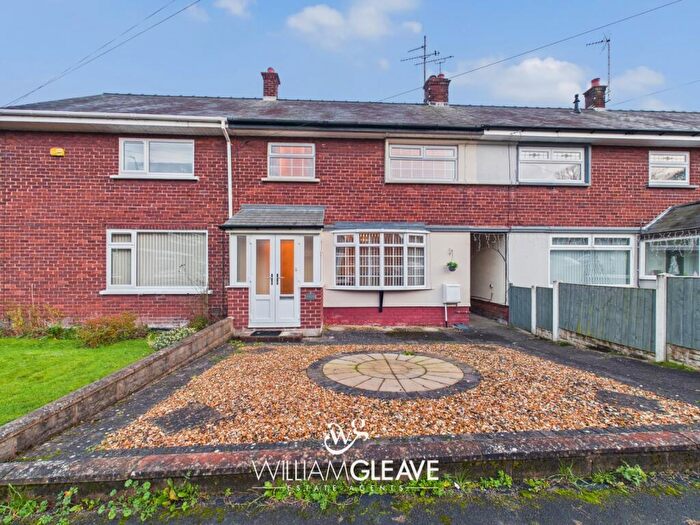
Houses for sale & to rent in Whitford, Holywell
House Prices in Whitford
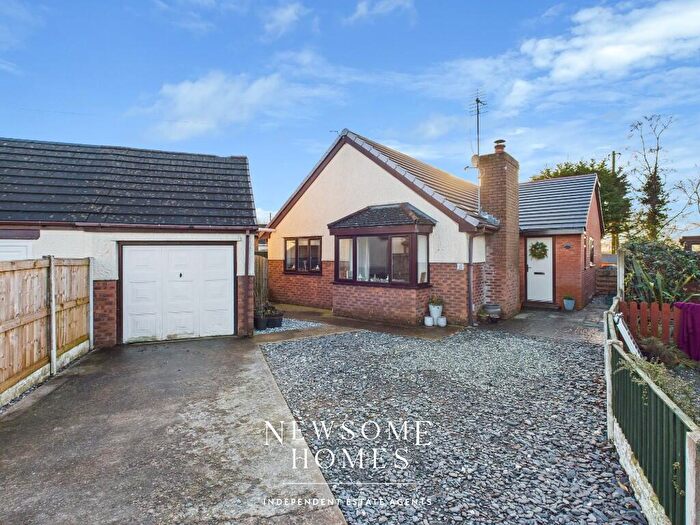
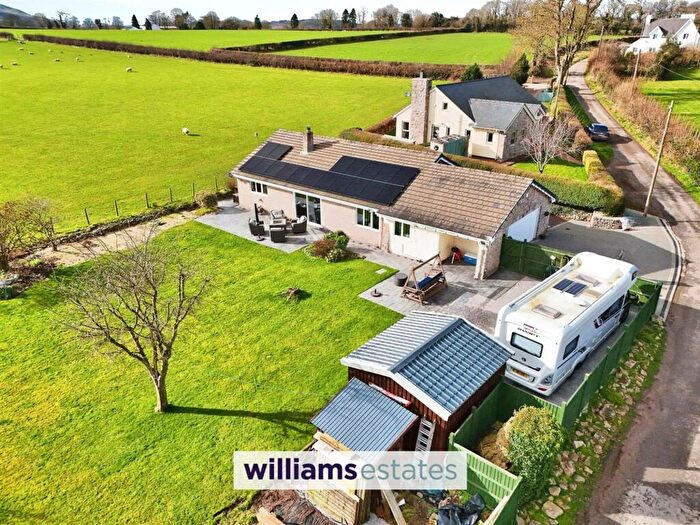
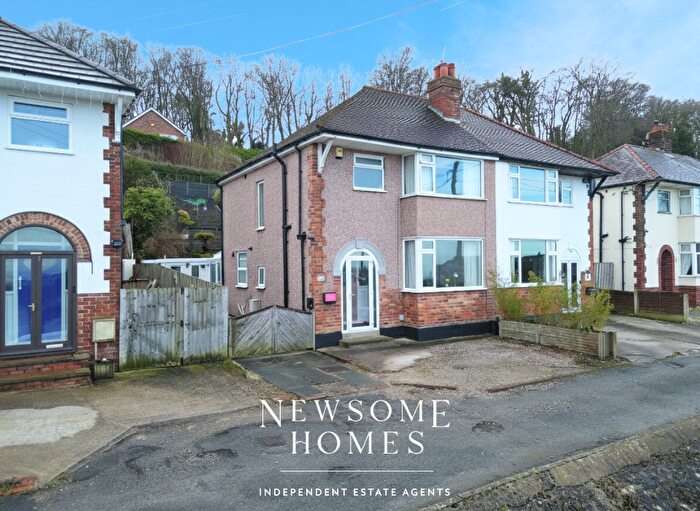
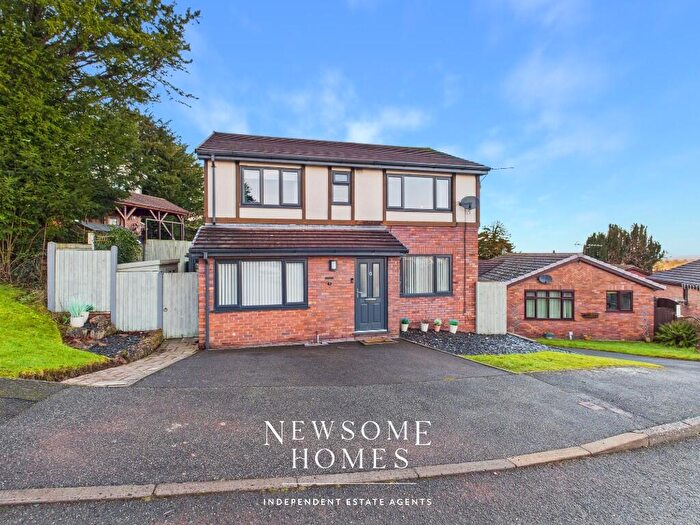
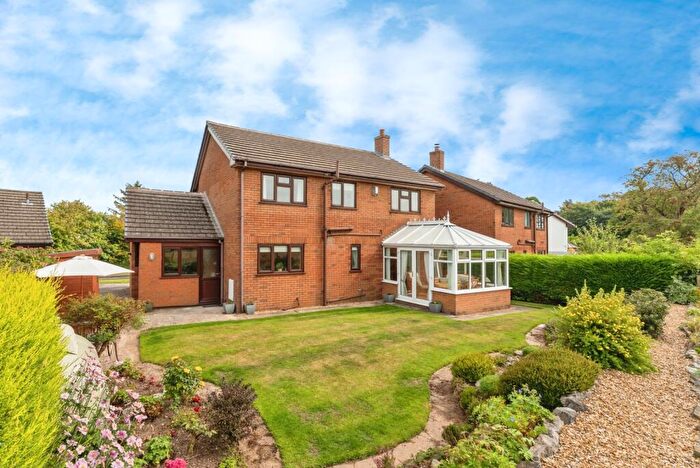
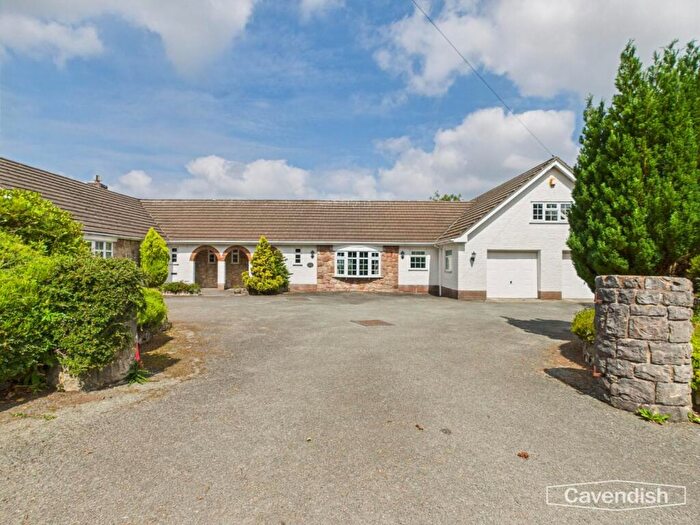
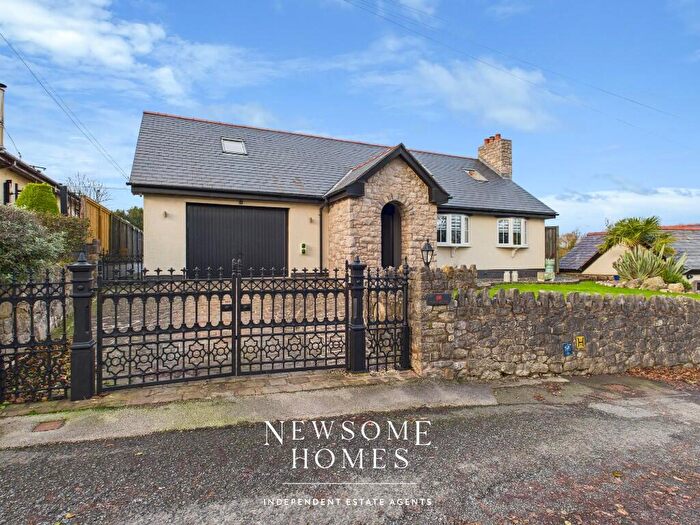
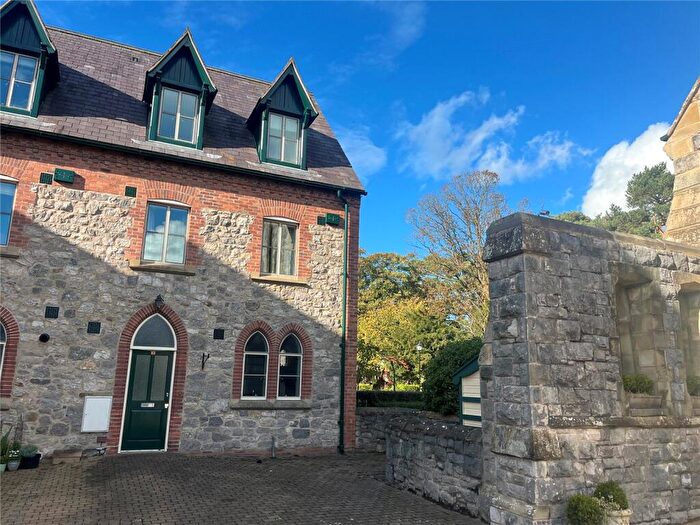
Properties in Whitford have an average house price of £249,732.00 and had 96 Property Transactions within the last 3 years¹.
Whitford is an area in Holywell, Sir y Fflint - Flintshire with 962 households², where the most expensive property was sold for £630,000.00.
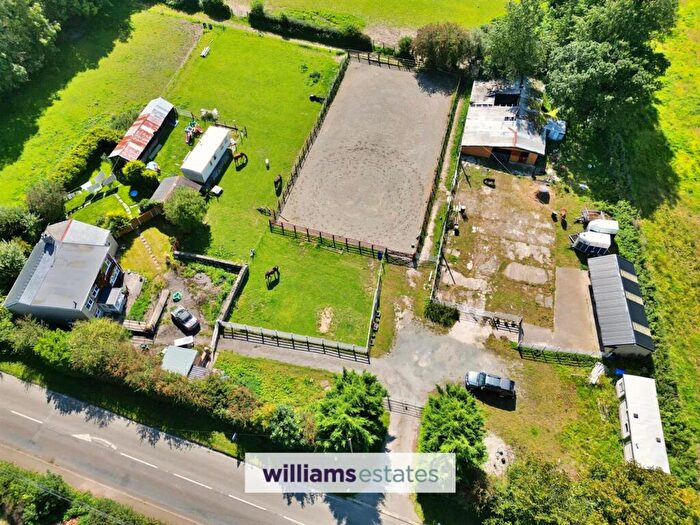
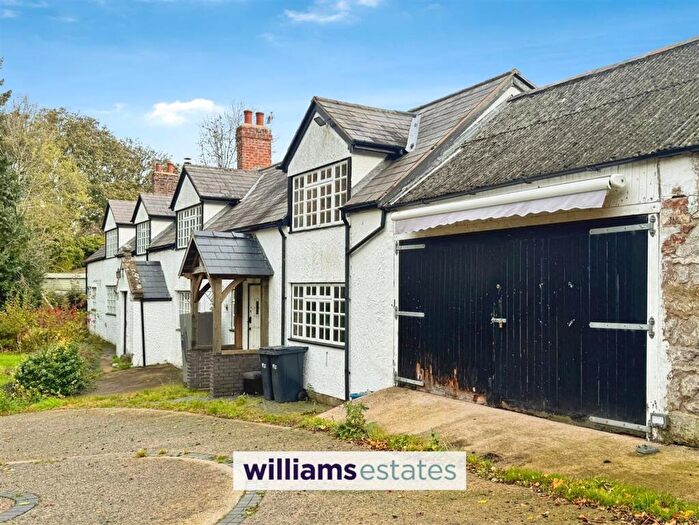
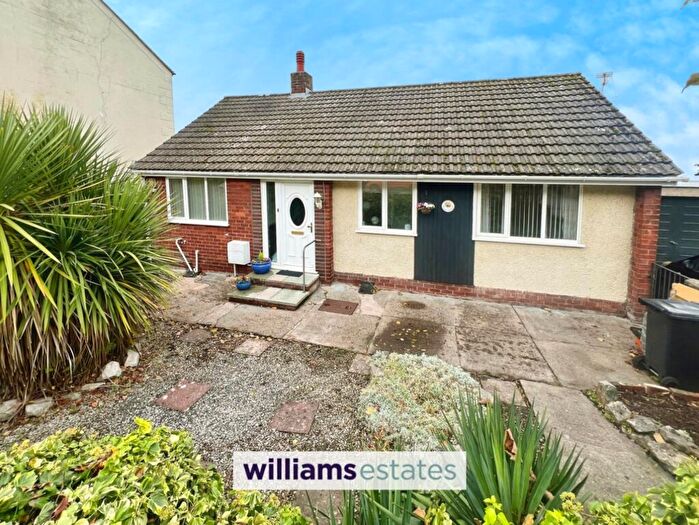
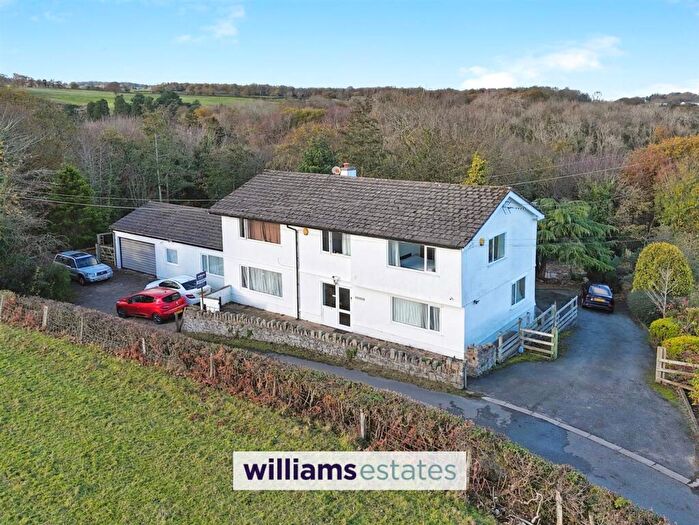
Properties for sale in Whitford
Roads and Postcodes in Whitford
Navigate through our locations to find the location of your next house in Whitford, Holywell for sale or to rent.
| Streets | Postcodes |
|---|---|
| Allt Y Golch | CH8 8QT |
| Babell Road | CH8 8PW CH8 8RB |
| Bryn Aelwyd Ucha | CH8 8SP |
| Bryn Aur | CH8 8RA |
| Bryn Coch Road | CH8 8SN |
| Brynhyfryd Cottages | CH8 8RN |
| Carmel Hill | CH8 8NZ CH8 8PD |
| Carmel Road | CH8 7DD CH8 8NU CH8 8NW CH8 8QP |
| Celyn Close | CH8 8RJ |
| Celyn Lane | CH8 8QW |
| Celyn Park | CH8 8RR |
| Clos Llannerch | CH8 8PA |
| Clos Tyn Y Clogwyn | CH8 8AZ |
| Clydfan | CH8 8RH |
| Crecas Lane | CH8 8NN |
| Crown Estate | CH8 8RY |
| Druids Close | CH8 8QY |
| Fachallt Road | CH8 9AL |
| Ffordd Aelwyd | CH8 8SH |
| Ffordd Ffynnon | CH8 8SJ |
| Ffordd Gwelfor | CH8 8SQ |
| Ffordd Neuadd | CH8 8NT |
| Ffordd Pentre | CH8 8SL |
| Hafod Y Coed | CH8 8NY |
| Holway Road | CH8 7DR CH8 8BH |
| Llwyn Ifor Lane | CH8 9ER |
| Llys Y Mor | CH8 8SR |
| Maes Rhydwen | CH8 9AP |
| Mertyn Lane | CH8 8QN |
| Monastery Road | CH8 8PL CH8 8PN CH8 8PB CH8 8PE CH8 8PH |
| Mount Carmel | CH8 8QR |
| Old Rock Cottages | CH8 8QU |
| Osprey Court | CH8 8QA |
| Pant Y Wacco | CH8 8QX |
| Parc Gorsedd | CH8 8RP |
| Park Avenue | CH8 7DL |
| Park Crescent | CH8 7DJ |
| Park Drive | CH8 7DH |
| Park Road | CH8 7DG |
| Pen Yr Allt | CH8 9DD |
| Penfforddllan | CH8 8SD |
| Post Office Lane | CH8 8PJ |
| Saithaelwyd Park | CH8 7DQ |
| Saithaelwyd Villas | CH8 7DE |
| Saithffynnon | CH8 9EN |
| St Asaph Road | CH8 8RD CH8 8RF |
| St Clares Court | CH8 8RS |
| St Davids Close | CH8 8RE |
| Tan Y Coed | CH8 8NH |
| Top Y Lloc Lane | CH8 8RW |
| Tudor Park | CH8 8NX |
| Upper Downing Road | CH8 9AJ |
| Whitford Road | CH8 9AE CH8 9AF CH8 9AG |
| Windsor Park | CH8 7DF |
| CH8 8NS CH8 8QZ CH8 8RG CH8 8RQ CH8 8RU CH8 8SB CH8 9AH CH8 9AN CH8 8RZ CH8 9AR |
Transport near Whitford
-
Flint Station
-
Prestatyn Station
-
West Kirby Station
-
Hoylake Station
-
Neston Station
-
Heswall Station
-
Manor Road Station
-
Meols Station
-
Rhyl Station
- FAQ
- Price Paid By Year
- Property Type Price
Frequently asked questions about Whitford
What is the average price for a property for sale in Whitford?
The average price for a property for sale in Whitford is £249,732. This amount is 16% higher than the average price in Holywell. There are 508 property listings for sale in Whitford.
What streets have the most expensive properties for sale in Whitford?
The streets with the most expensive properties for sale in Whitford are Druids Close at an average of £488,600, Upper Downing Road at an average of £450,000 and Pen Yr Allt at an average of £448,250.
What streets have the most affordable properties for sale in Whitford?
The streets with the most affordable properties for sale in Whitford are Mount Carmel at an average of £84,000, Maes Rhydwen at an average of £125,000 and Hafod Y Coed at an average of £140,000.
Which train stations are available in or near Whitford?
Some of the train stations available in or near Whitford are Flint, Prestatyn and West Kirby.
Property Price Paid in Whitford by Year
The average sold property price by year was:
| Year | Average Sold Price | Price Change |
Sold Properties
|
|---|---|---|---|
| 2025 | £255,594 | 4% |
26 Properties |
| 2024 | £246,418 | -1% |
38 Properties |
| 2023 | £248,906 | -9% |
32 Properties |
| 2022 | £271,196 | -3% |
43 Properties |
| 2021 | £278,640 | 29% |
40 Properties |
| 2020 | £198,775 | -4% |
39 Properties |
| 2019 | £205,776 | -8% |
38 Properties |
| 2018 | £221,444 | 8% |
38 Properties |
| 2017 | £203,784 | -5% |
35 Properties |
| 2016 | £214,909 | 24% |
50 Properties |
| 2015 | £163,480 | -6% |
43 Properties |
| 2014 | £173,384 | -16% |
35 Properties |
| 2013 | £201,864 | -6% |
26 Properties |
| 2012 | £213,722 | 2% |
18 Properties |
| 2011 | £210,441 | 11% |
24 Properties |
| 2010 | £186,895 | 2% |
23 Properties |
| 2009 | £182,390 | -6% |
23 Properties |
| 2008 | £192,823 | 3% |
23 Properties |
| 2007 | £187,139 | -24% |
42 Properties |
| 2006 | £232,981 | 6% |
48 Properties |
| 2005 | £219,638 | 38% |
32 Properties |
| 2004 | £135,493 | -6% |
41 Properties |
| 2003 | £144,288 | 43% |
43 Properties |
| 2002 | £82,253 | 3% |
50 Properties |
| 2001 | £79,411 | -5% |
38 Properties |
| 2000 | £83,201 | 28% |
31 Properties |
| 1999 | £59,734 | -17% |
29 Properties |
| 1998 | £70,105 | -3% |
28 Properties |
| 1997 | £72,529 | 30% |
36 Properties |
| 1996 | £50,627 | -15% |
27 Properties |
| 1995 | £58,210 | - |
24 Properties |
Property Price per Property Type in Whitford
Here you can find historic sold price data in order to help with your property search.
The average Property Paid Price for specific property types in the last three years are:
| Property Type | Average Sold Price | Sold Properties |
|---|---|---|
| Semi Detached House | £190,486.00 | 37 Semi Detached Houses |
| Detached House | £313,182.00 | 46 Detached Houses |
| Terraced House | £199,241.00 | 6 Terraced Houses |
| Flat | £189,214.00 | 7 Flats |

