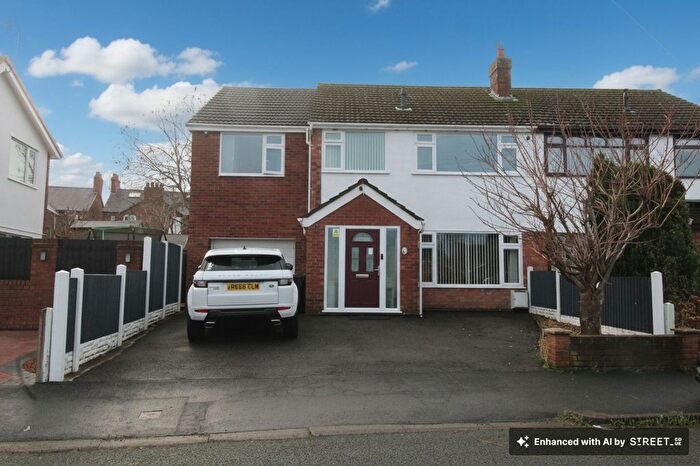
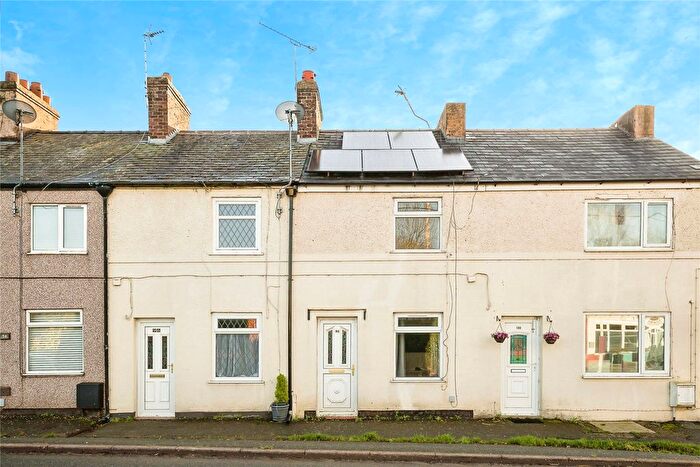
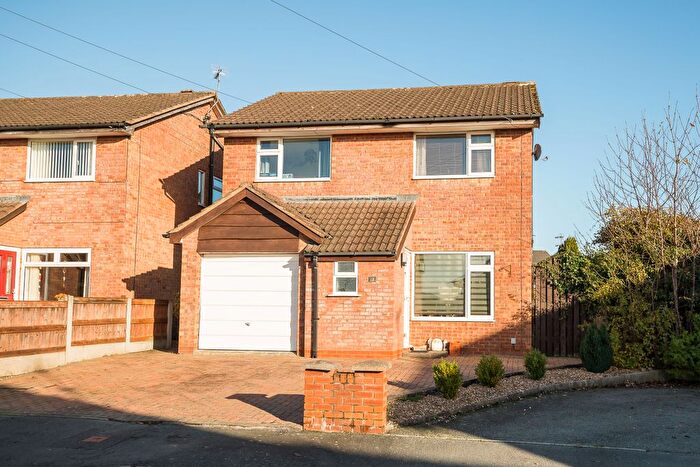
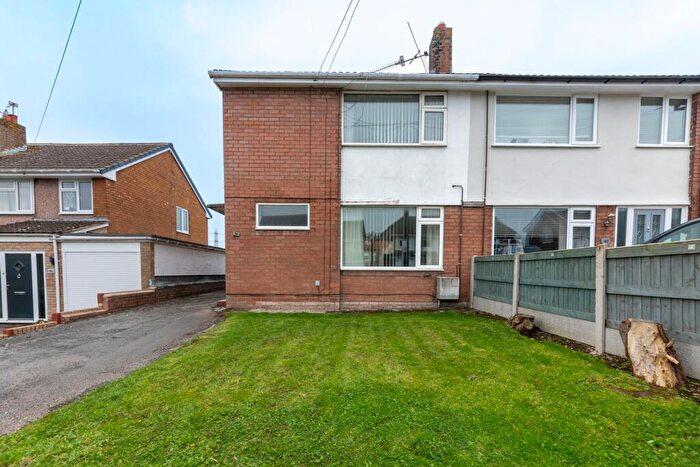
Houses for sale & to rent in New Brighton, Mold
House Prices in New Brighton
Properties in New Brighton have an average house price of £247,023.00 and had 114 Property Transactions within the last 3 years¹.
New Brighton is an area in Mold, Sir y Fflint - Flintshire with 1,264 households², where the most expensive property was sold for £1,050,000.00.
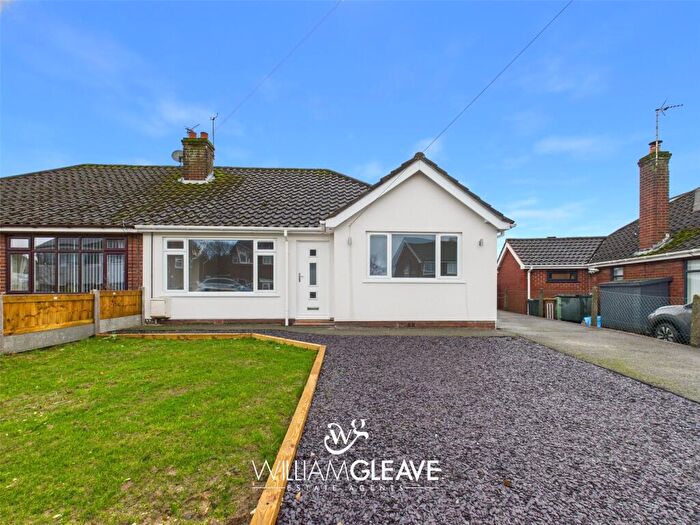
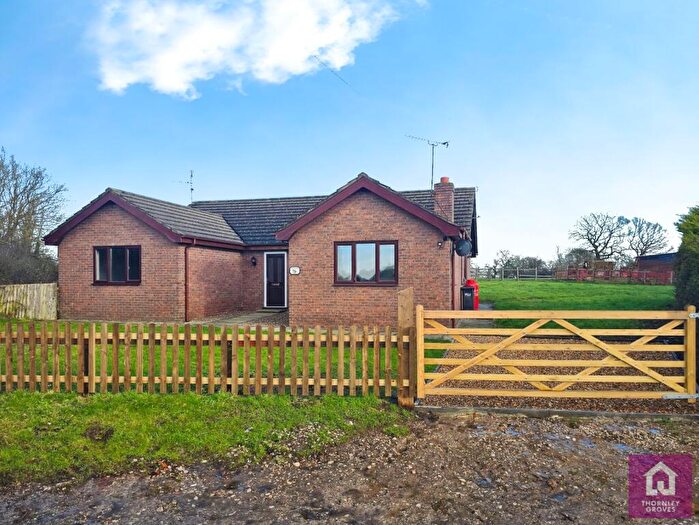
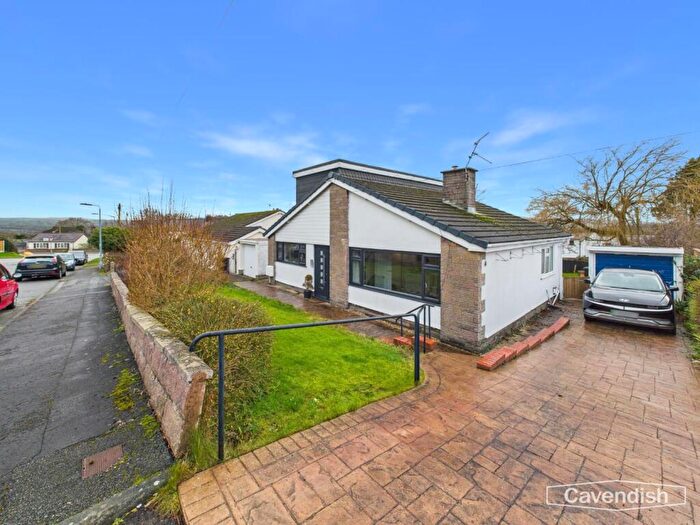
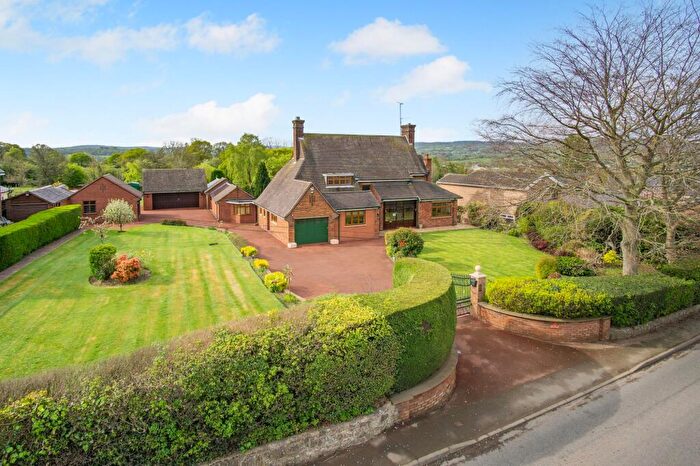
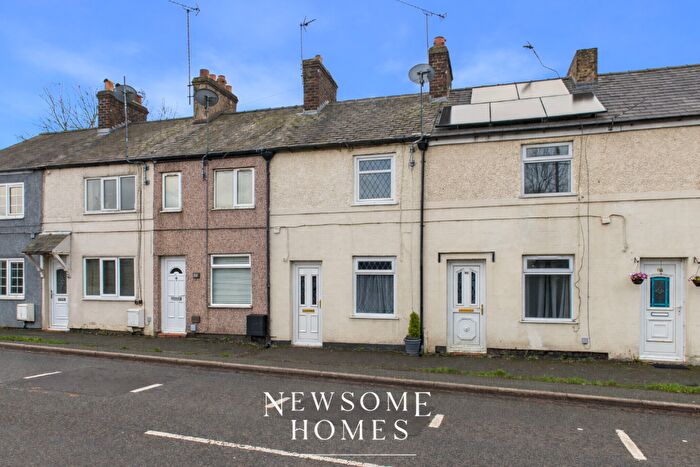
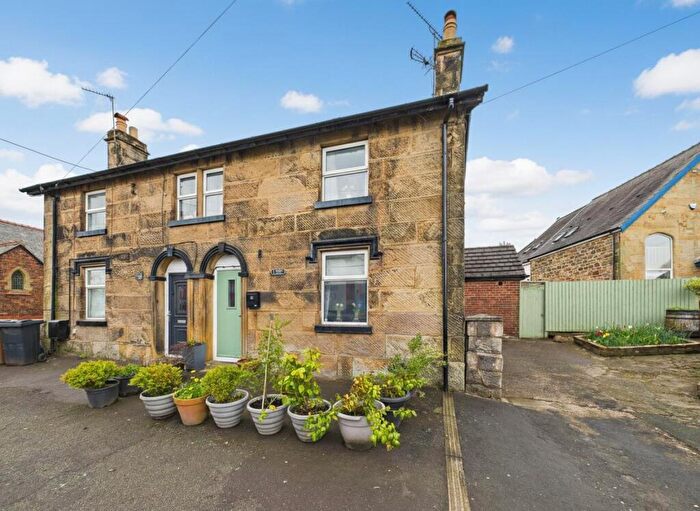
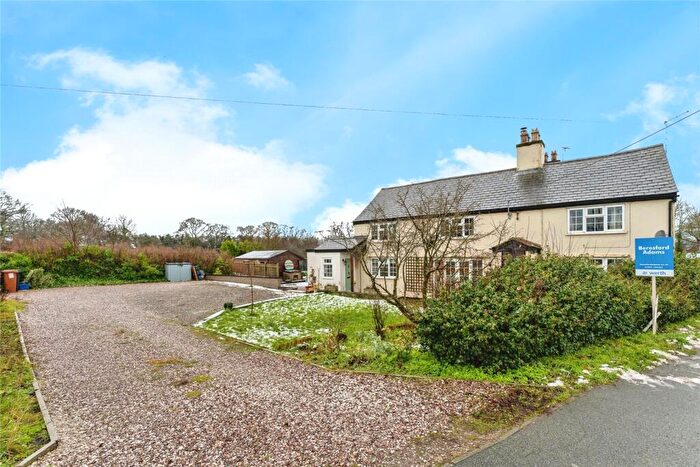
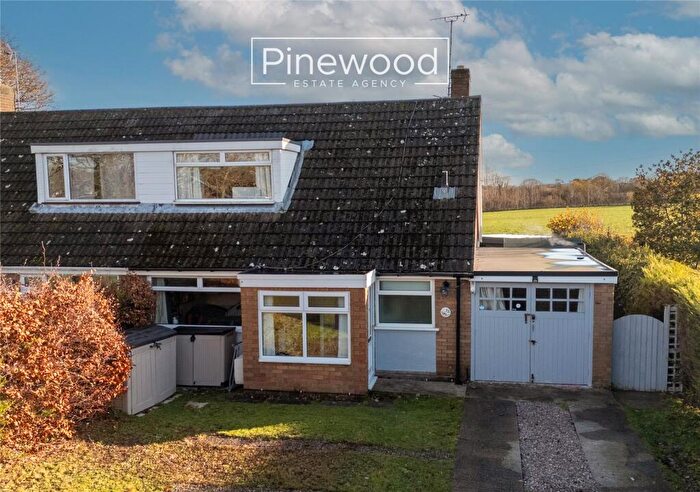
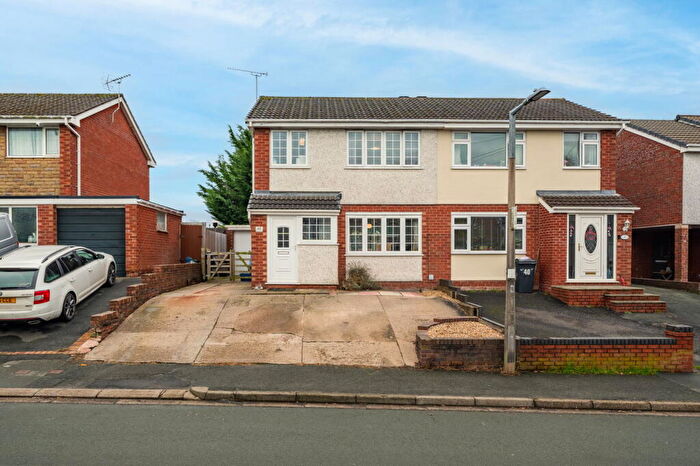
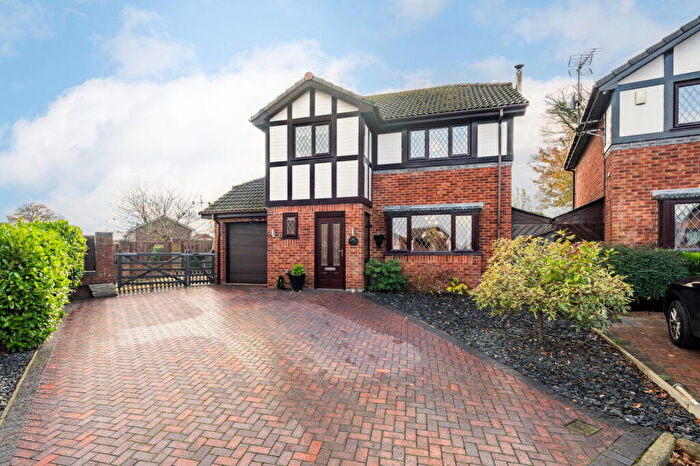
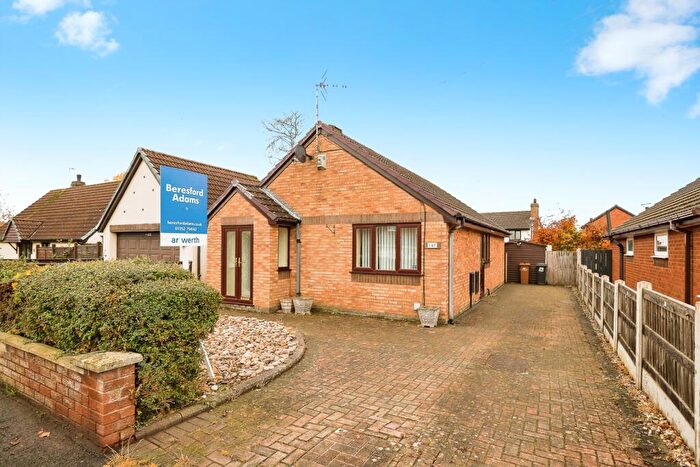
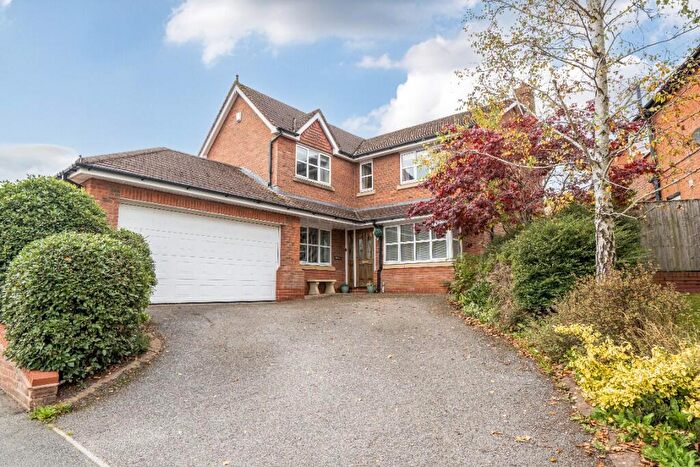
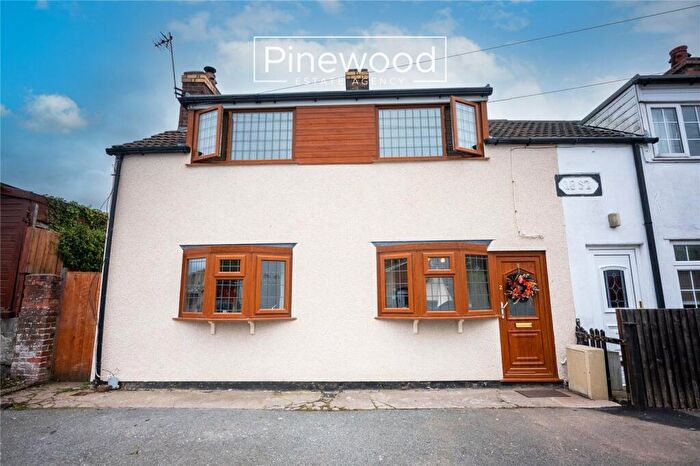
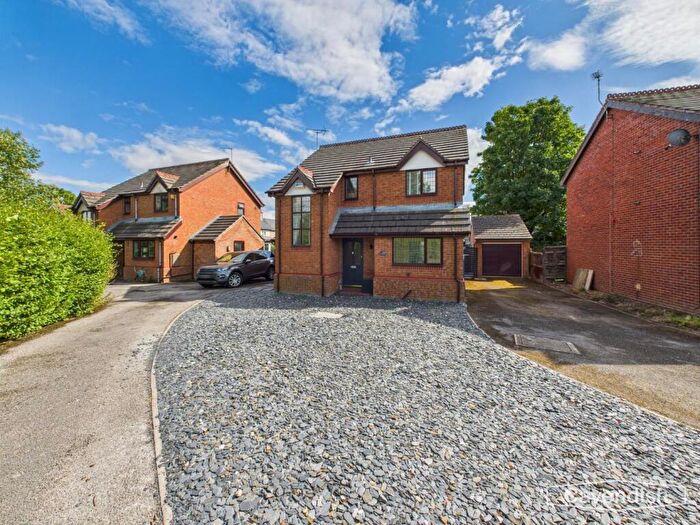
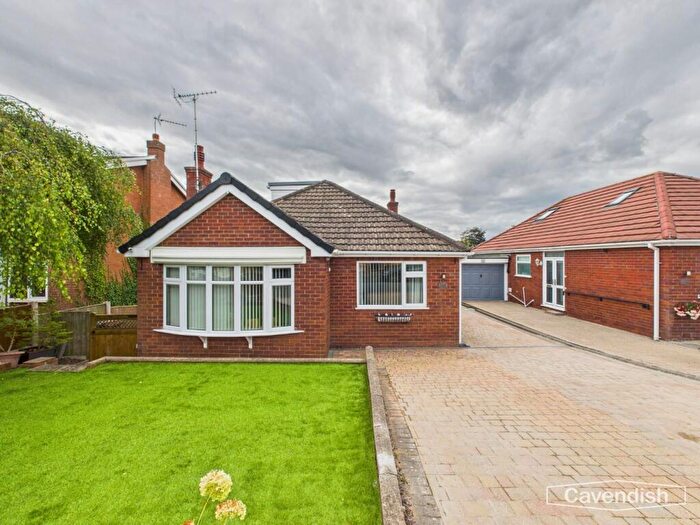
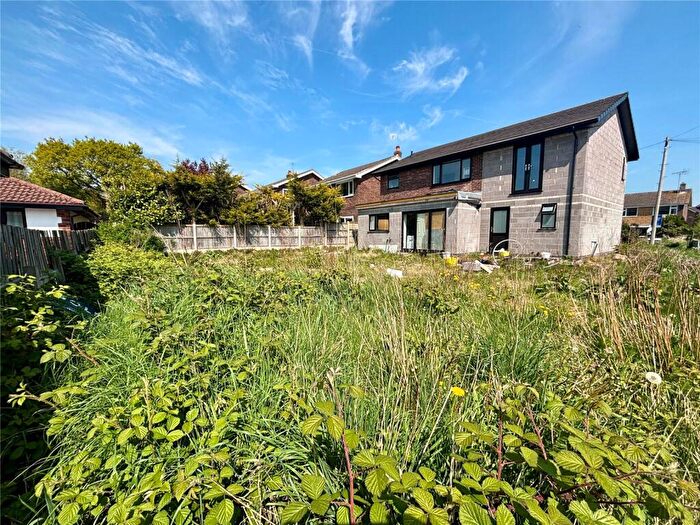
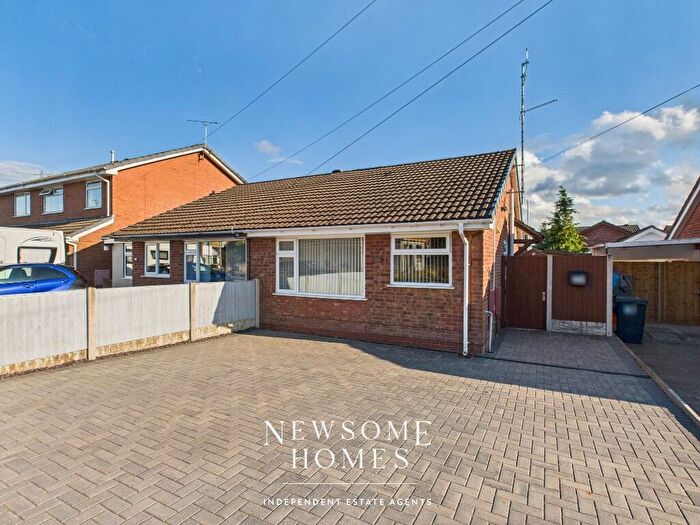
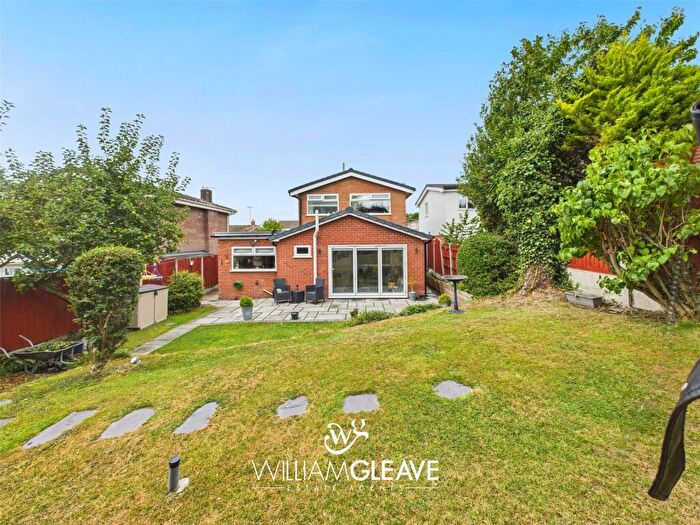
Properties for sale in New Brighton
Previously listed properties in New Brighton
Roads and Postcodes in New Brighton
Navigate through our locations to find the location of your next house in New Brighton, Mold for sale or to rent.
| Streets | Postcodes |
|---|---|
| Alltami Road | CH7 6LQ |
| Argoed Avenue | CH7 6QL |
| Argoed Hall Lane | CH7 6SQ CH7 6FQ |
| Argoed View | CH7 6QJ |
| Bron Yr Eglwys | CH7 6YQ |
| Bryan Grove | CH7 6UW |
| Bryn Clwyd | CH7 6XP CH7 6XW |
| Bryn Lane | CH7 6RD CH7 6QY |
| Bryn Road | CH7 6RY CH7 6SF CH7 6WL |
| Cae Isa | CH7 6ZA |
| Canol Y Bryn | CH7 6WT |
| Chambers Lane | CH7 6SJ CH7 6UB CH7 6UZ |
| Chapel Lane | CH7 6TS |
| Cherry Drive | CH7 6RA |
| Clwyd Crescent | CH7 6QU |
| Cwm Close | CH7 6XJ |
| East Close | CH7 6XN |
| East View | CH7 6RG |
| Englefield Crescent | CH7 6UN |
| Erw Fach | CH7 6YD |
| Erw Goed | CH7 6YE |
| Ffordd Fer | CH7 6XQ |
| Gosmore Road | CH7 6QN |
| Hazel Grove | CH7 6FW |
| Heol Fammau | CH7 6XD |
| Hill View | CH7 6SL |
| Lindum Close | CH7 6QA |
| Llwyn Derw | CH7 6XH |
| Llys Argoed | CH7 6TX |
| Llys Dedwydd | CH7 6YN |
| Llys Fammau | CH7 6YS |
| Llys Gwynant | CH7 6NL |
| Llys Wylfa | CH7 6XA CH7 6XB |
| Llys Y Graig | CH7 6SG |
| Main Road | CH7 6QP CH7 6QQ CH7 6QS CH7 6QT CH7 6QW CH7 6QR |
| Moel Fammau Road | CH7 6QX |
| Moel Ganol | CH7 6XG |
| Moel Gron | CH7 6XE CH7 6XF |
| Mold Road | CH7 6TG |
| Moorcroft | CH7 6RF CH7 6RU CH7 6RX |
| Mount Close | CH7 6XL |
| New Brighton Road | CH7 6RB |
| Oakfield Close | CH7 6WE |
| Parc Issa | CH7 6NH |
| Pen Y Lon | CH7 6YG |
| Pen Y Maes | CH7 6YL |
| Rockcliffe | CH7 6SE |
| Stone Cottages | CH7 6UD |
| Tan Y Bryn | CH7 6UE |
| Trem Afon | CH7 6YR |
| Uwch Y Nant | CH7 6YP |
| Vale Drive | CH7 6YW |
| West View Drive | CH7 6YF |
| Wylfa Avenue | CH7 6YH |
| Yr Ydlan | CH7 6ZB |
Transport near New Brighton
- FAQ
- Price Paid By Year
- Property Type Price
Frequently asked questions about New Brighton
What is the average price for a property for sale in New Brighton?
The average price for a property for sale in New Brighton is £247,023. This amount is 0.04% higher than the average price in Mold. There are 274 property listings for sale in New Brighton.
What streets have the most expensive properties for sale in New Brighton?
The streets with the most expensive properties for sale in New Brighton are Parc Issa at an average of £384,166, Pen Y Lon at an average of £338,743 and Bryn Road at an average of £325,300.
What streets have the most affordable properties for sale in New Brighton?
The streets with the most affordable properties for sale in New Brighton are Cae Isa at an average of £140,500, Moel Fammau Road at an average of £155,000 and Bryn Lane at an average of £160,250.
Which train stations are available in or near New Brighton?
Some of the train stations available in or near New Brighton are Buckley, Penyffordd and Hawarden.
Property Price Paid in New Brighton by Year
The average sold property price by year was:
| Year | Average Sold Price | Price Change |
Sold Properties
|
|---|---|---|---|
| 2025 | £250,586 | 10% |
29 Properties |
| 2024 | £224,333 | -28% |
56 Properties |
| 2023 | £287,275 | 19% |
29 Properties |
| 2022 | £231,673 | 2% |
36 Properties |
| 2021 | £228,032 | 14% |
46 Properties |
| 2020 | £197,211 | -8% |
42 Properties |
| 2019 | £212,067 | 10% |
64 Properties |
| 2018 | £189,968 | 5% |
70 Properties |
| 2017 | £181,354 | -3% |
32 Properties |
| 2016 | £187,206 | 18% |
43 Properties |
| 2015 | £153,681 | -6% |
41 Properties |
| 2014 | £163,473 | 10% |
56 Properties |
| 2013 | £146,441 | -6% |
34 Properties |
| 2012 | £155,383 | 3% |
28 Properties |
| 2011 | £151,118 | 6% |
25 Properties |
| 2010 | £142,596 | -6% |
15 Properties |
| 2009 | £150,633 | -32% |
24 Properties |
| 2008 | £198,341 | 18% |
19 Properties |
| 2007 | £162,986 | 4% |
51 Properties |
| 2006 | £156,095 | -5% |
56 Properties |
| 2005 | £163,136 | -0,1% |
37 Properties |
| 2004 | £163,368 | 26% |
58 Properties |
| 2003 | £121,202 | 14% |
59 Properties |
| 2002 | £104,759 | 9% |
69 Properties |
| 2001 | £95,038 | 27% |
74 Properties |
| 2000 | £69,825 | 8% |
50 Properties |
| 1999 | £64,557 | 8% |
31 Properties |
| 1998 | £59,114 | 9% |
52 Properties |
| 1997 | £53,510 | 0,3% |
65 Properties |
| 1996 | £53,356 | -3% |
44 Properties |
| 1995 | £54,766 | - |
35 Properties |
Property Price per Property Type in New Brighton
Here you can find historic sold price data in order to help with your property search.
The average Property Paid Price for specific property types in the last three years are:
| Property Type | Average Sold Price | Sold Properties |
|---|---|---|
| Semi Detached House | £206,740.00 | 53 Semi Detached Houses |
| Detached House | £297,500.00 | 54 Detached Houses |
| Terraced House | £158,900.00 | 6 Terraced Houses |
| Flat | £185,000.00 | 1 Flat |

