Houses for sale & to rent in Mold East, Mold
House Prices in Mold East
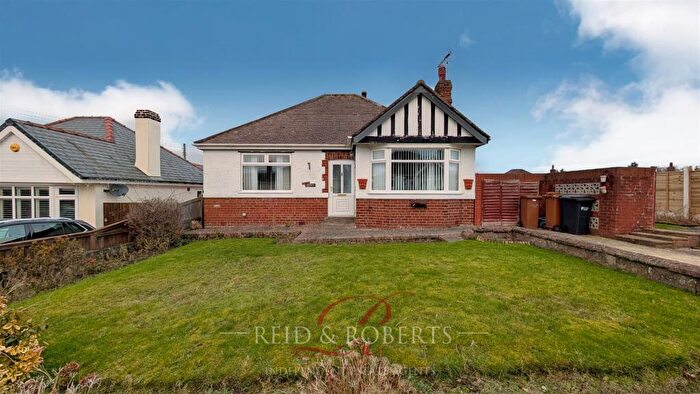
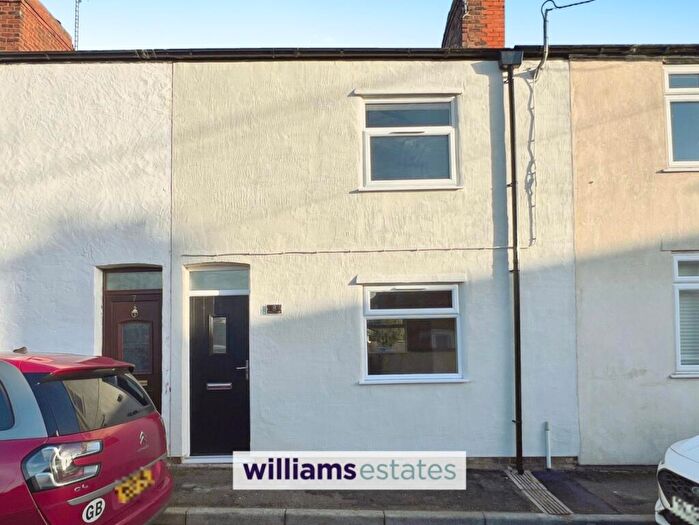
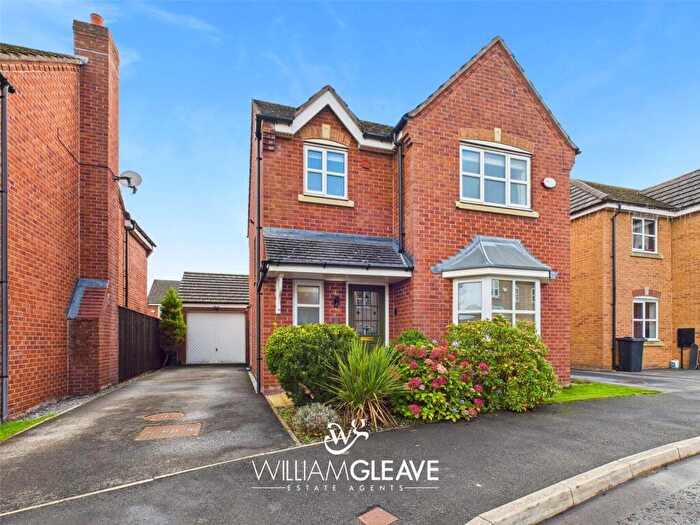
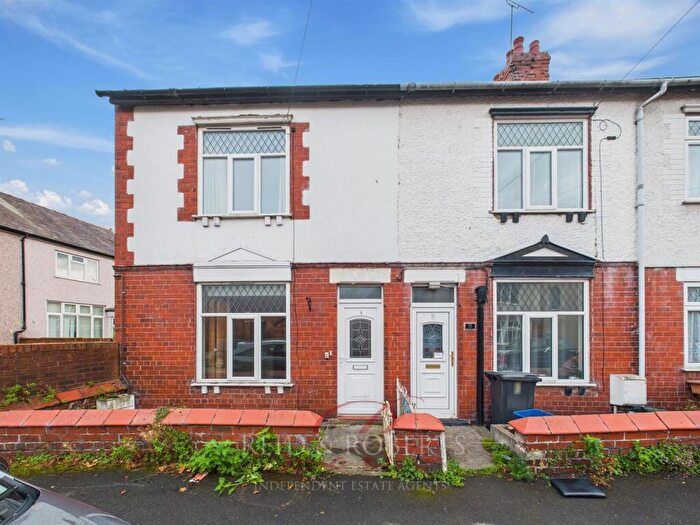
Properties in Mold East have an average house price of £214,490.00 and had 105 Property Transactions within the last 3 years¹.
Mold East is an area in Mold, Sir y Fflint - Flintshire with 884 households², where the most expensive property was sold for £558,000.00.
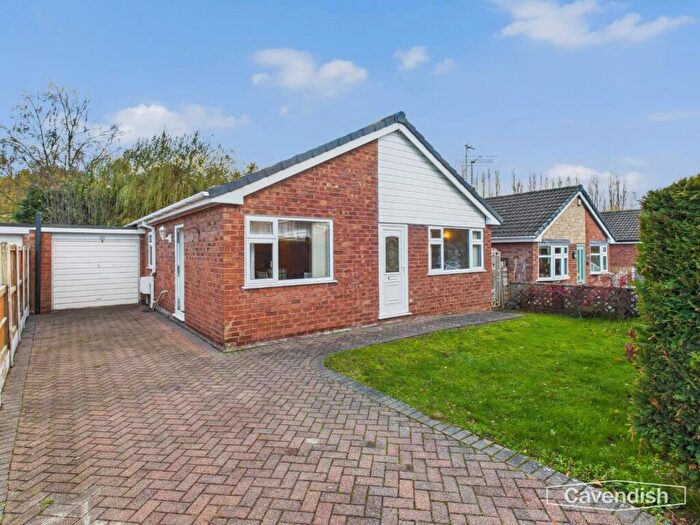
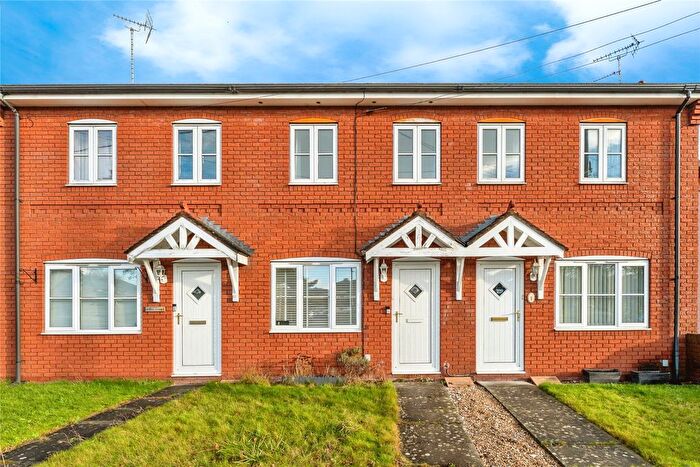
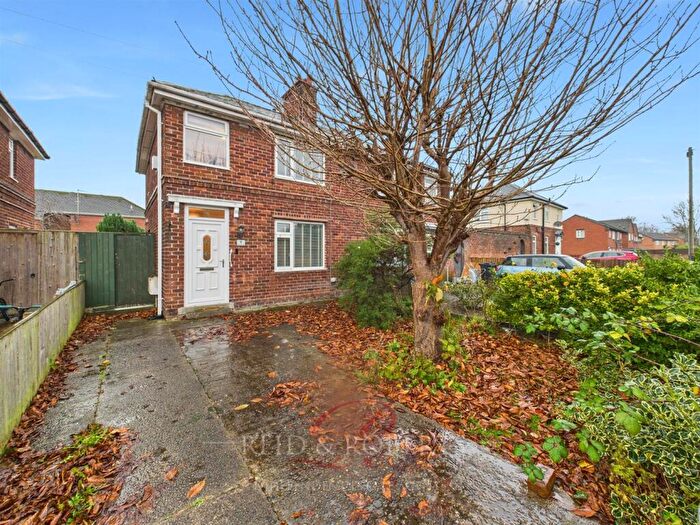
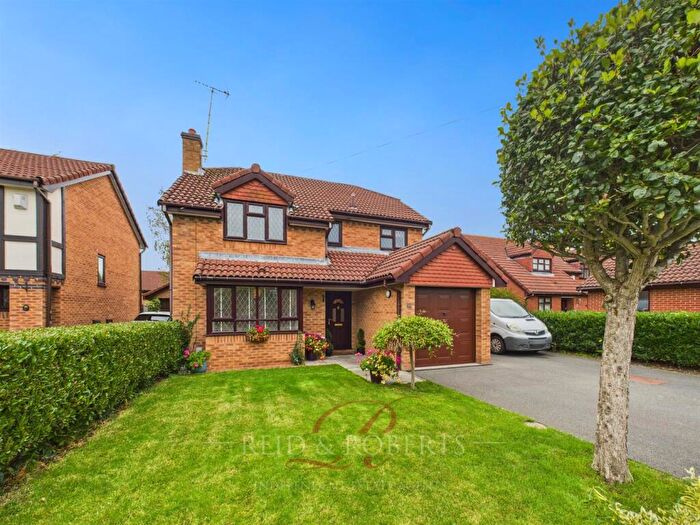
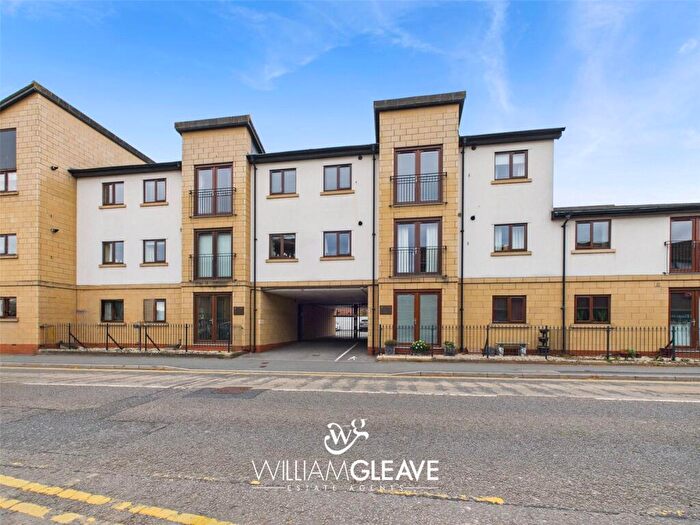
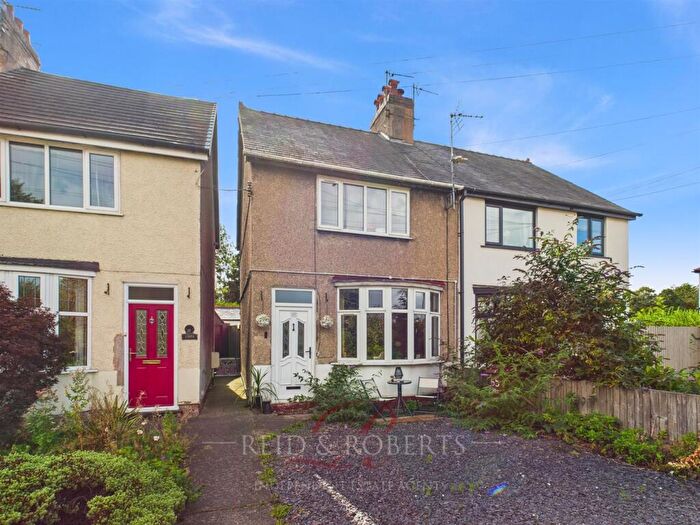
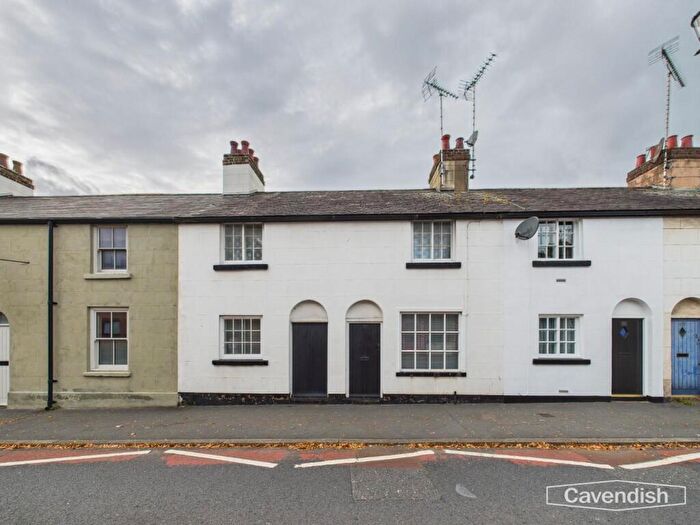
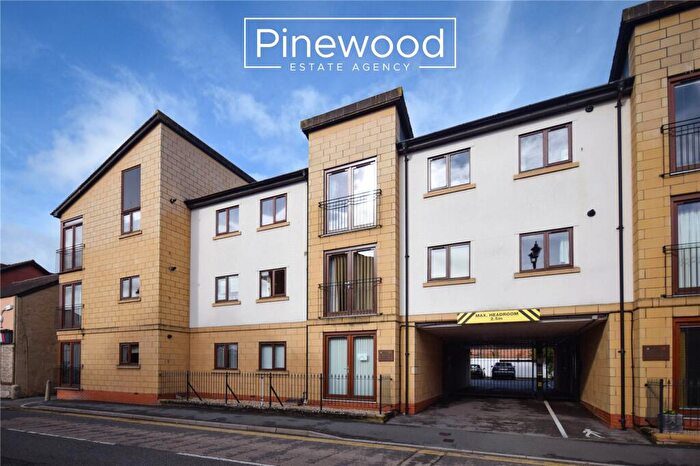
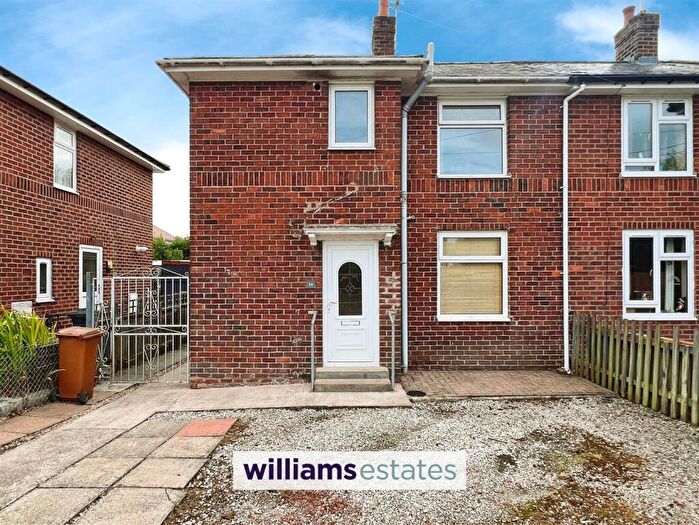
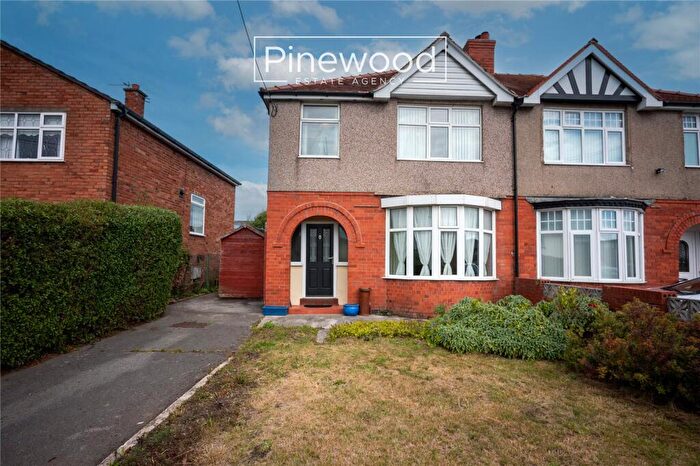
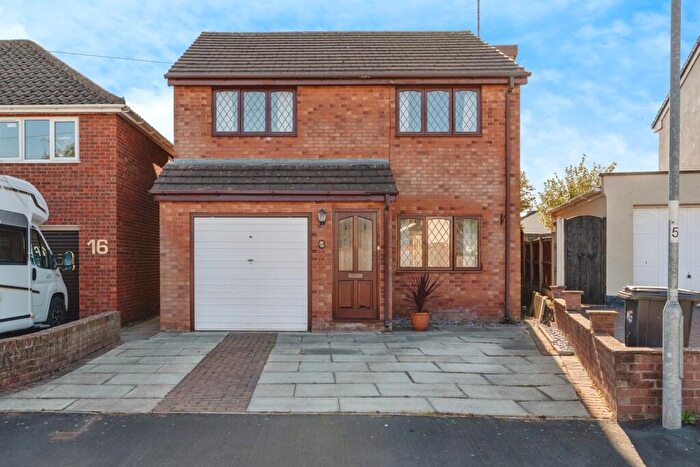
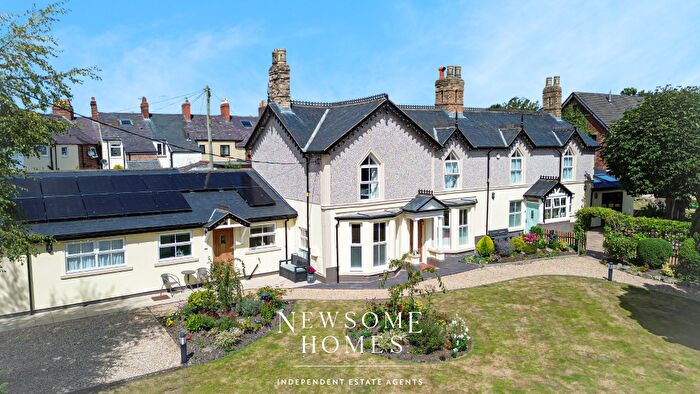
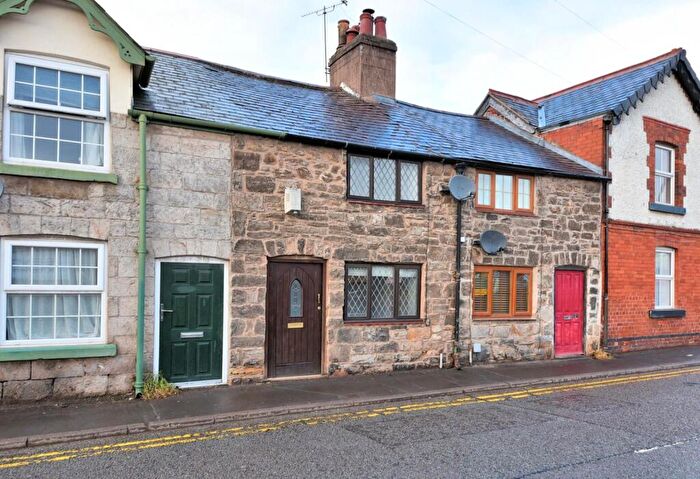
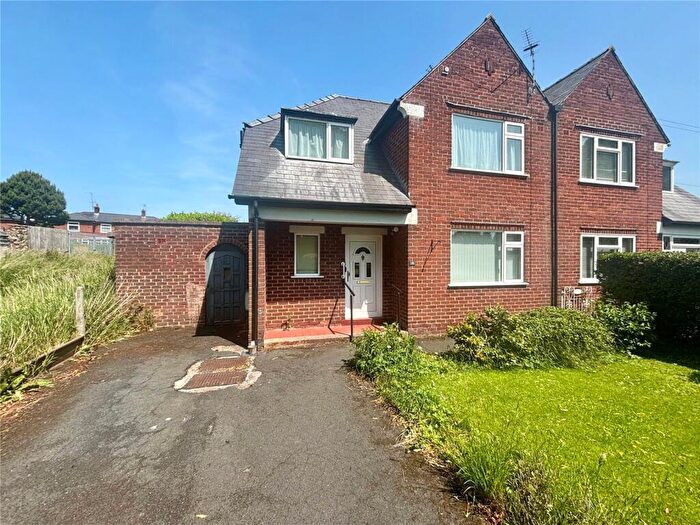
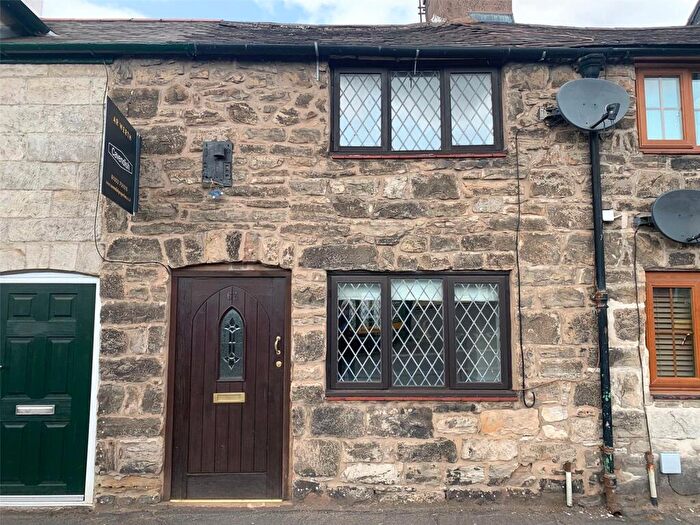
Properties for sale in Mold East
Roads and Postcodes in Mold East
Navigate through our locations to find the location of your next house in Mold East, Mold for sale or to rent.
| Streets | Postcodes |
|---|---|
| Alexandra Road | CH7 1HJ |
| Alyn Bank | CH7 1LR |
| Alyn Street | CH7 1LN |
| Alyn View | CH7 1LP |
| Ambrose Terrace | CH7 1HL |
| Bridge Street | CH7 1LW |
| Broalun | CH7 1LX CH7 1NA CH7 1NB |
| Bron Y Nant | CH7 1UX |
| Bryn Awelon | CH7 1LT CH7 1LU |
| Bypass Road | CH7 1UD |
| Chester Road | CH7 1UE CH7 1UH CH7 1UJ CH7 1UQ CH7 1LE CH7 1UF |
| Chester Street | CH7 1EG |
| Civic Centre | CH7 1YA |
| Cwrt Cranfield | CH7 6GW |
| Cwrt Rhyd Galed | CH7 6QZ |
| Ffordd Argoed | CH7 1LY |
| Ffordd Pentre | CH7 1UY |
| Gordon Terrace | CH7 1LD |
| Grosvenor Street | CH7 1EJ |
| High Street | CH7 1DB |
| Kenstone Close | CH7 1SN |
| King Street | CH7 1LB CH7 1LG CH7 1EF |
| Llys Pont Y Felin | CH7 1FH |
| Llys Yr Efail | CH7 1GA |
| Lon Isaf | CH7 1XA |
| Lon Yr Orsaf | CH7 1GT |
| Marlow Terrace | CH7 1HH |
| Moldsdale Road | CH7 1US |
| Parc Alun | CH7 1LQ |
| Rhydygaled | CH7 6QG |
| River View | CH7 1LJ |
| St Davids Lane | CH7 1LH |
| The Cross | CH7 1ER |
| Tyddyn Street | CH7 1DX |
| Victoria Road | CH7 1EW |
| Victoria Terrace | CH7 1LL |
| Wood Green | CH7 1UG |
| Woodlands Close | CH7 1UT CH7 1UU |
| Woodlands Road | CH7 1UW CH7 1UN |
| Wrexham Street | CH7 1ES |
| CH7 1AE CH7 1FW CH7 1GS CH7 1UB CH7 6GT CH7 6NA CH7 6NB CH7 6ND CH7 6NF CH7 6NG CH7 6NN CH7 6NR CH7 6NT CH7 6NW CH7 6ZG CH7 9XA CH7 9ZY CH7 9ZZ |
Transport near Mold East
- FAQ
- Price Paid By Year
- Property Type Price
Frequently asked questions about Mold East
What is the average price for a property for sale in Mold East?
The average price for a property for sale in Mold East is £214,490. This amount is 14% lower than the average price in Mold. There are 295 property listings for sale in Mold East.
What streets have the most expensive properties for sale in Mold East?
The streets with the most expensive properties for sale in Mold East are Cwrt Cranfield at an average of £558,000, Bryn Awelon at an average of £275,750 and Marlow Terrace at an average of £275,000.
What streets have the most affordable properties for sale in Mold East?
The streets with the most affordable properties for sale in Mold East are Alexandra Road at an average of £116,550, Llys Yr Efail at an average of £120,500 and Bridge Street at an average of £121,464.
Which train stations are available in or near Mold East?
Some of the train stations available in or near Mold East are Buckley, Penyffordd and Hawarden.
Property Price Paid in Mold East by Year
The average sold property price by year was:
| Year | Average Sold Price | Price Change |
Sold Properties
|
|---|---|---|---|
| 2025 | £206,342 | -2% |
19 Properties |
| 2024 | £211,278 | -7% |
26 Properties |
| 2023 | £225,759 | 6% |
27 Properties |
| 2022 | £212,492 | 13% |
33 Properties |
| 2021 | £184,458 | 0,4% |
40 Properties |
| 2020 | £183,749 | 5% |
18 Properties |
| 2019 | £174,040 | 8% |
23 Properties |
| 2018 | £159,265 | 4% |
46 Properties |
| 2017 | £152,814 | -1% |
27 Properties |
| 2016 | £154,320 | -11% |
40 Properties |
| 2015 | £170,728 | 20% |
35 Properties |
| 2014 | £136,338 | 1% |
27 Properties |
| 2013 | £134,492 | -2% |
31 Properties |
| 2012 | £137,009 | -3% |
21 Properties |
| 2011 | £141,115 | 6% |
13 Properties |
| 2010 | £132,714 | 1% |
14 Properties |
| 2009 | £131,557 | -24% |
13 Properties |
| 2008 | £162,995 | -3% |
10 Properties |
| 2007 | £167,307 | -10% |
34 Properties |
| 2006 | £184,333 | 9% |
38 Properties |
| 2005 | £168,185 | 23% |
27 Properties |
| 2004 | £129,761 | 19% |
34 Properties |
| 2003 | £105,025 | 14% |
41 Properties |
| 2002 | £89,969 | 23% |
43 Properties |
| 2001 | £69,483 | 5% |
39 Properties |
| 2000 | £66,255 | 10% |
26 Properties |
| 1999 | £59,742 | 10% |
33 Properties |
| 1998 | £54,026 | -8% |
40 Properties |
| 1997 | £58,494 | 19% |
34 Properties |
| 1996 | £47,588 | -0,2% |
34 Properties |
| 1995 | £47,661 | - |
26 Properties |
Property Price per Property Type in Mold East
Here you can find historic sold price data in order to help with your property search.
The average Property Paid Price for specific property types in the last three years are:
| Property Type | Average Sold Price | Sold Properties |
|---|---|---|
| Semi Detached House | £207,490.00 | 38 Semi Detached Houses |
| Detached House | £285,100.00 | 35 Detached Houses |
| Terraced House | £154,118.00 | 24 Terraced Houses |
| Flat | £119,937.00 | 8 Flats |

