Houses for sale & to rent in Esclusham, Wrexham
House Prices in Esclusham
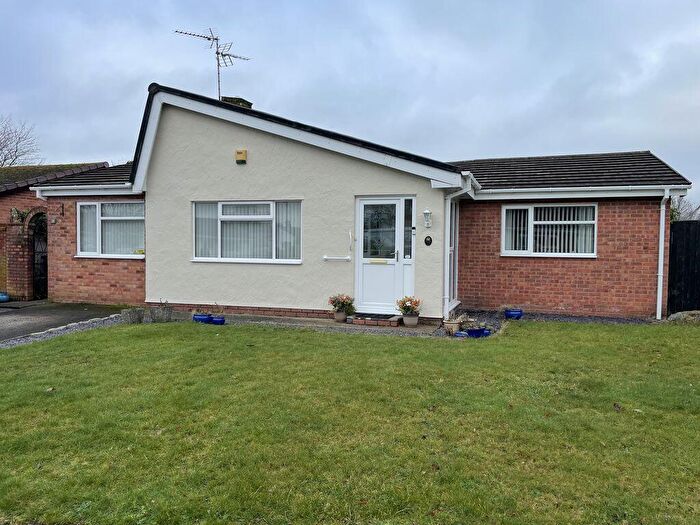
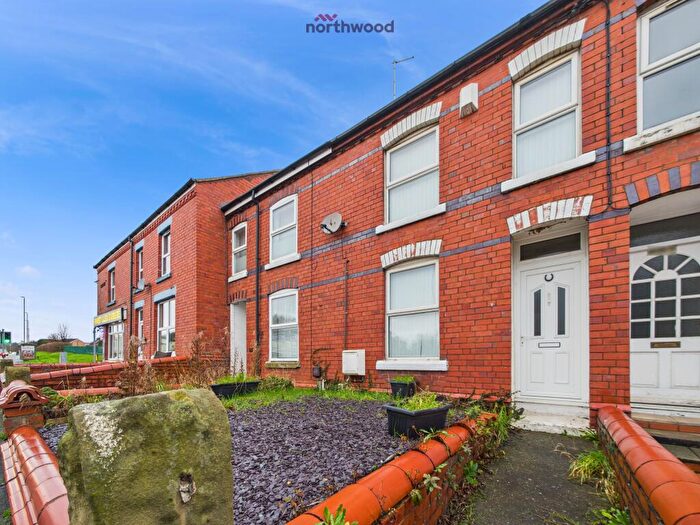
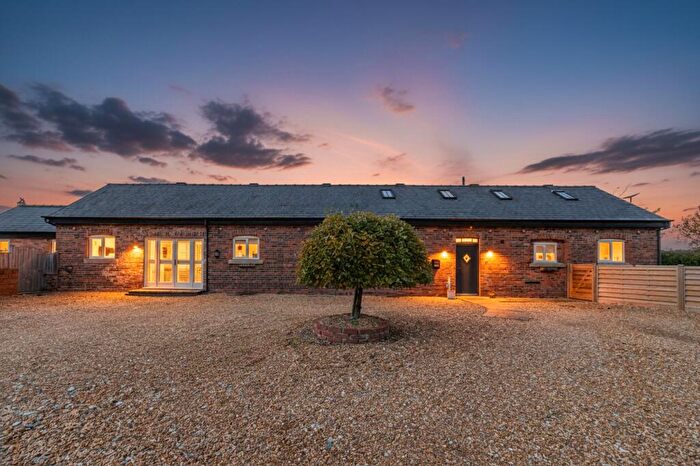
Properties in Esclusham have an average house price of £185,258.00 and had 78 Property Transactions within the last 3 years¹.
Esclusham is an area in Wrexham, Wrecsam - Wrexham with 1,164 households², where the most expensive property was sold for £385,000.00.
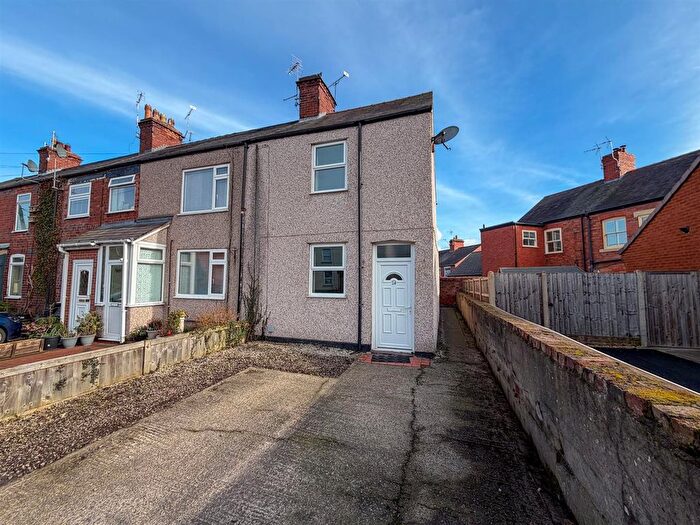
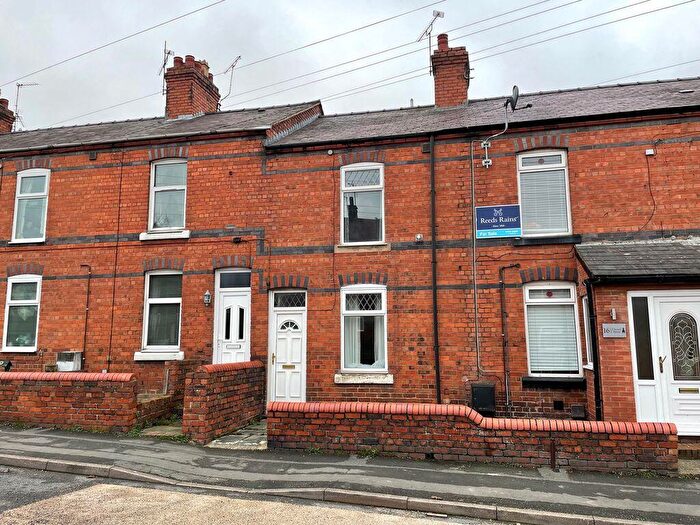
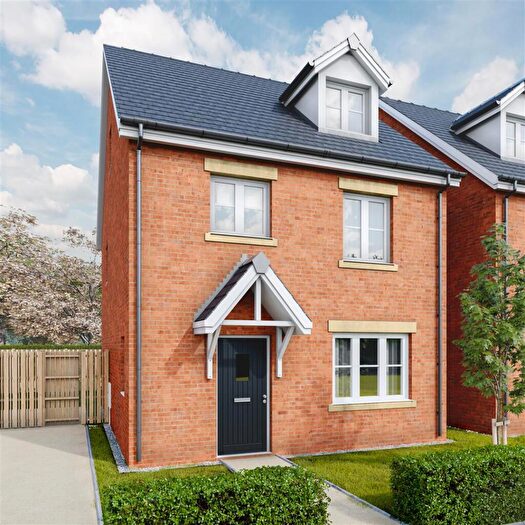
Properties for sale in Esclusham
Roads and Postcodes in Esclusham
Navigate through our locations to find the location of your next house in Esclusham, Wrexham for sale or to rent.
| Streets | Postcodes |
|---|---|
| Amanda Grove | LL14 4AP |
| Bersham Enterprise Centre | LL14 4EG |
| Bersham Road | LL14 4HP LL14 4HS LL14 4HT |
| Birchwood Close | LL14 4DD |
| Brackenwood Close | LL14 4DZ |
| Britannia Close | LL14 4BX |
| Burkitt Street | LL14 4AY |
| Celmar Grove | LL14 4BD |
| Chapel Street | LL14 4AS |
| Chapel Terrace | LL14 4HL |
| Church Street | LL14 4AH LL14 4EE LL14 4EF |
| Colliery Road | LL14 4FG |
| Croesfoel Industrial Estate | LL14 4BJ |
| Ddol | LL14 4HN |
| Eldon Grove | LL14 4BP LL14 4BS LL14 4BW |
| Erddig Close | LL14 4BQ |
| Esless Road | LL14 4DG |
| Fairview | LL14 4HX |
| Ferndale Avenue | LL14 4AL |
| Hedgeway Close | LL14 4EY |
| Henblas Road | LL14 4AA LL14 4AB LL14 4AD |
| Henry Street | LL14 4BY LL14 4DA |
| Heritage Close | LL14 4FE |
| High Street | LL14 4AG |
| Highgrove Close | LL14 4FB |
| Hill Street | LL14 4AT |
| Holmwood Avenue | LL14 4ED |
| James Street | LL14 4AW |
| Kensington Close | LL14 4FA |
| Langdale Avenue | LL14 4AE |
| Laurel Grove | LL14 4HF |
| Maes Y Gwanwyn | LL14 4EB |
| Maplehurst Close | LL14 4HJ |
| Meadow Close | LL14 4HZ |
| Mill Terrace | LL14 4LP |
| Mount Street | LL14 4AU |
| Oakwood Court | LL14 4DQ |
| Old Farm Road | LL14 4DX |
| Old Hall Close | LL14 4DJ |
| Paddock Close | LL14 4EQ |
| Parkend Walk | LL14 4EX |
| Pen Y Ddol | LL14 4HG |
| Pinewood Close | LL14 4DF |
| Plas Angharad | LL14 4DB |
| Poplar Road | LL14 4BA |
| Rosemary Crescent | LL14 4BE |
| Sandringham Close | LL14 4FF |
| School Mews | LL14 4AJ |
| School Street | LL14 4AN |
| Spring Road | LL14 4DY |
| Station Road | LL14 4BB |
| Summerfields | LL14 4EU |
| Thistledown Close | LL14 4EZ |
| Trevor Avenue | LL14 4BT |
| Trinity Close | LL14 4AQ |
| Trinity Street | LL14 4AF |
| Tudor Avenue | LL14 4EA |
| Tudor Court | LL14 4GA |
| Vernon Close | LL14 4AX |
| Vicarage Hill | LL14 4AR |
| West Grove | LL14 4BN |
| Westbourne Drive | LL14 4BU |
| Wilkinson Drive | LL14 4FD |
| Woodland Walks | LL14 4AZ |
| Woodside Court | LL14 4DE |
| Wrexham Road | LL14 4DH LL14 4DL LL14 4DN LL14 4DW LL14 4EJ |
| Wynnstay Crescent | LL14 4BG LL14 4BH LL14 4BL |
| LL14 4HU LL14 4LL LL14 4HR |
Transport near Esclusham
- FAQ
- Price Paid By Year
- Property Type Price
Frequently asked questions about Esclusham
What is the average price for a property for sale in Esclusham?
The average price for a property for sale in Esclusham is £185,258. This amount is 11% lower than the average price in Wrexham. There are 189 property listings for sale in Esclusham.
What streets have the most expensive properties for sale in Esclusham?
The streets with the most expensive properties for sale in Esclusham are Old Hall Close at an average of £311,500, Old Farm Road at an average of £300,000 and Summerfields at an average of £281,375.
What streets have the most affordable properties for sale in Esclusham?
The streets with the most affordable properties for sale in Esclusham are Church Street at an average of £113,100, Trinity Close at an average of £115,000 and Maes Y Gwanwyn at an average of £115,000.
Which train stations are available in or near Esclusham?
Some of the train stations available in or near Esclusham are Wrexham Central, Wrexham General and Gwersyllt.
Property Price Paid in Esclusham by Year
The average sold property price by year was:
| Year | Average Sold Price | Price Change |
Sold Properties
|
|---|---|---|---|
| 2025 | £188,713 | -1% |
22 Properties |
| 2024 | £190,168 | 6% |
27 Properties |
| 2023 | £178,065 | -16% |
29 Properties |
| 2022 | £205,970 | 18% |
35 Properties |
| 2021 | £168,262 | 15% |
37 Properties |
| 2020 | £142,721 | -9% |
25 Properties |
| 2019 | £155,305 | 12% |
44 Properties |
| 2018 | £136,191 | 5% |
34 Properties |
| 2017 | £130,027 | 4% |
40 Properties |
| 2016 | £124,791 | -32% |
25 Properties |
| 2015 | £164,208 | 20% |
41 Properties |
| 2014 | £130,588 | 7% |
38 Properties |
| 2013 | £121,335 | -5% |
30 Properties |
| 2012 | £127,225 | -1% |
20 Properties |
| 2011 | £129,080 | 6% |
26 Properties |
| 2010 | £120,827 | -1% |
26 Properties |
| 2009 | £121,724 | -8% |
27 Properties |
| 2008 | £131,295 | -7% |
35 Properties |
| 2007 | £140,408 | 2% |
55 Properties |
| 2006 | £137,290 | -6% |
56 Properties |
| 2005 | £145,704 | 13% |
38 Properties |
| 2004 | £126,531 | 33% |
55 Properties |
| 2003 | £85,215 | 15% |
43 Properties |
| 2002 | £72,540 | 23% |
66 Properties |
| 2001 | £55,716 | -2% |
53 Properties |
| 2000 | £56,598 | -1% |
54 Properties |
| 1999 | £56,893 | -13% |
79 Properties |
| 1998 | £64,544 | 8% |
56 Properties |
| 1997 | £59,703 | 26% |
71 Properties |
| 1996 | £44,297 | 7% |
36 Properties |
| 1995 | £41,403 | - |
27 Properties |
Property Price per Property Type in Esclusham
Here you can find historic sold price data in order to help with your property search.
The average Property Paid Price for specific property types in the last three years are:
| Property Type | Average Sold Price | Sold Properties |
|---|---|---|
| Semi Detached House | £172,990.00 | 27 Semi Detached Houses |
| Detached House | £262,565.00 | 22 Detached Houses |
| Terraced House | £144,885.00 | 23 Terraced Houses |
| Flat | £111,766.00 | 6 Flats |

