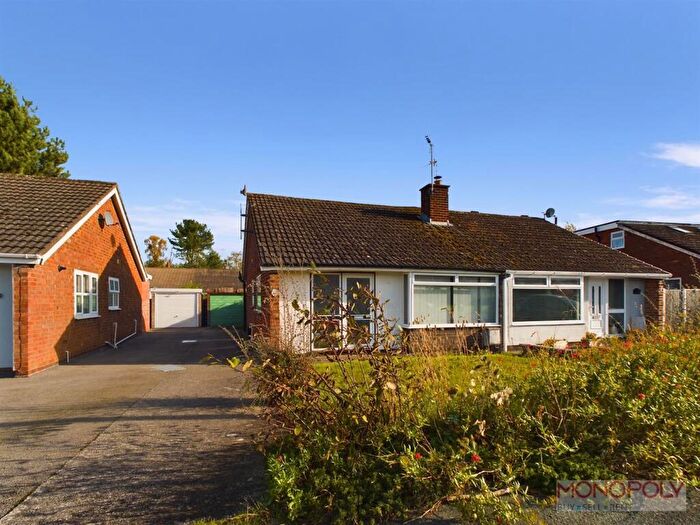
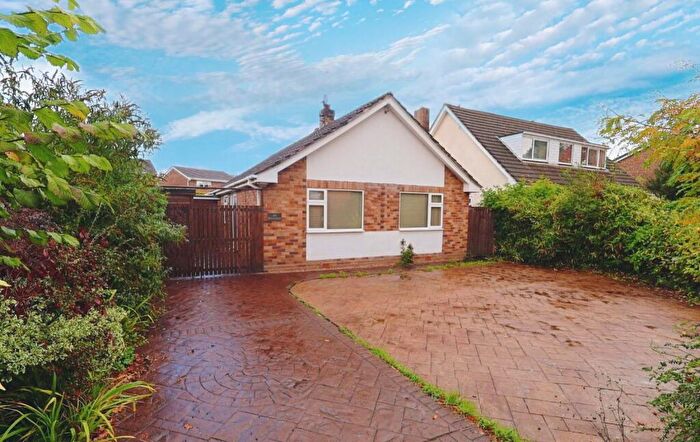
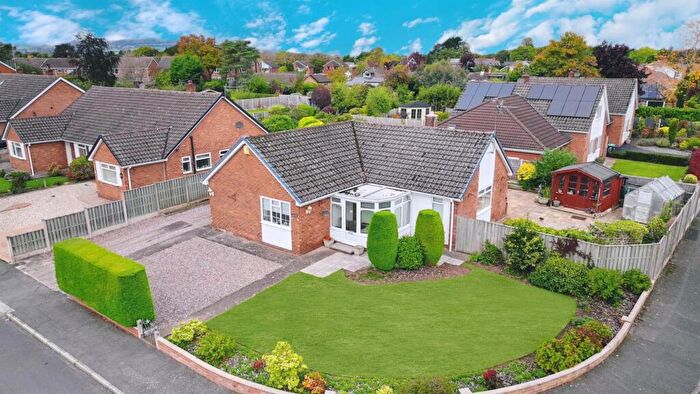
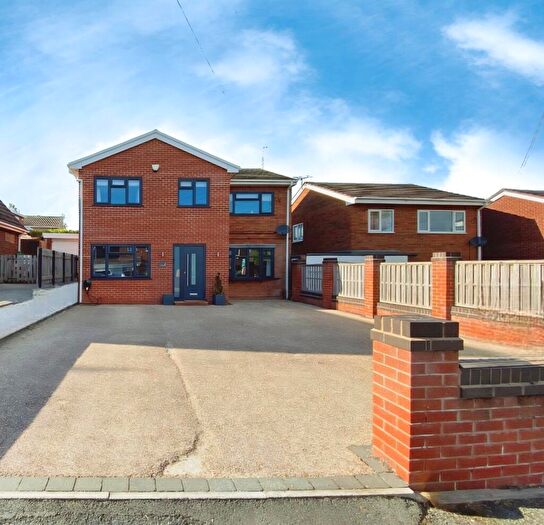
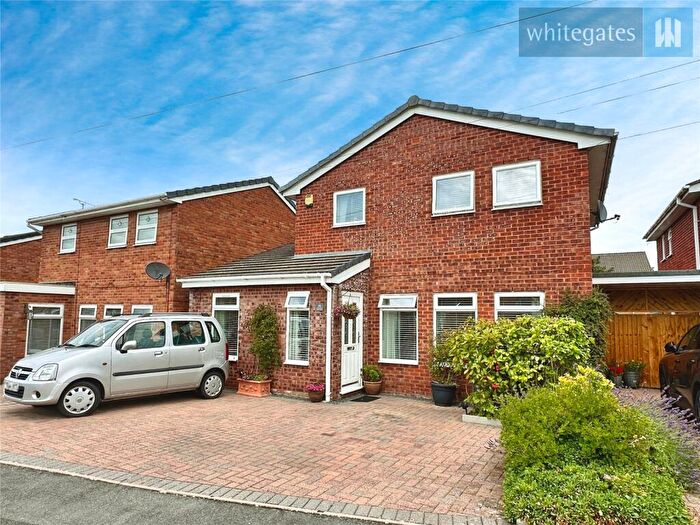
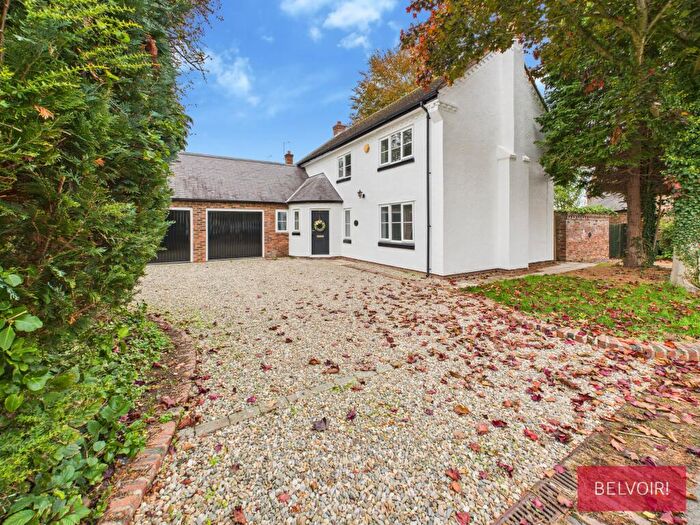
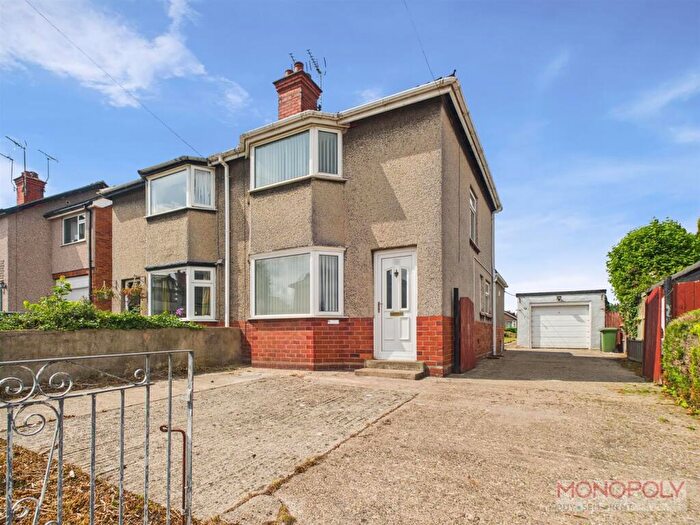
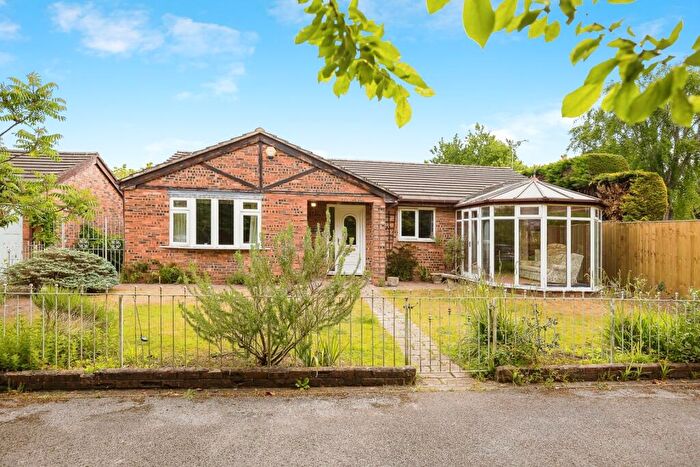
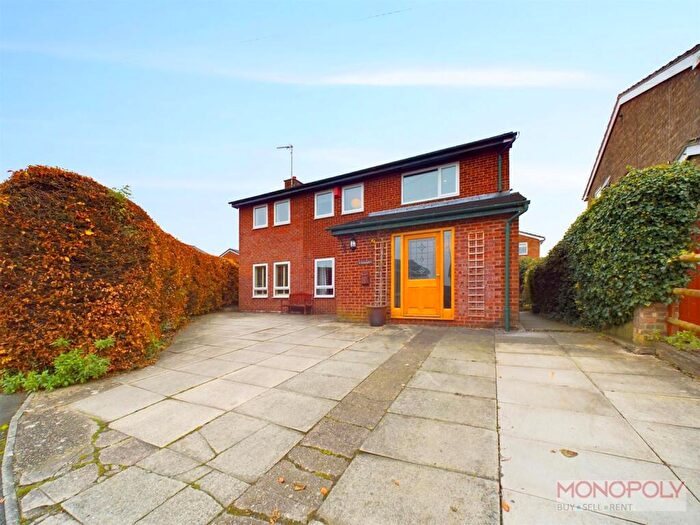
Houses for sale & to rent in Marford And Hoseley, Wrexham
House Prices in Marford And Hoseley
Properties in Marford And Hoseley have an average house price of £422,767.00 and had 70 Property Transactions within the last 3 years¹.
Marford And Hoseley is an area in Wrexham, Wrecsam - Wrexham with 945 households², where the most expensive property was sold for £1,300,000.00.
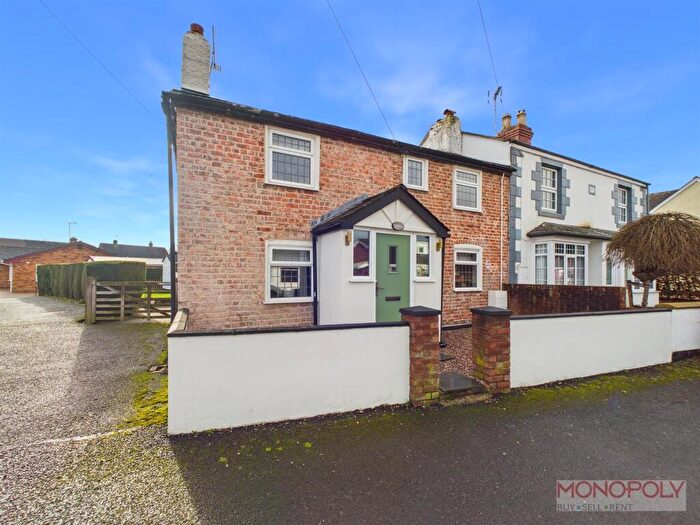
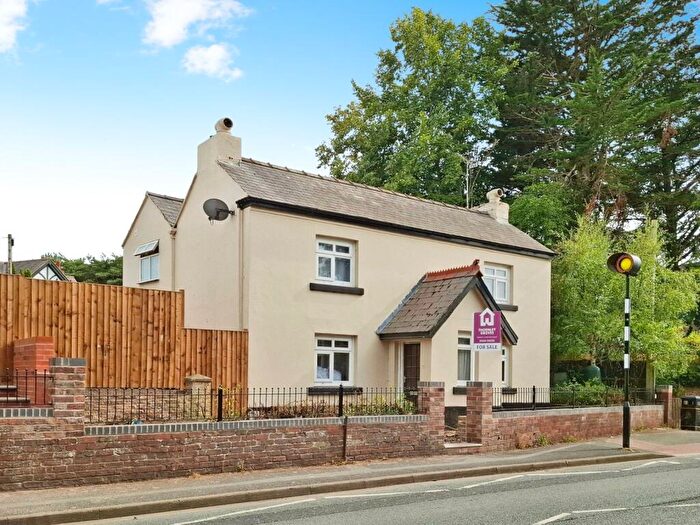
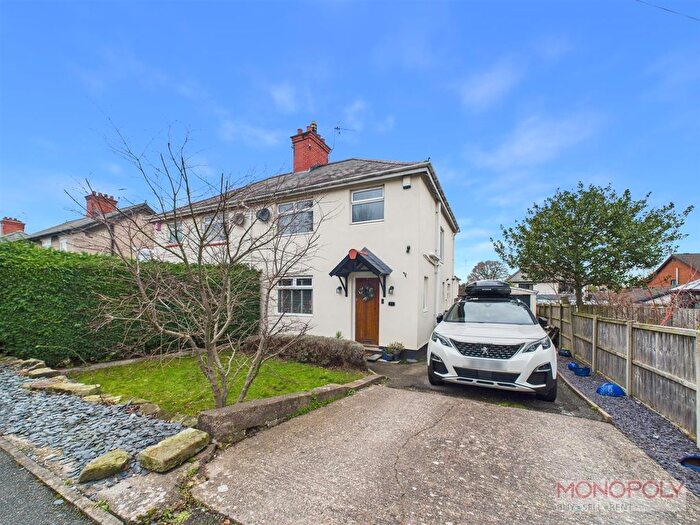
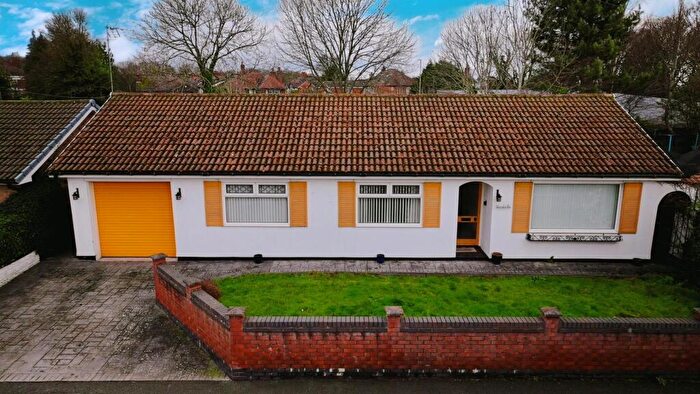
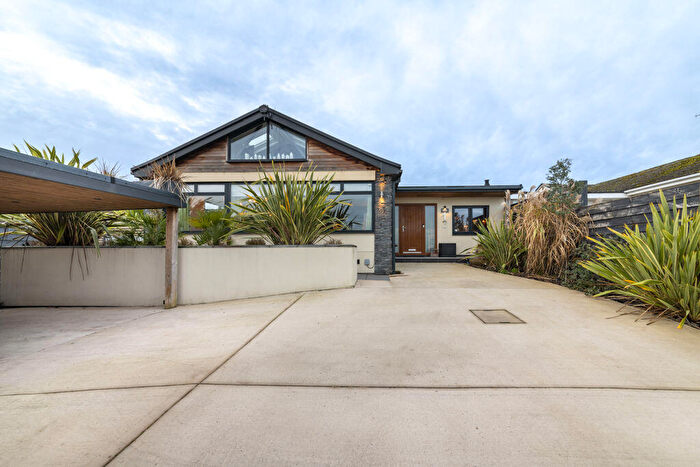
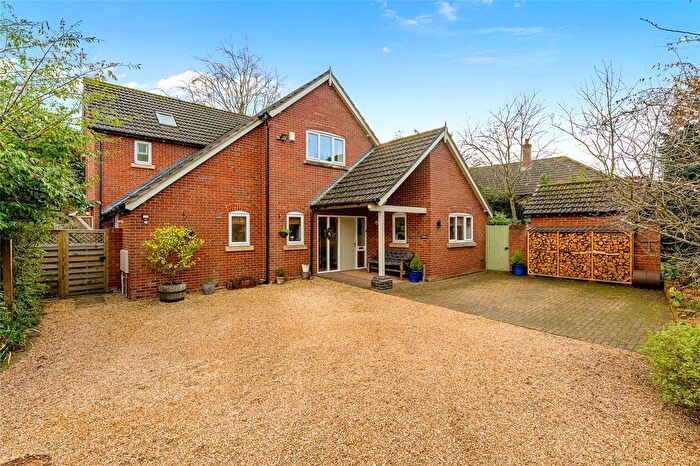
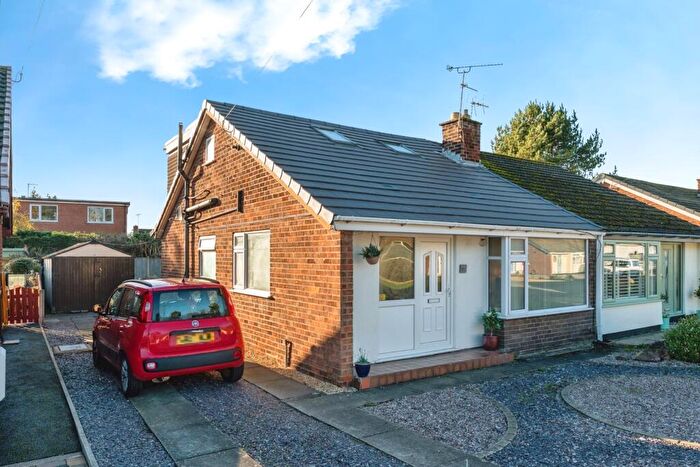
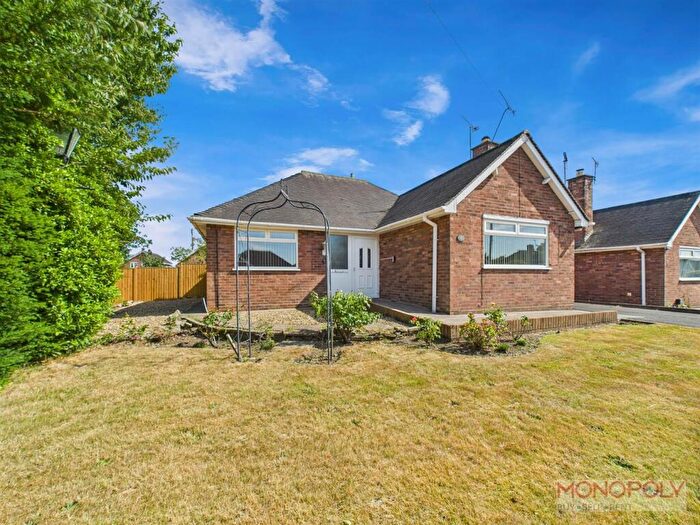
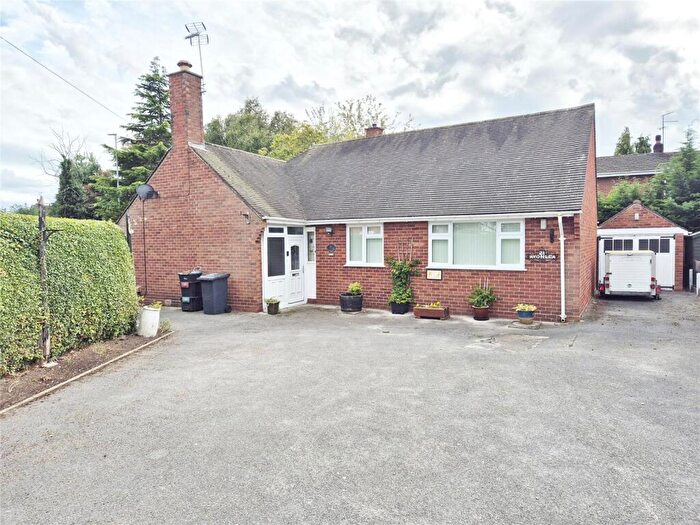
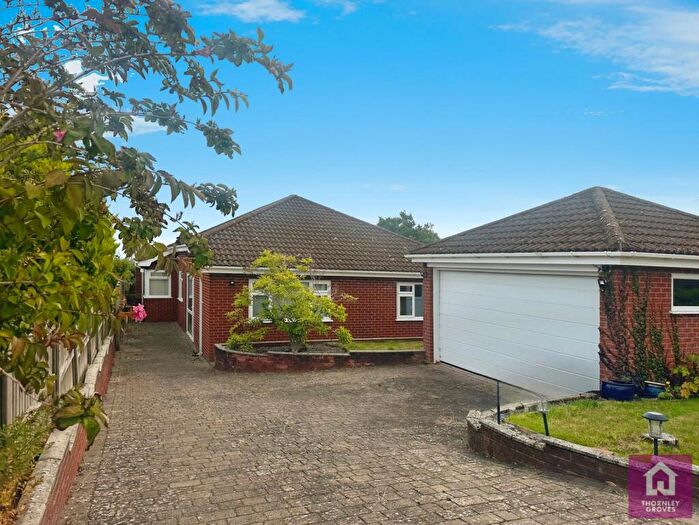
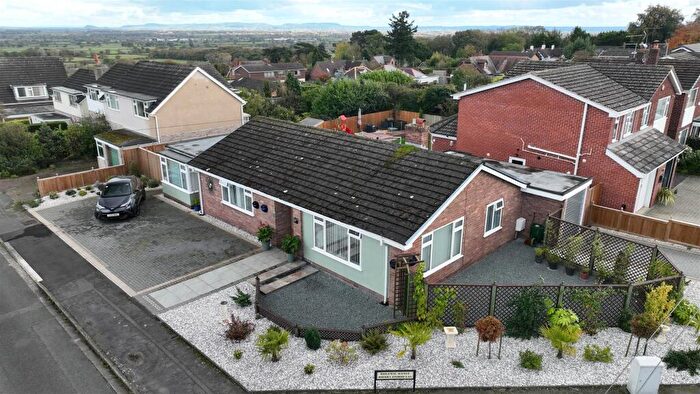
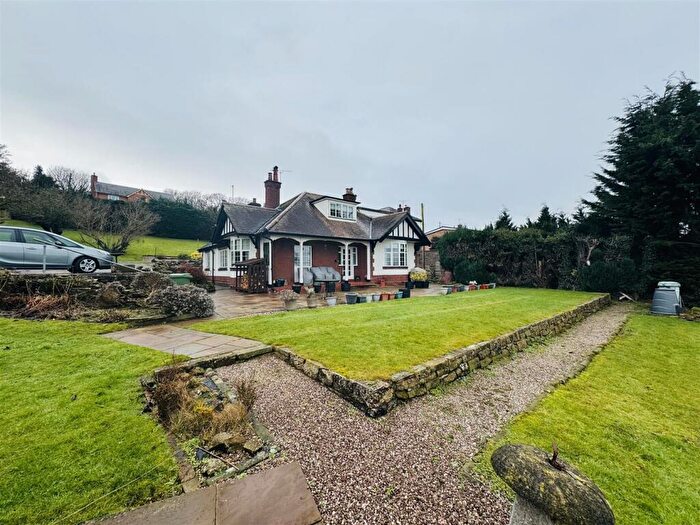
Properties for sale in Marford And Hoseley
Roads and Postcodes in Marford And Hoseley
Navigate through our locations to find the location of your next house in Marford And Hoseley, Wrexham for sale or to rent.
| Streets | Postcodes |
|---|---|
| Beech Lane | LL12 8TQ LL12 8TB |
| Belgrave Court | LL12 8PN |
| Birch Drive | LL12 8YZ |
| Blackthorn Close | LL12 8LB |
| Bramble Close | LL12 8LU |
| Cavendish Close | LL12 8ND |
| Cedar Close | LL12 8XR |
| Chester Road | LL12 8PA LL12 8SF |
| Claypit Lane | LL12 8PB |
| Cox Lane | LL12 0BH |
| Eaton View | LL12 8YB |
| Elder Close | LL12 8XL |
| Eyton Grange | LL12 8YN |
| Farriers Walk | LL12 8PH |
| Gorse Crescent | LL12 8LZ |
| Hawthorn Road | LL12 8XJ |
| Hayfield Drive | LL12 8YJ |
| Hillock Lane | LL12 8YG LL12 8YL |
| Hilltop Drive | LL12 8SR |
| Horsley | LL12 8YF |
| Hoseley Lane | LL12 8YE LL12 8YD |
| Juniper Close | LL12 8XH |
| Kathen Court | LL12 8YP |
| Laurel Close | LL12 8XQ |
| Maple Close | LL12 8XX LL12 8XY |
| Marford Heights | LL12 8TJ |
| Marford Hill | LL12 8SW LL12 8SX LL12 8SY LL12 8TA LL12 8SL LL12 8TD |
| Mayflower Drive | LL12 8LD |
| Meadows View | LL12 8LR LL12 8LS |
| Myrtle Road | LL12 8LY |
| Oak Drive | LL12 8XT |
| Pant Lane | LL12 8SE LL12 8SH |
| Park Lane | LL12 0BL |
| Pistyll Hill | LL12 8LE |
| Poplar Drive | LL12 8XN |
| Quarry Brow | LL12 8SJ |
| Raynham Avenue | LL12 8YY |
| Ridgeway Avenue | LL12 8ST |
| Sandrock Road | LL12 8LT |
| Silverbirch Drive | LL12 8YX |
| Springfield Lane | LL12 8TF |
| Stancliffe Avenue | LL12 8LN LL12 8LP LL12 8LW |
| Sunnyridge Avenue | LL12 8TE |
| Sycamore Drive | LL12 8XU |
| The Spinney | LL12 8TG |
| Thornleigh Drive | LL12 8YQ |
| Village Walks | LL12 8SZ |
| Willow Drive | LL12 8XS |
| Woodlands Road | LL12 8SP |
| Woodridge Avenue | LL12 8SS LL12 8SU |
| Wychwood Close | LL12 8TX |
| Wynnstay Lane | LL12 8LF LL12 8LG LL12 8LH LL12 8LL LL12 8YA LL12 8LA |
Transport near Marford And Hoseley
-
Gwersyllt Station
-
Cefn-Y-Bedd Station
-
Wrexham General Station
-
Caergwrle Station
-
Wrexham Central Station
-
Hope (Clwyd) Station
- FAQ
- Price Paid By Year
- Property Type Price
Frequently asked questions about Marford And Hoseley
What is the average price for a property for sale in Marford And Hoseley?
The average price for a property for sale in Marford And Hoseley is £422,767. This amount is 104% higher than the average price in Wrexham. There are 111 property listings for sale in Marford And Hoseley.
What streets have the most expensive properties for sale in Marford And Hoseley?
The streets with the most expensive properties for sale in Marford And Hoseley are Eyton Grange at an average of £870,000, Quarry Brow at an average of £855,000 and Pistyll Hill at an average of £675,000.
What streets have the most affordable properties for sale in Marford And Hoseley?
The streets with the most affordable properties for sale in Marford And Hoseley are Blackthorn Close at an average of £200,000, Bramble Close at an average of £235,750 and Hilltop Drive at an average of £285,000.
Which train stations are available in or near Marford And Hoseley?
Some of the train stations available in or near Marford And Hoseley are Gwersyllt, Cefn-Y-Bedd and Wrexham General.
Property Price Paid in Marford And Hoseley by Year
The average sold property price by year was:
| Year | Average Sold Price | Price Change |
Sold Properties
|
|---|---|---|---|
| 2025 | £454,421 | 13% |
19 Properties |
| 2024 | £397,035 | -8% |
28 Properties |
| 2023 | £427,945 | -5% |
23 Properties |
| 2022 | £448,652 | 6% |
30 Properties |
| 2021 | £419,569 | 19% |
42 Properties |
| 2020 | £340,367 | -2% |
26 Properties |
| 2019 | £347,947 | 0,2% |
23 Properties |
| 2018 | £347,110 | 19% |
42 Properties |
| 2017 | £281,381 | -22% |
35 Properties |
| 2016 | £343,295 | 11% |
37 Properties |
| 2015 | £305,185 | -1% |
31 Properties |
| 2014 | £307,893 | 10% |
39 Properties |
| 2013 | £277,587 | 8% |
16 Properties |
| 2012 | £254,652 | -19% |
30 Properties |
| 2011 | £301,923 | -5% |
13 Properties |
| 2010 | £315,806 | 22% |
24 Properties |
| 2009 | £247,342 | -33% |
19 Properties |
| 2008 | £329,156 | -1% |
16 Properties |
| 2007 | £333,971 | 16% |
41 Properties |
| 2006 | £279,822 | 5% |
33 Properties |
| 2005 | £266,612 | 18% |
31 Properties |
| 2004 | £218,938 | -5% |
36 Properties |
| 2003 | £228,797 | 11% |
41 Properties |
| 2002 | £203,124 | 27% |
61 Properties |
| 2001 | £147,660 | 6% |
58 Properties |
| 2000 | £139,375 | 22% |
43 Properties |
| 1999 | £108,266 | 4% |
62 Properties |
| 1998 | £103,438 | 2% |
33 Properties |
| 1997 | £101,801 | 18% |
42 Properties |
| 1996 | £83,581 | 1% |
40 Properties |
| 1995 | £82,659 | - |
33 Properties |
Property Price per Property Type in Marford And Hoseley
Here you can find historic sold price data in order to help with your property search.
The average Property Paid Price for specific property types in the last three years are:
| Property Type | Average Sold Price | Sold Properties |
|---|---|---|
| Semi Detached House | £307,884.00 | 13 Semi Detached Houses |
| Detached House | £489,301.00 | 49 Detached Houses |
| Terraced House | £201,937.00 | 8 Terraced Houses |

