
Properties for sale in FY8
Lytham St. Annes, Moss Side
- Info
- Price Paid By Year
- Property Type Price
- Transport
House Prices in FY8
Properties in FY8 have an average house price of £271,076.00 and had 2555 Property Transactions within the last 3 years.
The most expensive property was sold for £2,050,000.00.
Property Price Paid in FY8 by Year
The average sold property price by year was:
| Year | Average Sold Price | Sold Properties |
|---|---|---|
| 2026 | £286,473.00 | 50 Properties |
| 2025 | £283,861.00 | 796 Properties |
| 2024 | £268,235.00 | 893 Properties |
| 2023 | £260,771.00 | 816 Properties |
| 2022 | £270,985.00 | 1,079 Properties |
| 2021 | £255,173.00 | 1,275 Properties |
| 2020 | £250,472.00 | 907 Properties |
| 2019 | £228,860.00 | 1,037 Properties |
| 2018 | £224,275.00 | 1,000 Properties |
| 2017 | £232,267.00 | 1,084 Properties |
| 2016 | £212,389.00 | 1,186 Properties |
| 2015 | £209,661.00 | 987 Properties |
| 2014 | £205,264.00 | 1,015 Properties |
| 2013 | £204,479.00 | 880 Properties |
| 2012 | £189,013.00 | 648 Properties |
| 2011 | £200,663.00 | 671 Properties |
| 2010 | £206,599.00 | 709 Properties |
| 2009 | £197,562.00 | 778 Properties |
| 2008 | £213,935.00 | 773 Properties |
| 2007 | £213,245.00 | 1,422 Properties |
| 2006 | £205,602.00 | 1,452 Properties |
| 2005 | £193,493.00 | 1,033 Properties |
| 2004 | £175,624.00 | 1,537 Properties |
| 2003 | £141,121.00 | 1,539 Properties |
| 2002 | £123,135.00 | 1,614 Properties |
| 2001 | £98,386.00 | 1,503 Properties |
| 2000 | £91,611.00 | 1,274 Properties |
| 1999 | £82,302.00 | 1,289 Properties |
| 1998 | £74,943.00 | 1,029 Properties |
| 1997 | £74,579.00 | 1,232 Properties |
| 1996 | £66,690.00 | 969 Properties |
| 1995 | £64,382.00 | 666 Properties |
Property Price per Property Type in FY8
Here you can find historic sold price data in order to help with your property search.
The average Property Paid Price for specific property types in the last three years are:
| Property Type | Average Sold Price | Sold Properties |
|---|---|---|
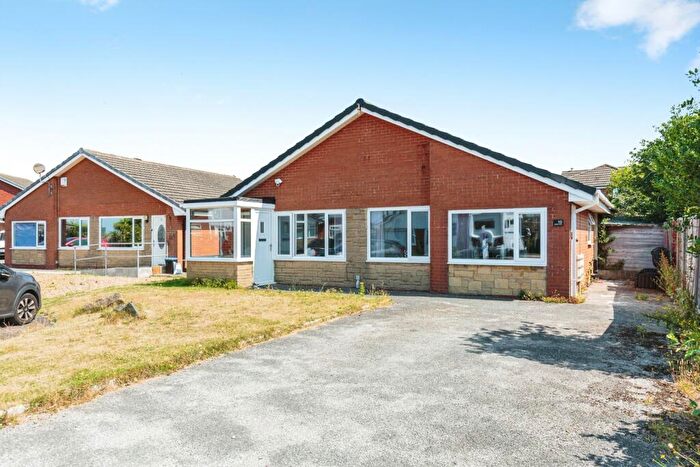
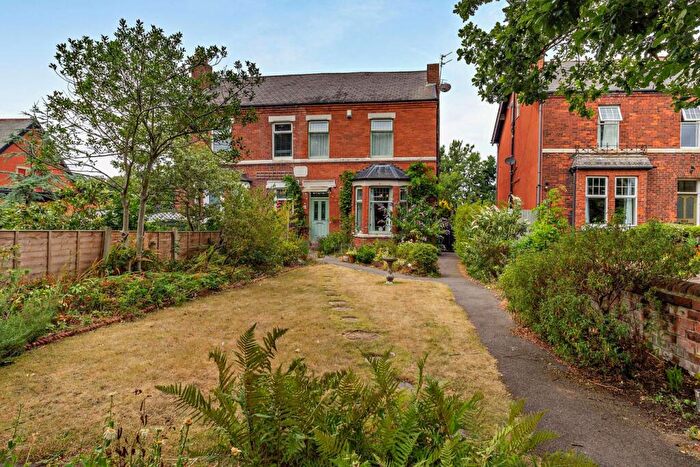
| Semi Detached House | £277,432.00 | 710 Semi Detached Houses |
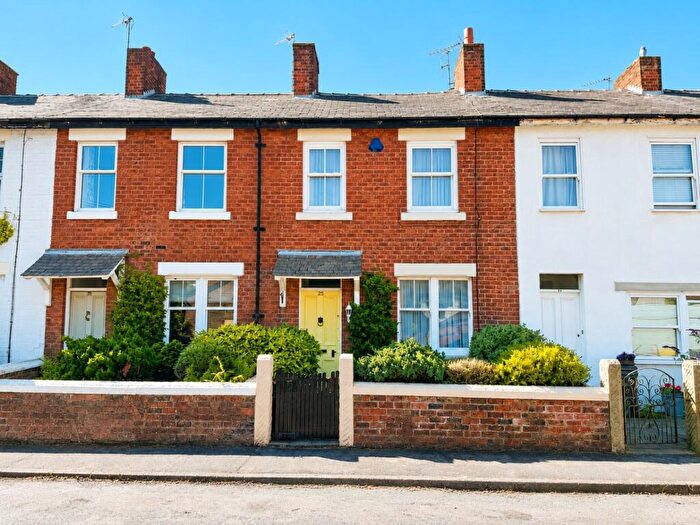
| Terraced House | £253,805.00 | 412 Terraced Houses |
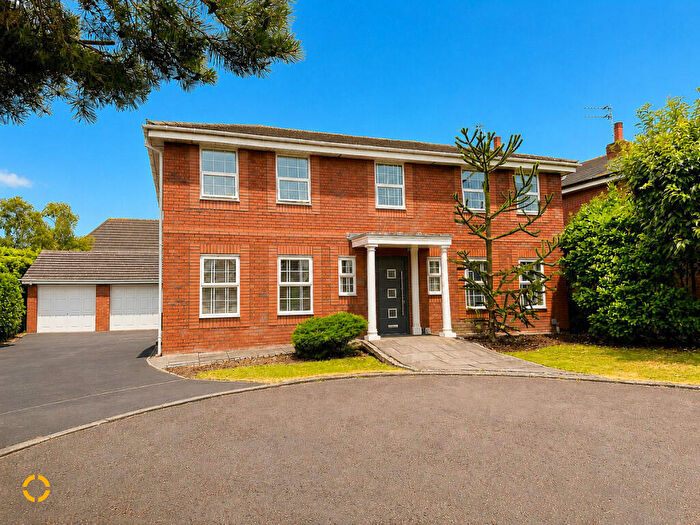
| Detached House | £419,410.00 | 607 Detached Houses |
| Flat | £165,222.00 | 826 Flats |

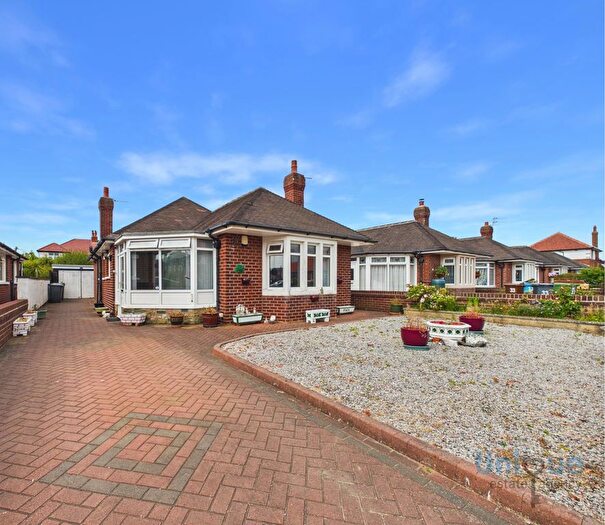
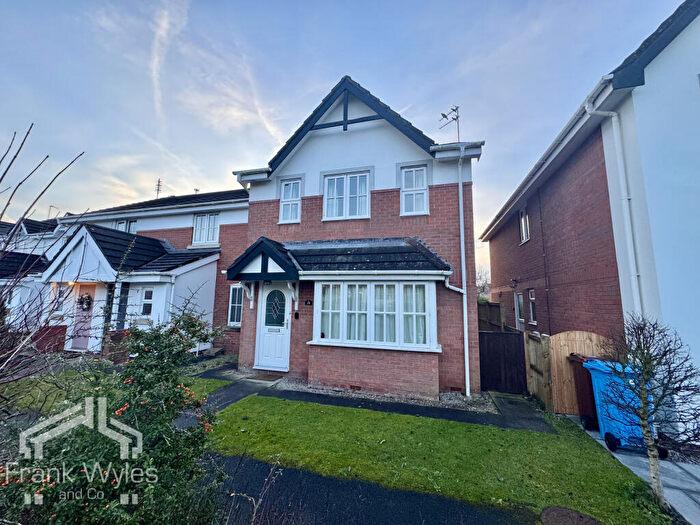
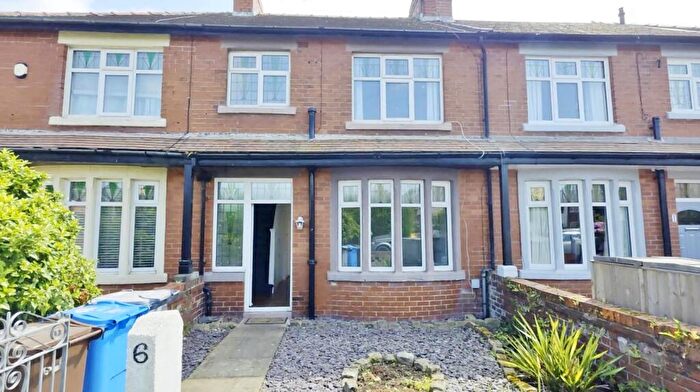
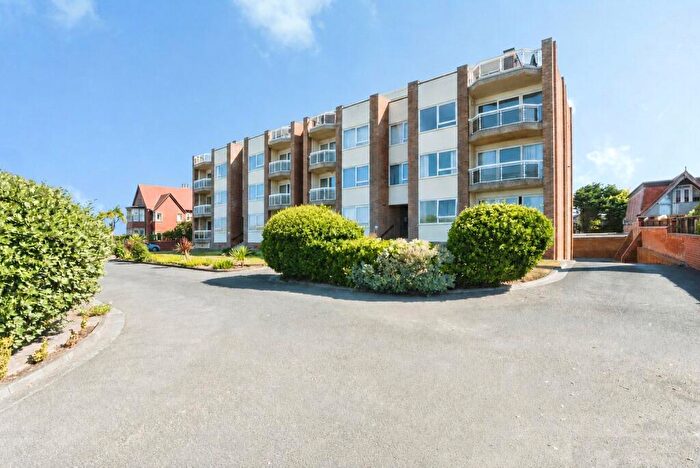
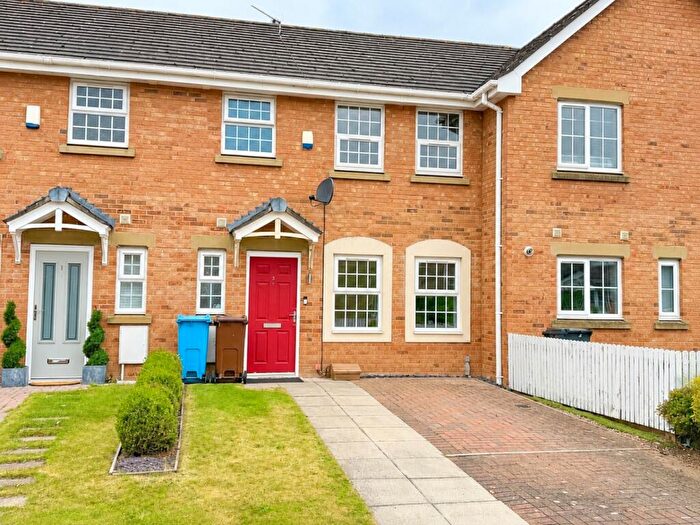
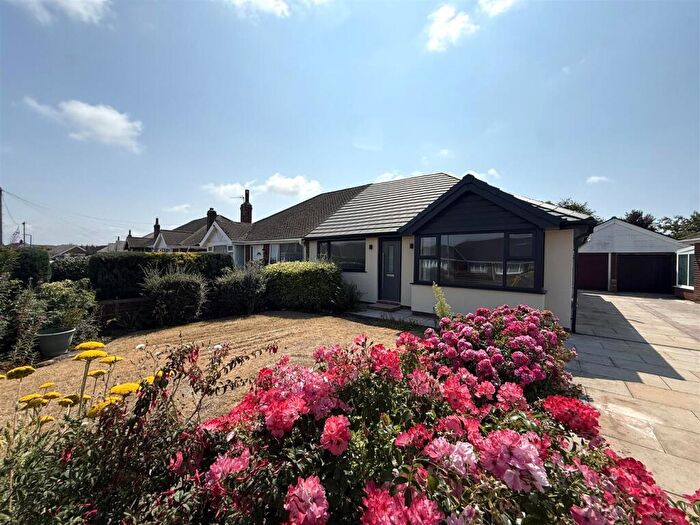
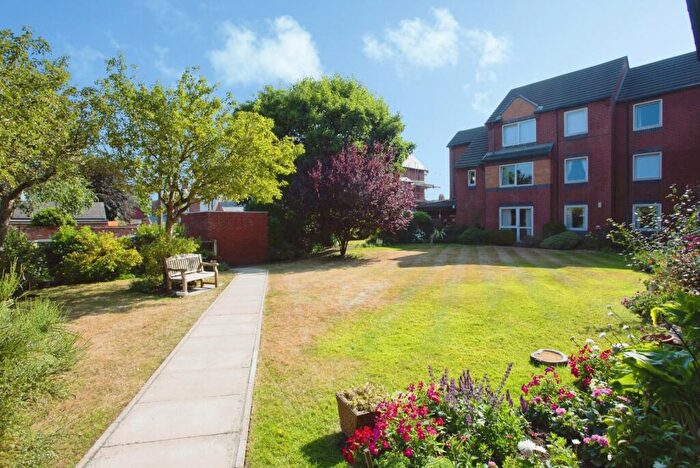
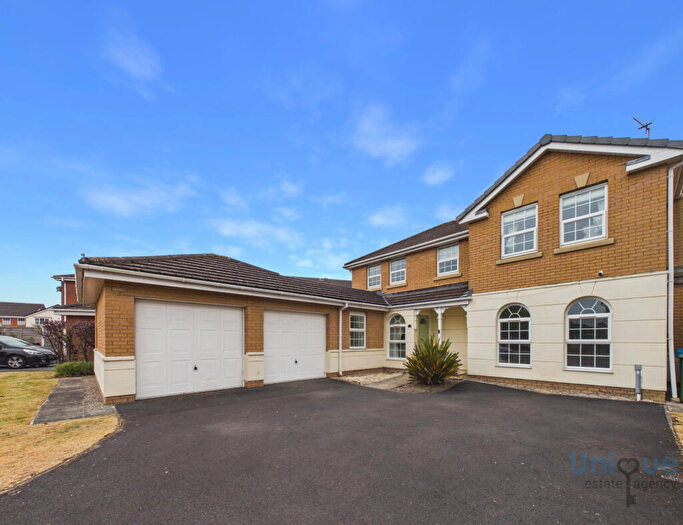
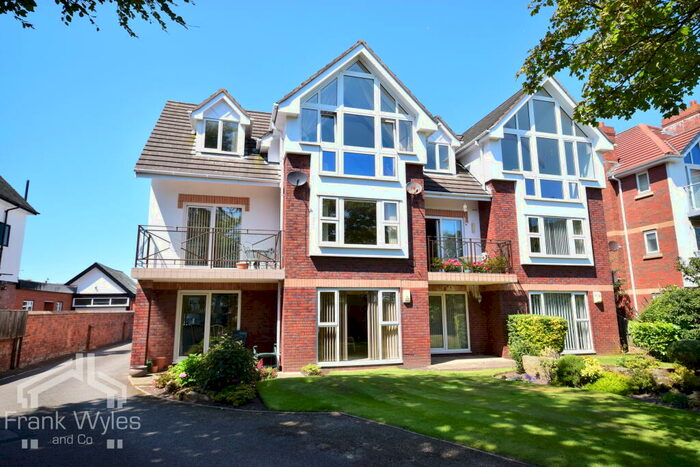
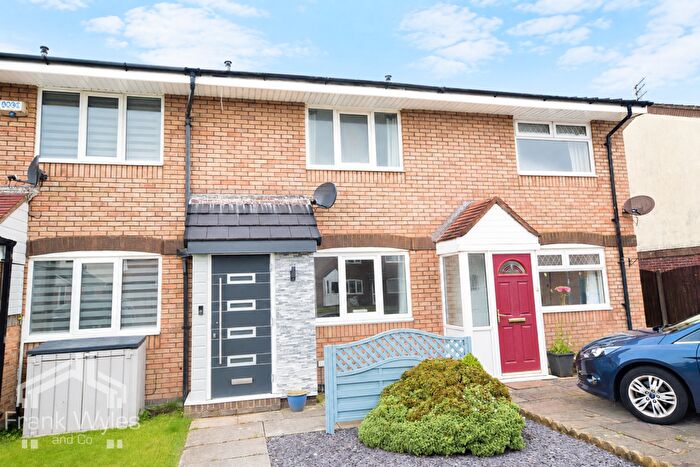
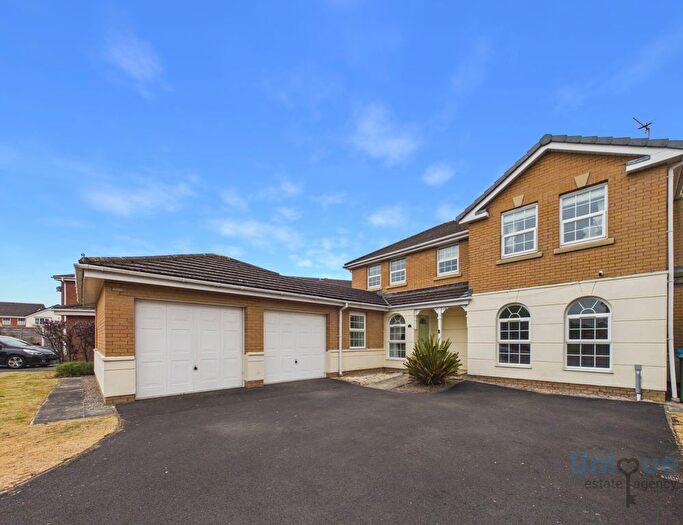
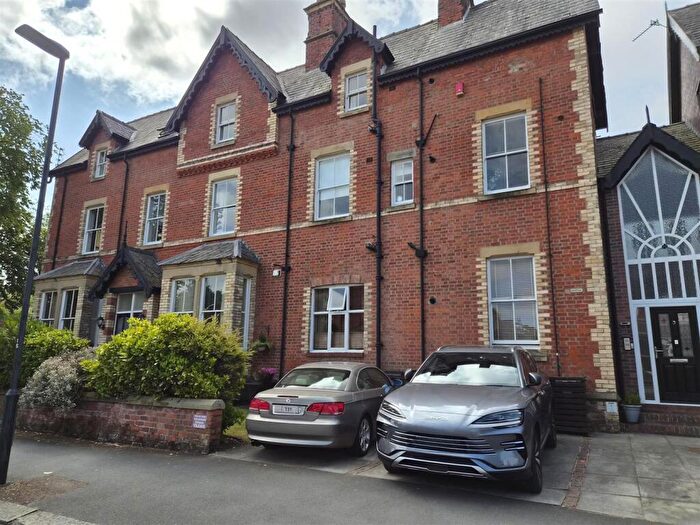
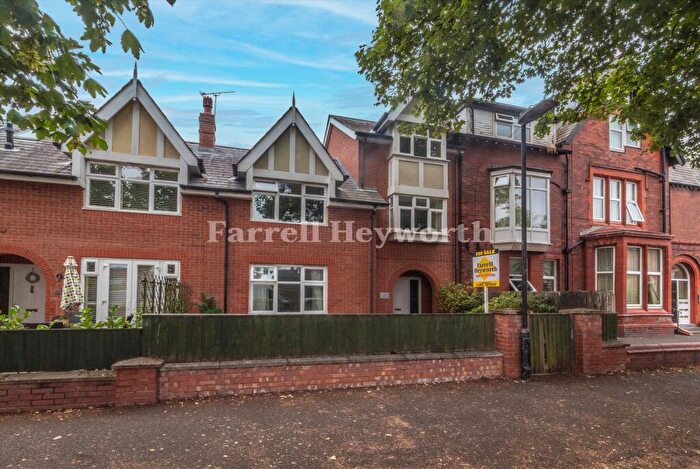
Houses and Flats for sale in FY8, Lytham St. Annes, Moss Side
There are 605 results. Property prices in FY8 range from £50k to £5.5M with an average price of £425k.

![]()
If you are looking to sell your house, let it out, or receive a property valuation, an expert can help you.
Click the button below to get started.

Frequently Asked Questions about FY8
What is the average price for a property for sale in FY8?
The average price for a property for sale in FY8 is £271,076. There are 605 property listings for sale in FY8.
Which areas are included in the FY8 postcode district?
The main areas within FY8 include Lytham St. Annes and Moss Side.
What are the most common property types in FY8?
The most common property types in FY8 are Flats, Semi Detached Houses, Detached Houses and Terraced Houses.
What has been the average sold property price in FY8 over the last three years?
Flats in FY8 have an average sold price of £165,222, while Semi Detached Houses have an average of £277,432. Detached Houses have an average of £419,410 and Terraced Houses have an average of £253,805. The average sold property price in FY8 over the last three years is approximately £279,523.
Which train stations are available in FY8?
The train stations available in FY8 are Ansdell and Fairhaven Station, Lytham Station, Moss Side Station, Squires Gate Station and St.Annes-On-The-Sea Station..