
Properties for sale in FY2
Bispham
- Info
- Price Paid By Year
- Property Type Price
- Transport
House Prices in FY2
Properties in FY2 have an average house price of £152,910.00 and had 1329 Property Transactions within the last 3 years.
The most expensive property was sold for £1,300,000.00.
Property Price Paid in FY2 by Year
The average sold property price by year was:
| Year | Average Sold Price | Sold Properties |
|---|---|---|
| 2026 | £174,467.00 | 26 Properties |
| 2025 | £159,052.00 | 420 Properties |
| 2024 | £150,913.00 | 439 Properties |
| 2023 | £147,812.00 | 444 Properties |
| 2022 | £155,836.00 | 532 Properties |
| 2021 | £143,983.00 | 600 Properties |
| 2020 | £136,315.00 | 372 Properties |
| 2019 | £125,766.00 | 417 Properties |
| 2018 | £124,617.00 | 490 Properties |
| 2017 | £127,081.00 | 449 Properties |
| 2016 | £121,381.00 | 417 Properties |
| 2015 | £119,839.00 | 429 Properties |
| 2014 | £116,702.00 | 392 Properties |
| 2013 | £112,114.00 | 331 Properties |
| 2012 | £110,131.00 | 246 Properties |
| 2011 | £112,754.00 | 275 Properties |
| 2010 | £123,050.00 | 257 Properties |
| 2009 | £123,803.00 | 274 Properties |
| 2008 | £135,307.00 | 275 Properties |
| 2007 | £142,937.00 | 630 Properties |
| 2006 | £138,494.00 | 741 Properties |
| 2005 | £133,929.00 | 656 Properties |
| 2004 | £119,845.00 | 692 Properties |
| 2003 | £96,683.00 | 724 Properties |
| 2002 | £75,829.00 | 832 Properties |
| 2001 | £66,993.00 | 781 Properties |
| 2000 | £60,574.00 | 617 Properties |
| 1999 | £54,169.00 | 567 Properties |
| 1998 | £51,651.00 | 526 Properties |
| 1997 | £48,889.00 | 485 Properties |
| 1996 | £47,779.00 | 447 Properties |
| 1995 | £47,528.00 | 438 Properties |
Property Price per Property Type in FY2
Here you can find historic sold price data in order to help with your property search.
The average Property Paid Price for specific property types in the last three years are:
| Property Type | Average Sold Price | Sold Properties |
|---|---|---|
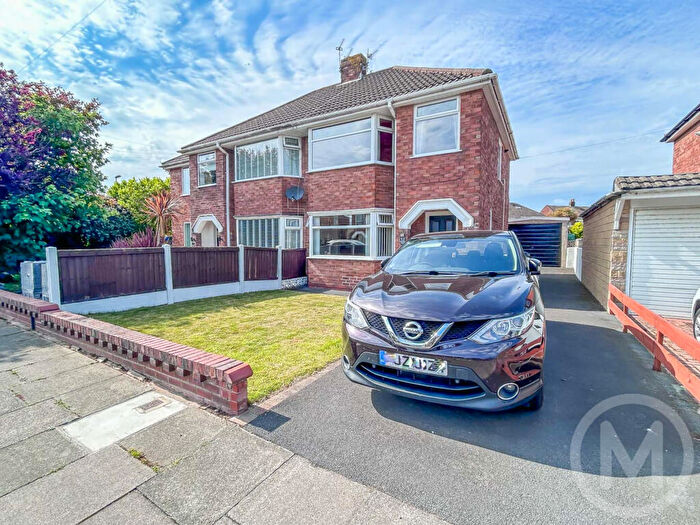
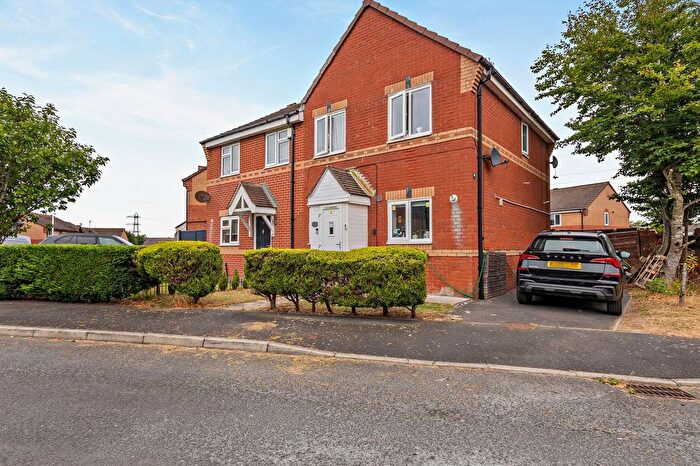
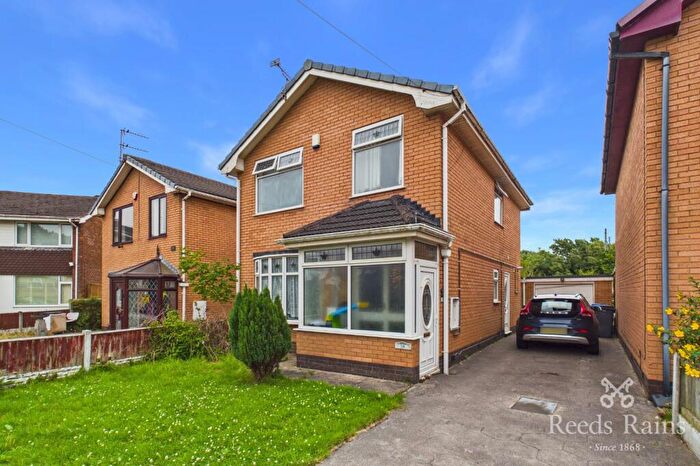
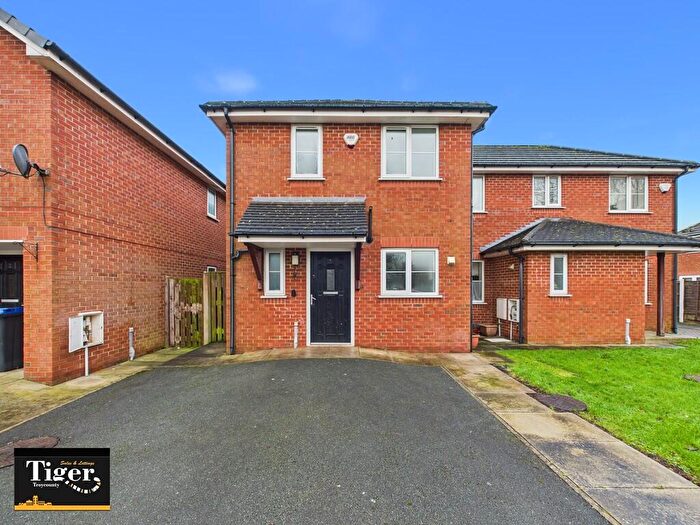
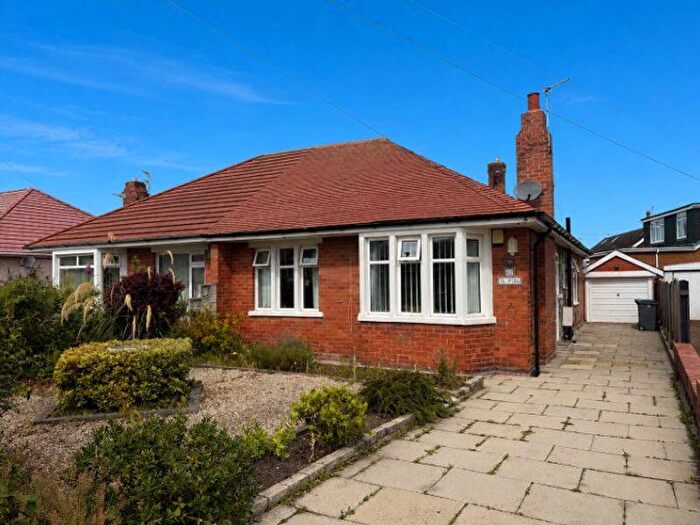
| Semi Detached House | £161,159.00 | 698 Semi Detached Houses |
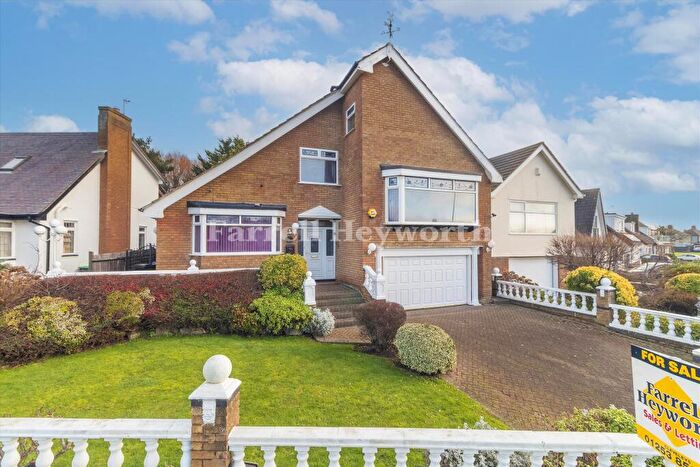
| Detached House | £246,568.00 | 113 Detached Houses |
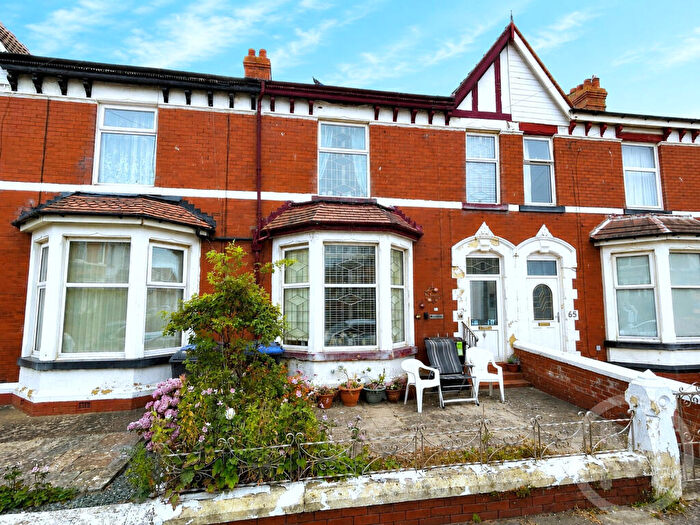
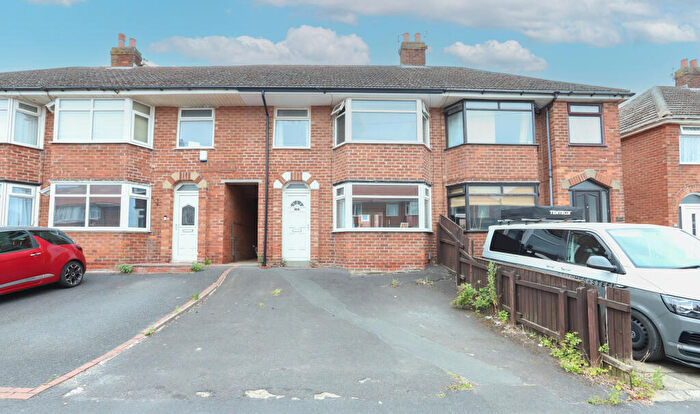
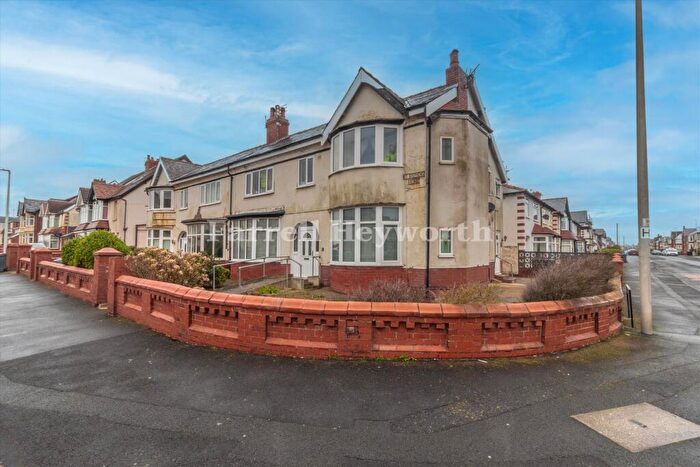
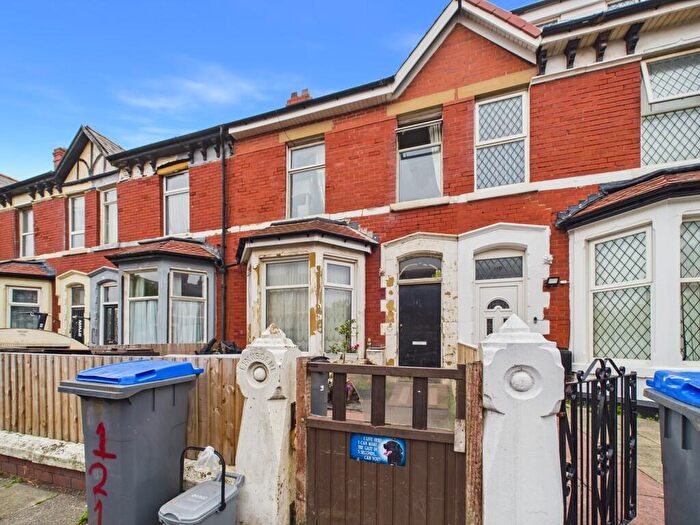
| Terraced House | £136,212.00 | 355 Terraced Houses |
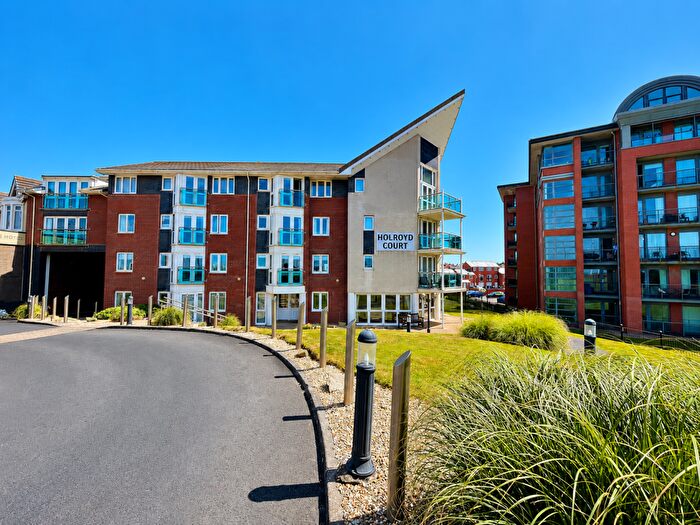
| Flat | £89,023.00 | 163 Flats |
Transport near FY2

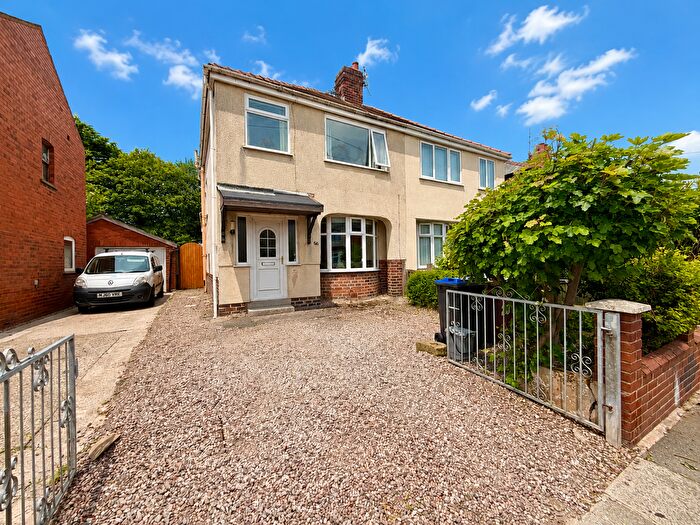
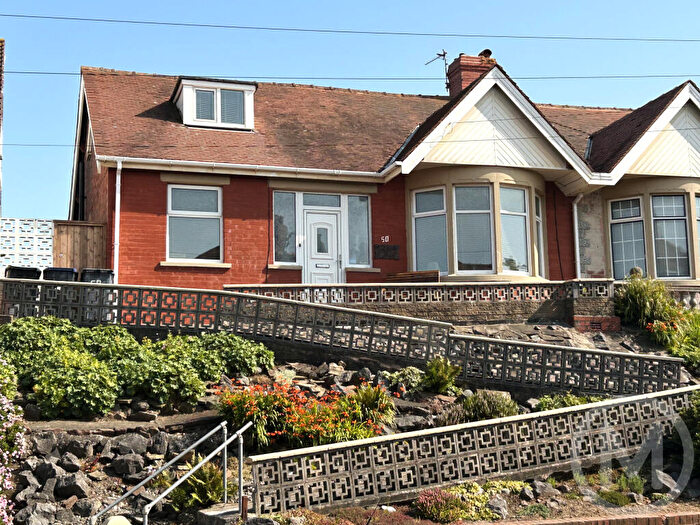
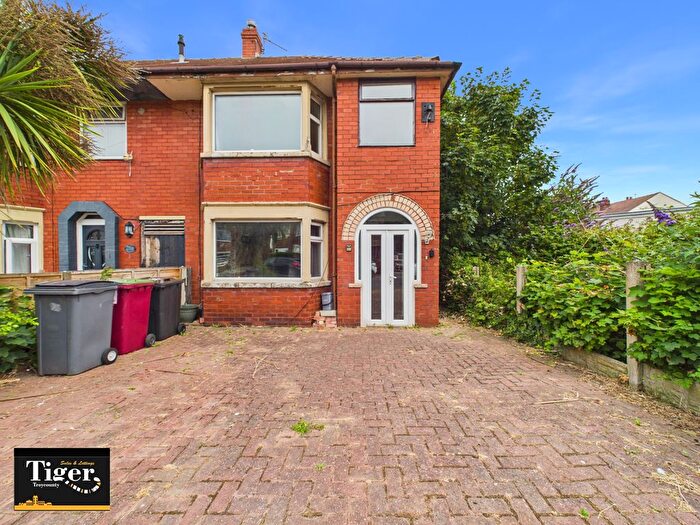
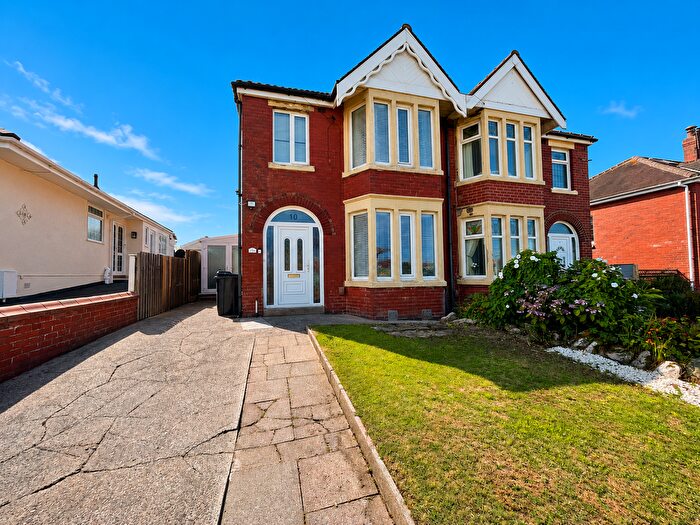
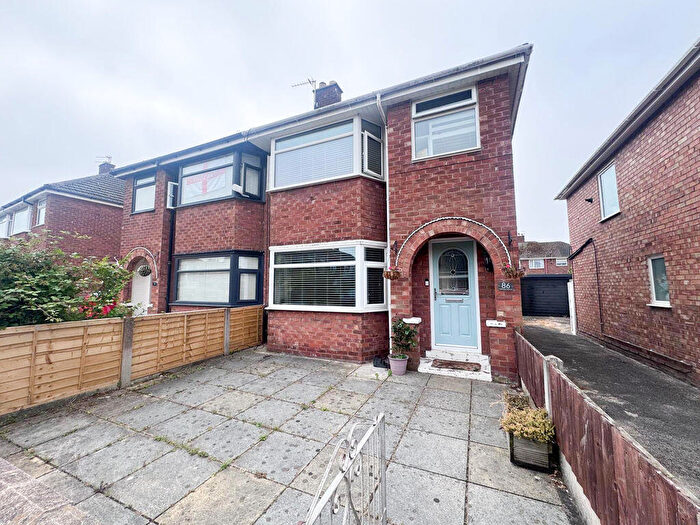
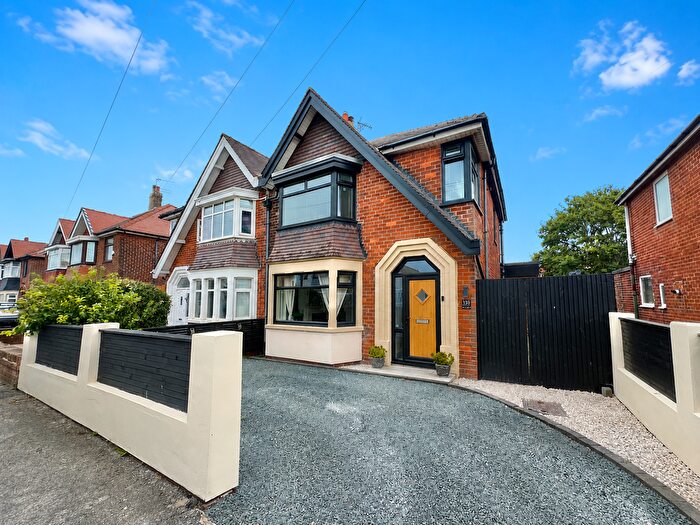
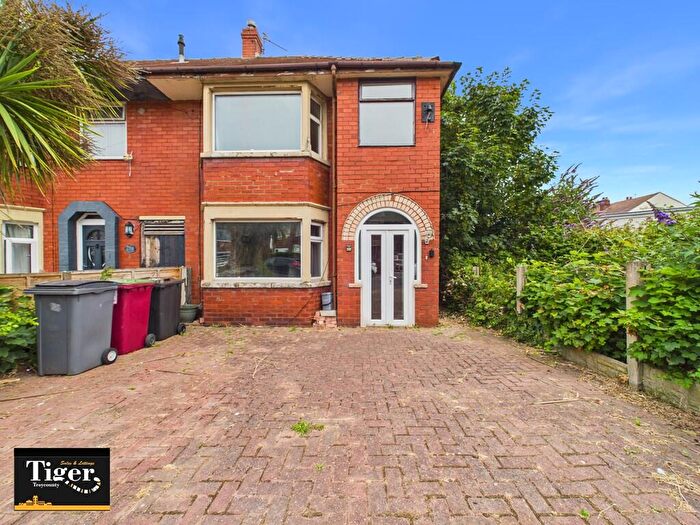
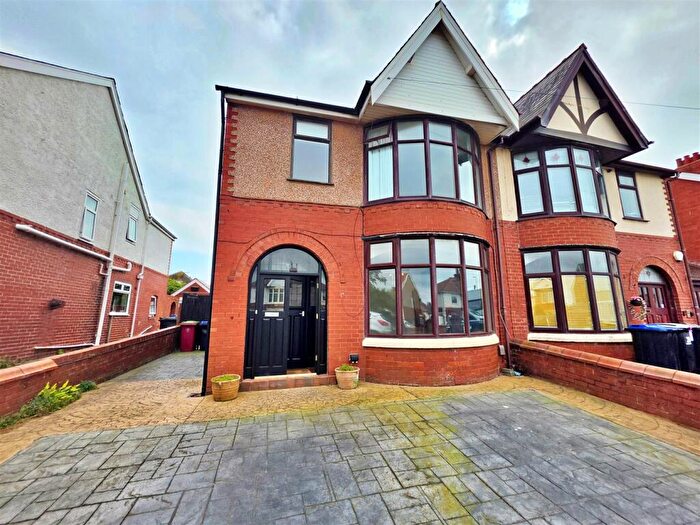
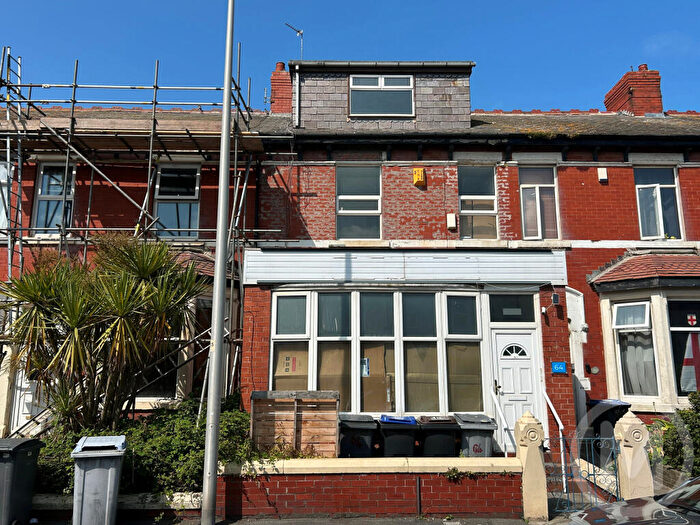
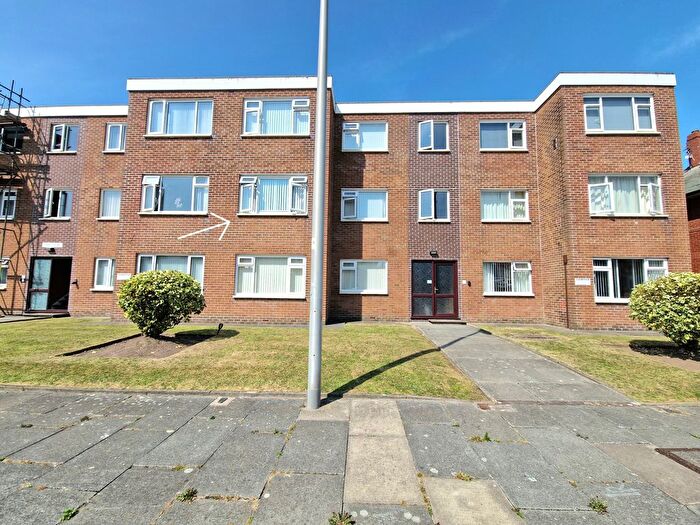
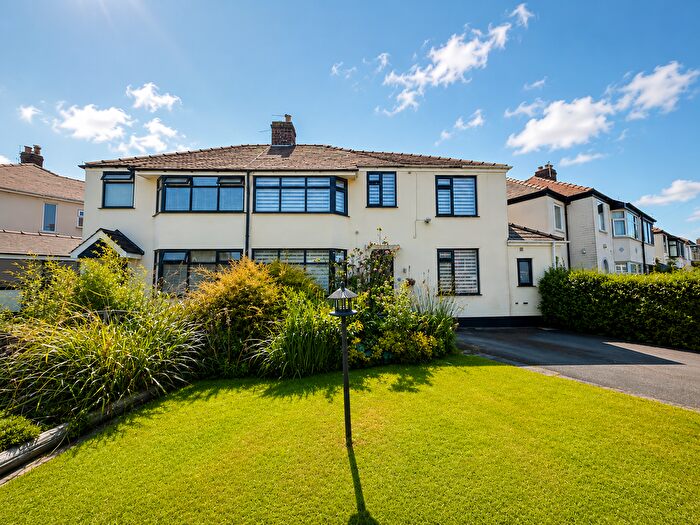
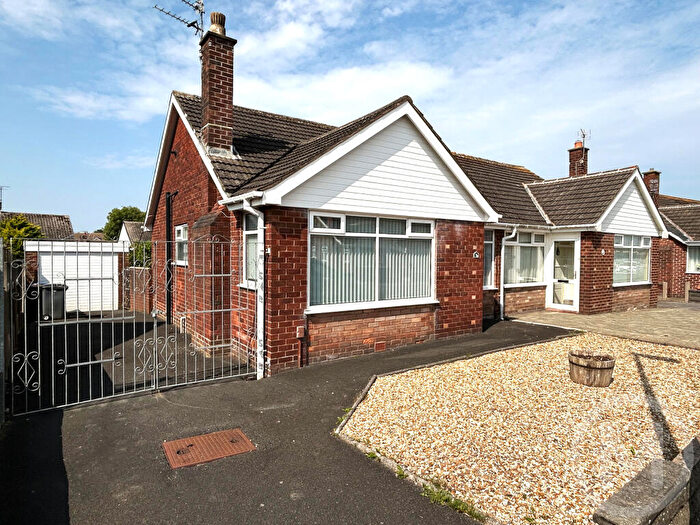
Houses and Flats for sale in FY2, Bispham
There are 185 results. Property prices in FY2 range from £46k to £725k with an average price of £194k.
![]()
If you are looking to sell your house, let it out, or receive a property valuation, an expert can help you.
Click the button below to get started.

Frequently Asked Questions about FY2
What is the average price for a property for sale in FY2?
The average price for a property for sale in FY2 is £152,910. There are 185 property listings for sale in FY2.
Which areas are included in the FY2 postcode district?
The main area within FY2 is Bispham.
What are the most common property types in FY2?
The most common property types in FY2 are Semi Detached Houses, Terraced Houses, Flats and Detached Houses.
What has been the average sold property price in FY2 over the last three years?
Semi Detached Houses in FY2 have an average sold price of £161,159, while Terraced Houses have an average of £136,212. Flats have an average of £89,023 and Detached Houses have an average of £246,568. The average sold property price in FY2 over the last three years is approximately £161,477.
Which train stations are available in FY2?
The train station available in FY2 is Layton Station..