
Properties for sale in FY1
Blackpool
- Info
- Price Paid By Year
- Property Type Price
- Transport
House Prices in FY1
Properties in FY1 have an average house price of £107,069.00 and had 1916 Property Transactions within the last 3 years.
The most expensive property was sold for £1,300,000.00.
Property Price Paid in FY1 by Year
The average sold property price by year was:
| Year | Average Sold Price | Sold Properties |
|---|---|---|
| 2026 | £102,591.00 | 37 Properties |
| 2025 | £115,299.00 | 558 Properties |
| 2024 | £101,514.00 | 650 Properties |
| 2023 | £105,853.00 | 671 Properties |
| 2022 | £107,592.00 | 787 Properties |
| 2021 | £101,637.00 | 729 Properties |
| 2020 | £93,802.00 | 520 Properties |
| 2019 | £92,631.00 | 614 Properties |
| 2018 | £85,817.00 | 532 Properties |
| 2017 | £104,117.00 | 548 Properties |
| 2016 | £83,860.00 | 543 Properties |
| 2015 | £80,713.00 | 470 Properties |
| 2014 | £78,729.00 | 483 Properties |
| 2013 | £76,127.00 | 367 Properties |
| 2012 | £76,995.00 | 258 Properties |
| 2011 | £85,597.00 | 353 Properties |
| 2010 | £93,887.00 | 333 Properties |
| 2009 | £90,706.00 | 363 Properties |
| 2008 | £105,912.00 | 519 Properties |
| 2007 | £113,874.00 | 1,156 Properties |
| 2006 | £107,515.00 | 1,112 Properties |
| 2005 | £104,382.00 | 1,090 Properties |
| 2004 | £89,038.00 | 1,375 Properties |
| 2003 | £69,882.00 | 1,455 Properties |
| 2002 | £56,395.00 | 1,439 Properties |
| 2001 | £47,080.00 | 1,071 Properties |
| 2000 | £44,207.00 | 877 Properties |
| 1999 | £42,087.00 | 836 Properties |
| 1998 | £39,831.00 | 819 Properties |
| 1997 | £40,528.00 | 757 Properties |
| 1996 | £38,182.00 | 628 Properties |
| 1995 | £39,286.00 | 617 Properties |
Property Price per Property Type in FY1
Here you can find historic sold price data in order to help with your property search.
The average Property Paid Price for specific property types in the last three years are:
| Property Type | Average Sold Price | Sold Properties |
|---|---|---|
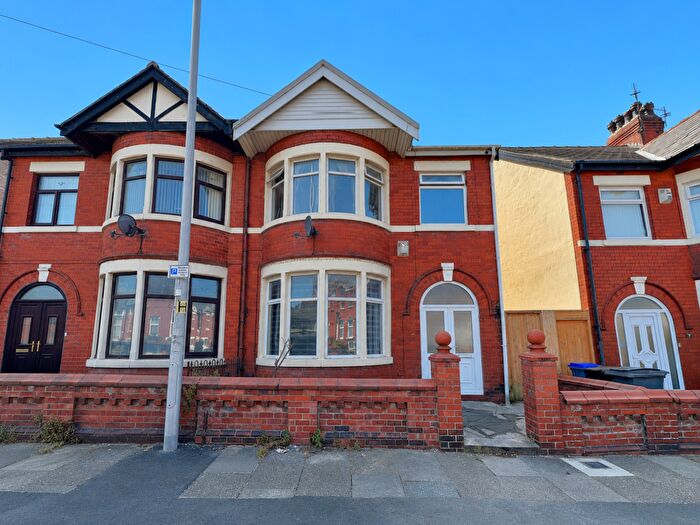
| Semi Detached House | £139,952.00 | 348 Semi Detached Houses |
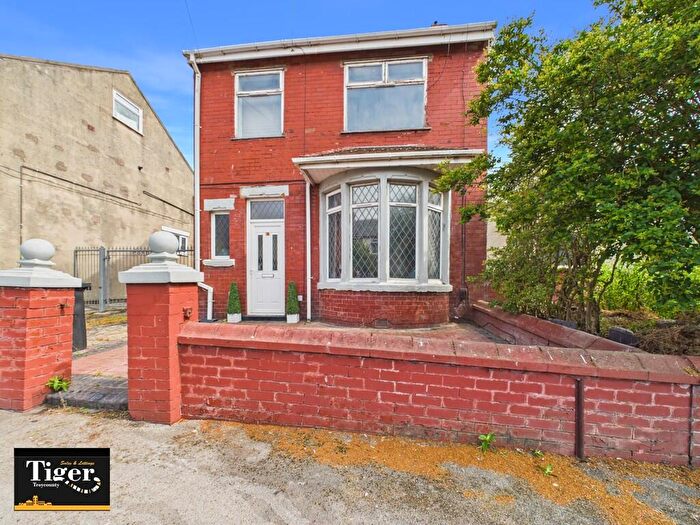
| Detached House | £217,970.00 | 42 Detached Houses |
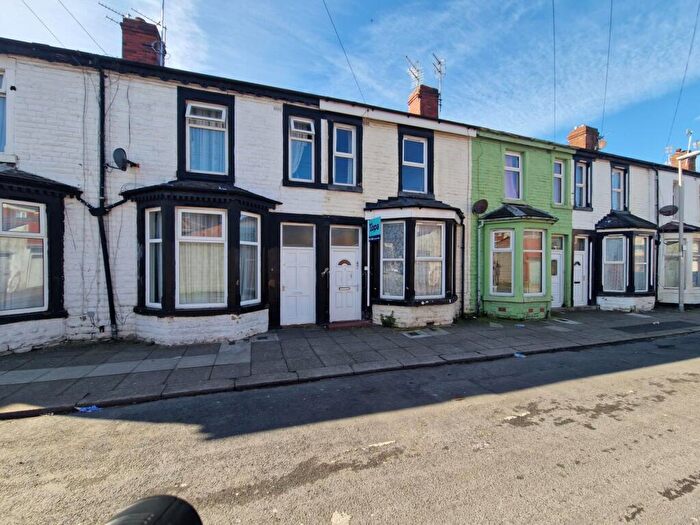
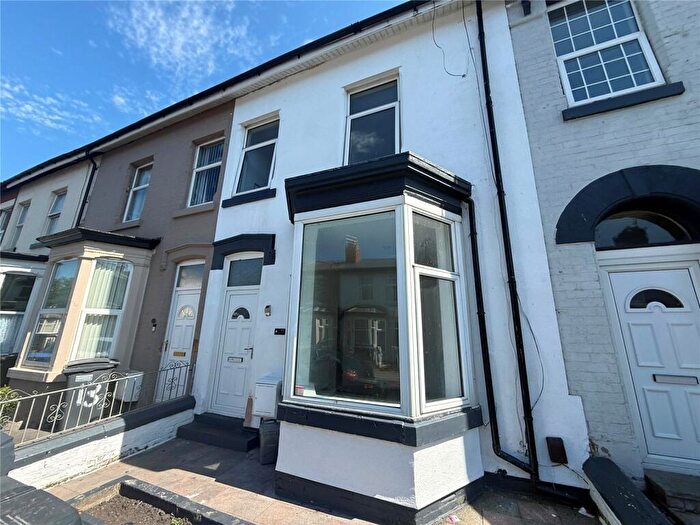
| Terraced House | £100,829.00 | 1,322 Terraced Houses |
| Flat | £68,580.00 | 204 Flats |

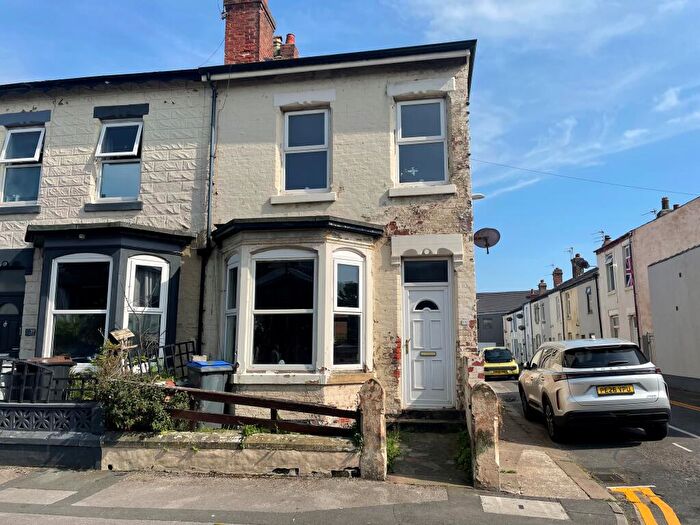
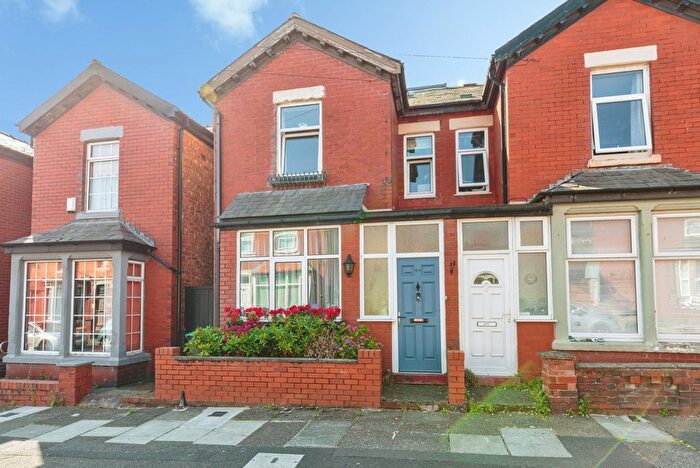
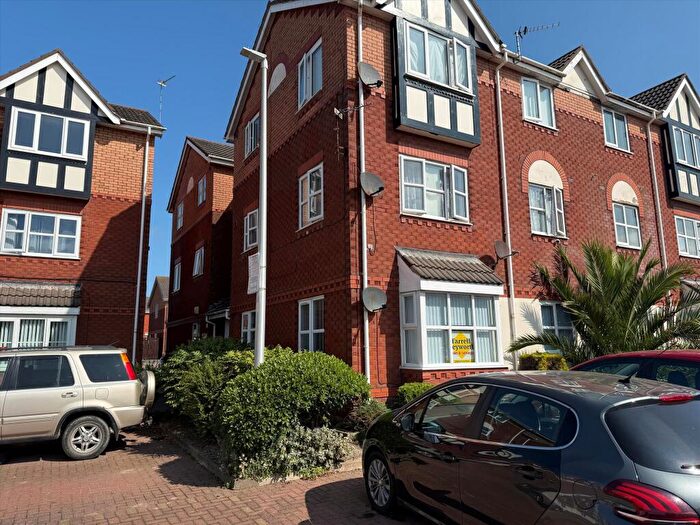
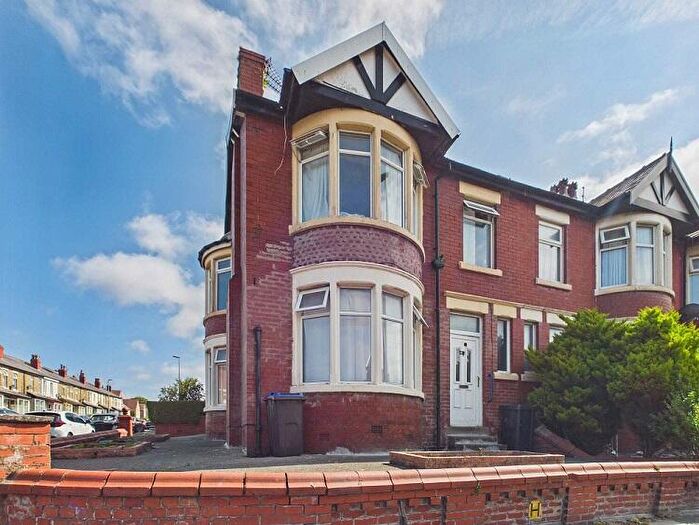
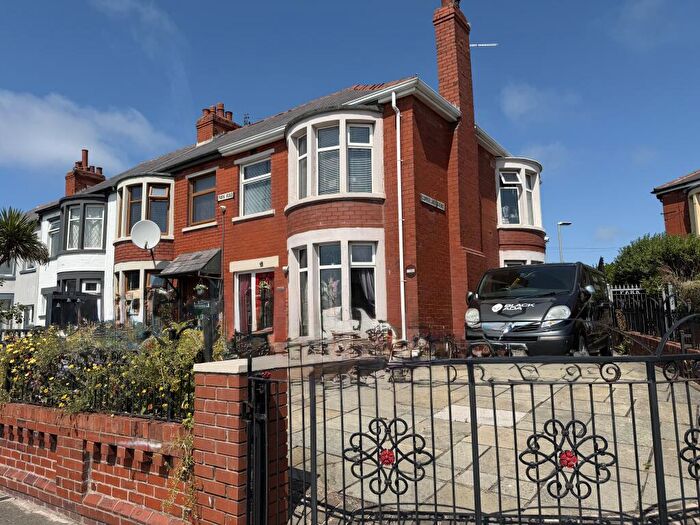
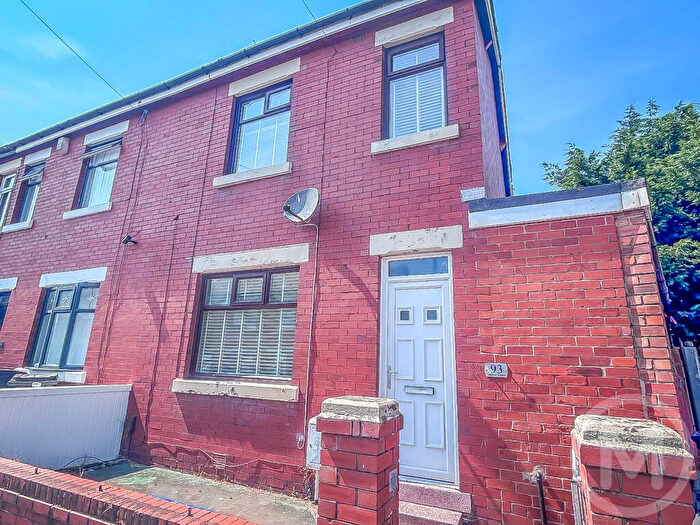
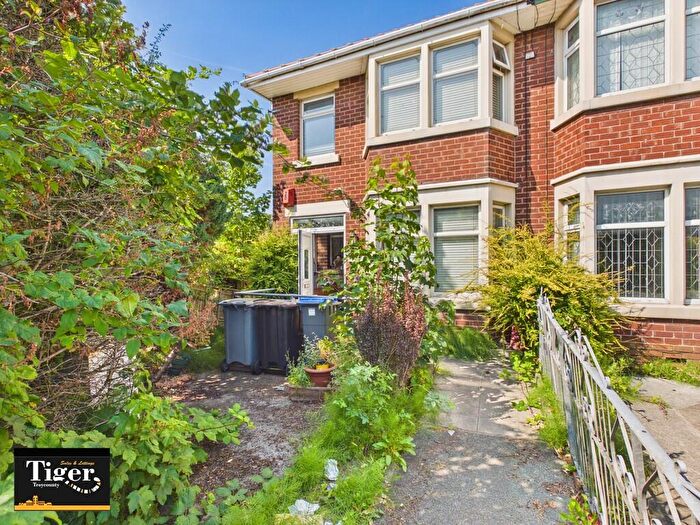
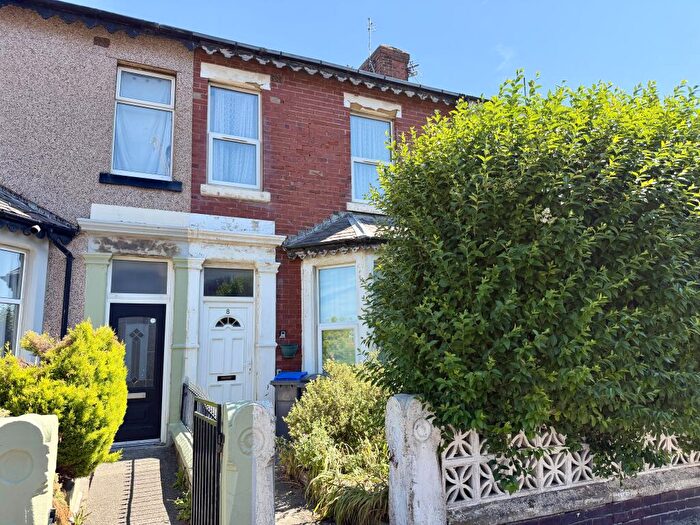
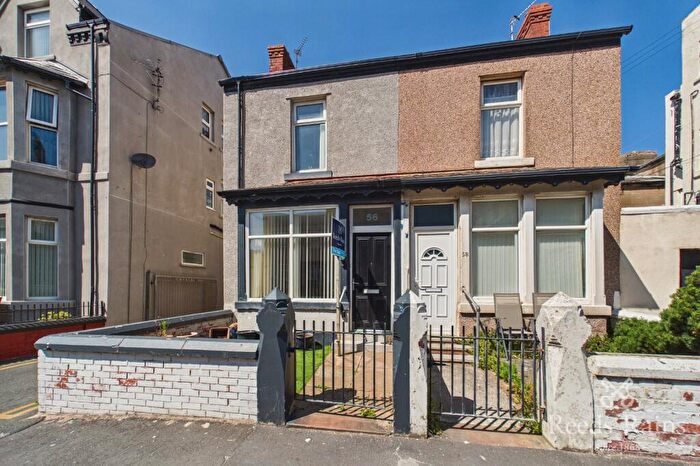
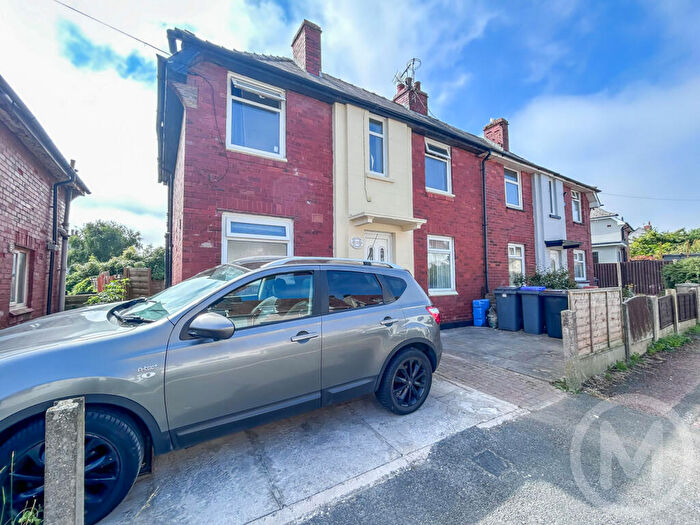
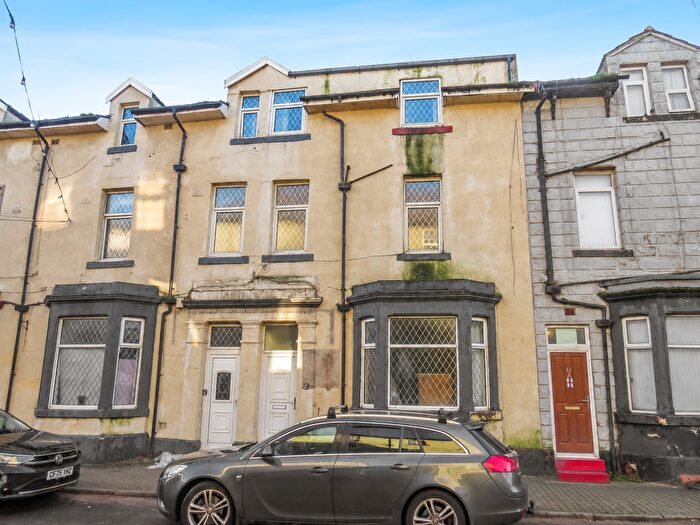
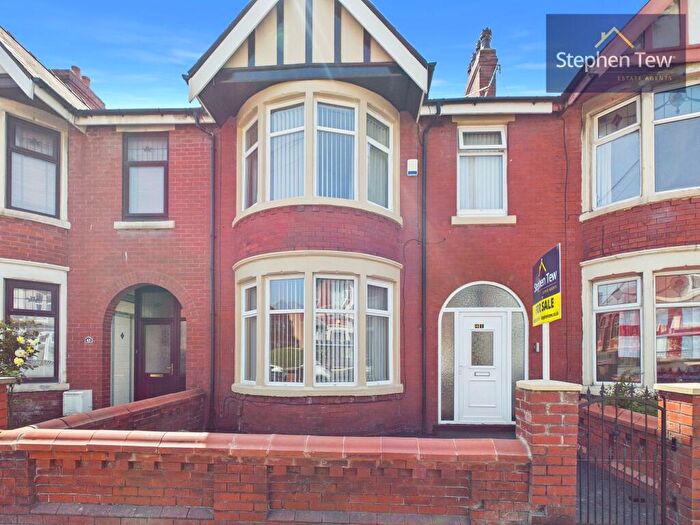
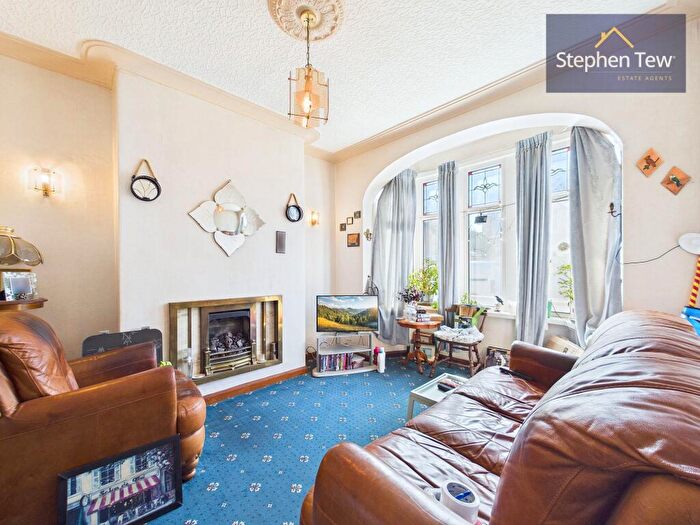
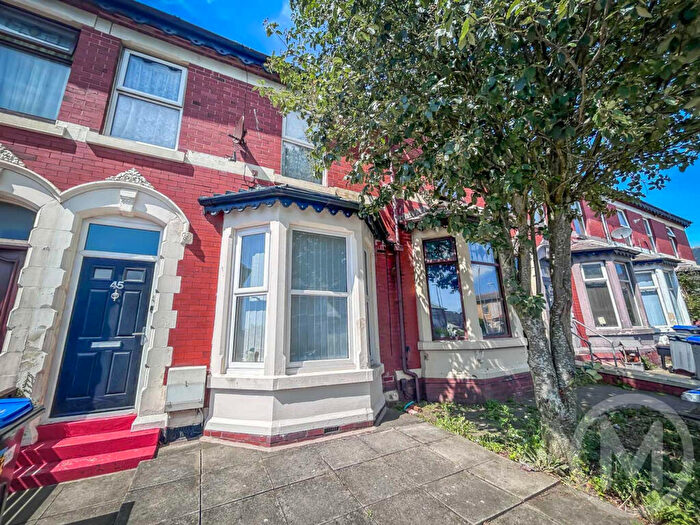
Houses and Flats for sale in FY1, Blackpool
There are 237 results. Property prices in FY1 range from £19k to £350k with an average price of £122k.


![]()
If you are looking to sell your house, let it out, or receive a property valuation, an expert can help you.
Click the button below to get started.

Frequently Asked Questions about FY1
What is the average price for a property for sale in FY1?
The average price for a property for sale in FY1 is £107,069. There are 237 property listings for sale in FY1.
Which areas are included in the FY1 postcode district?
The main area within FY1 is Blackpool.
What are the most common property types in FY1?
The most common property types in FY1 are Terraced Houses, Semi Detached Houses, Flats and Detached Houses.
What has been the average sold property price in FY1 over the last three years?
Terraced Houses in FY1 have an average sold price of £100,829, while Semi Detached Houses have an average of £139,952. Flats have an average of £68,580 and Detached Houses have an average of £217,970. The average sold property price in FY1 over the last three years is approximately £106,468.
Which train stations are available in FY1?
The train station available in FY1 is Blackpool North Station..