
Properties for sale in KW15
Kirkwall
- Info
- Price Paid By Year
- Transport
House Prices in KW15
Properties in KW15 have an average house price of £195,350.00 and had 169 Property Transactions within the last 3 years.
The most expensive property was sold for £545,000.00.
Property Price Paid in KW15 by Year
The average sold property price by year was:
| Year | Average Sold Price | Sold Properties |
|---|---|---|
| 2025 | £193,547.00 | 49 Properties |
| 2024 | £180,065.00 | 60 Properties |
| 2023 | £212,109.00 | 60 Properties |
| 2022 | £193,630.00 | 124 Properties |
| 2021 | £185,267.00 | 147 Properties |
| 2020 | £159,255.00 | 132 Properties |
| 2019 | £163,273.00 | 163 Properties |
| 2018 | £163,210.00 | 181 Properties |
| 2017 | £147,256.00 | 202 Properties |
| 2016 | £141,504.00 | 180 Properties |
| 2015 | £132,110.00 | 148 Properties |
| 2014 | £125,740.00 | 150 Properties |
| 2013 | £131,184.00 | 133 Properties |
| 2012 | £121,103.00 | 116 Properties |
| 2011 | £119,410.00 | 114 Properties |
| 2010 | £106,714.00 | 116 Properties |
| 2009 | £118,331.00 | 115 Properties |
| 2008 | £109,710.00 | 161 Properties |
| 2007 | £111,268.00 | 150 Properties |
| 2006 | £103,038.00 | 168 Properties |
| 2005 | £111,919.00 | 169 Properties |
| 2004 | £80,617.00 | 180 Properties |
| 2003 | £55,130.00 | 129 Properties |
| 2002 | £49,040.00 | 21 Properties |
| 2001 | £43,654.00 | 20 Properties |
| 2000 | £49,271.00 | 12 Properties |
Transport near KW15

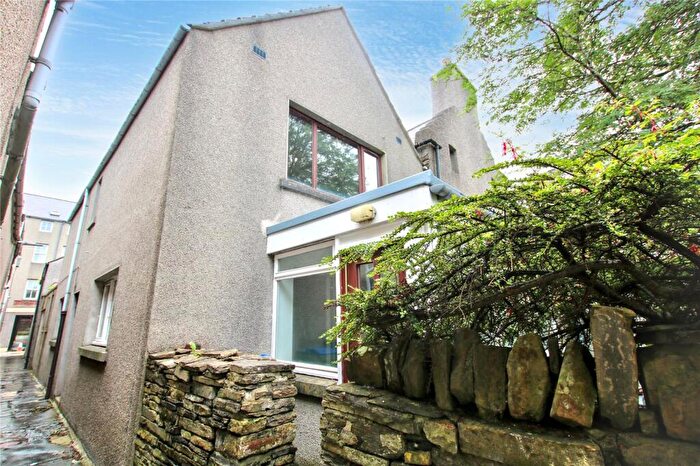
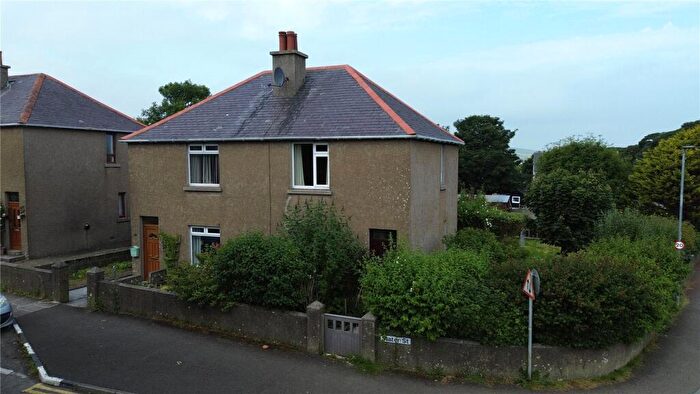
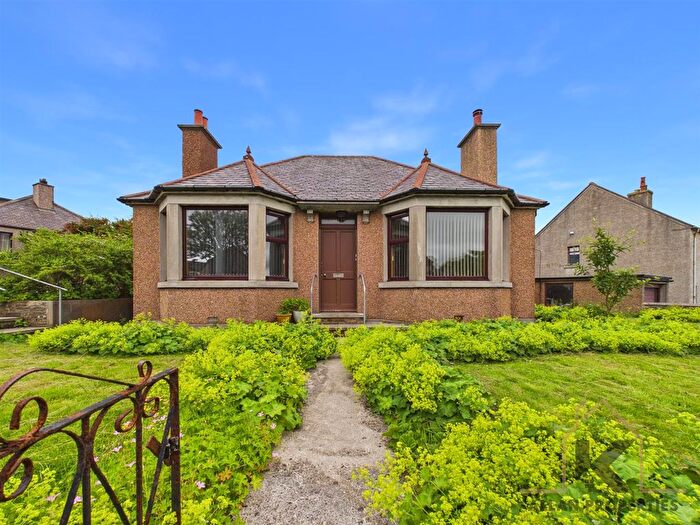
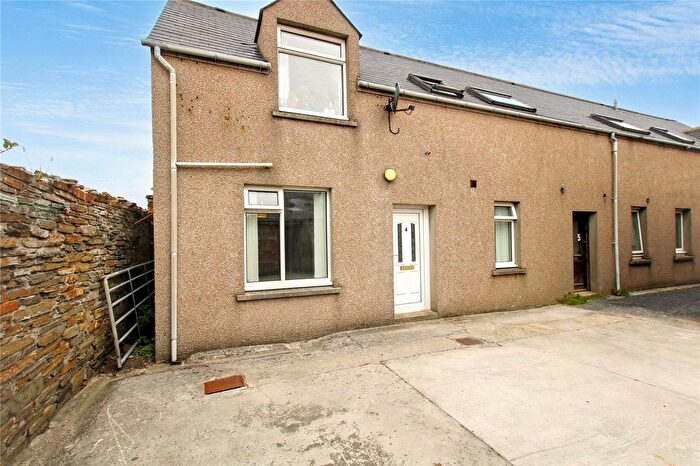
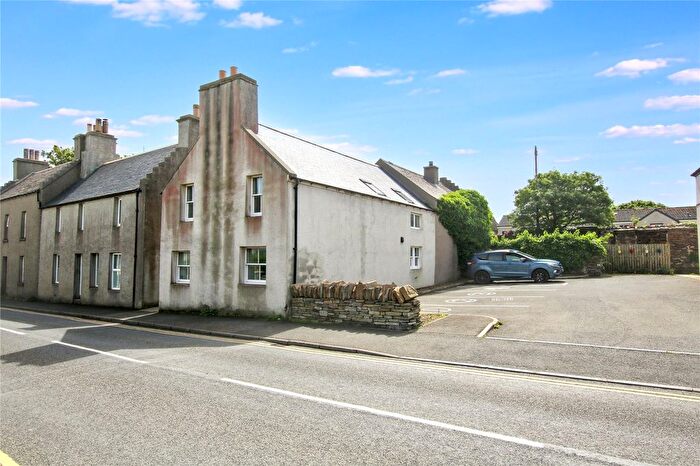
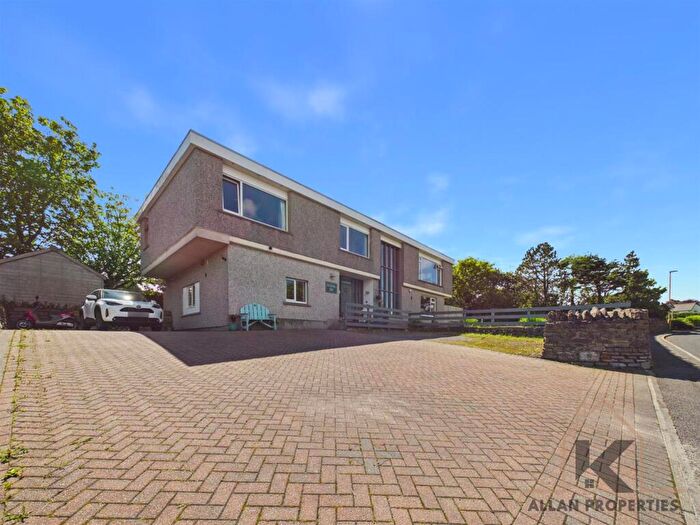
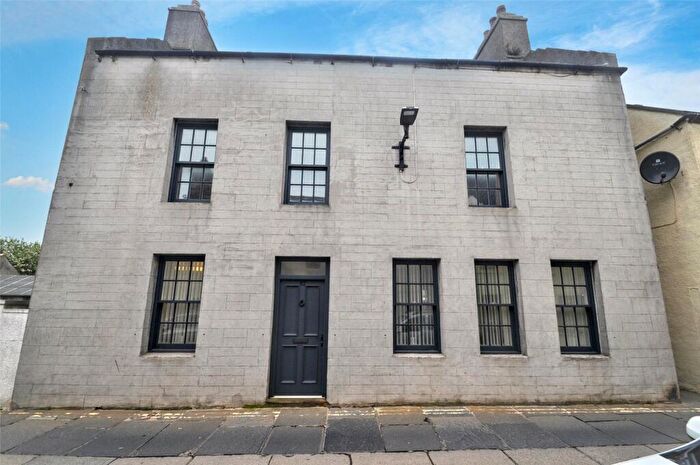
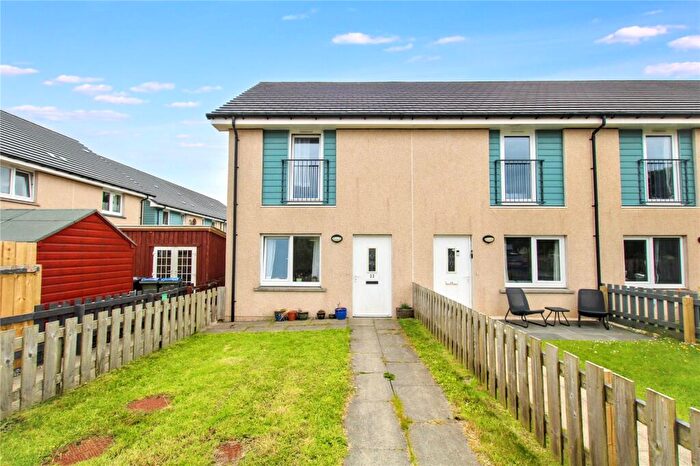
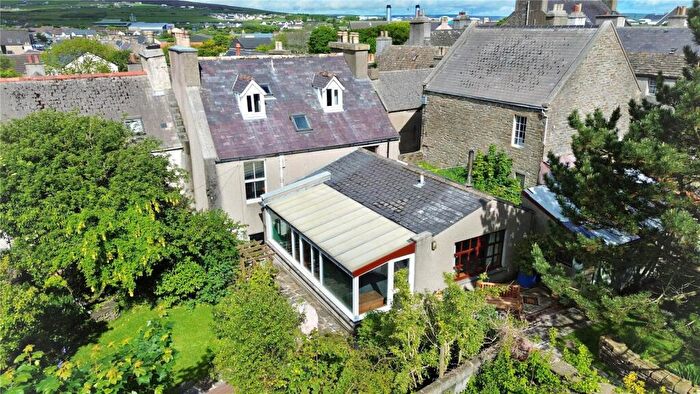
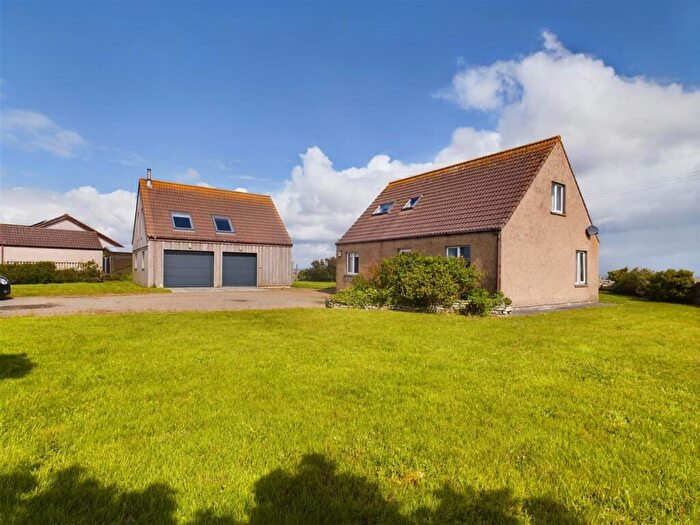
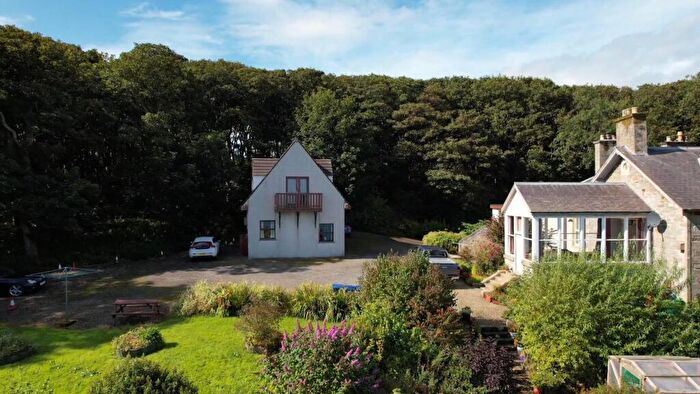
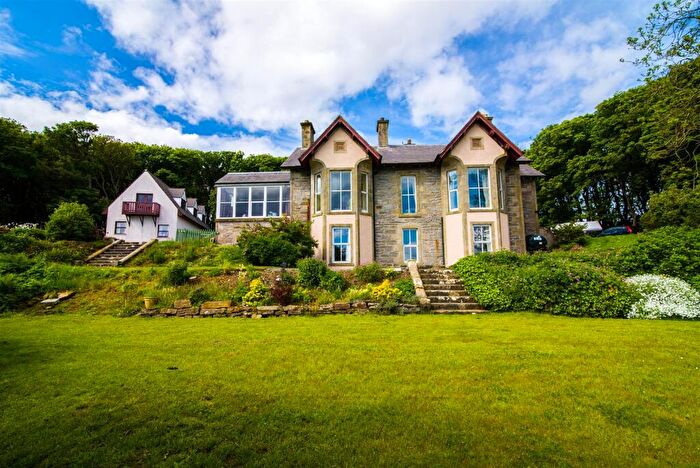
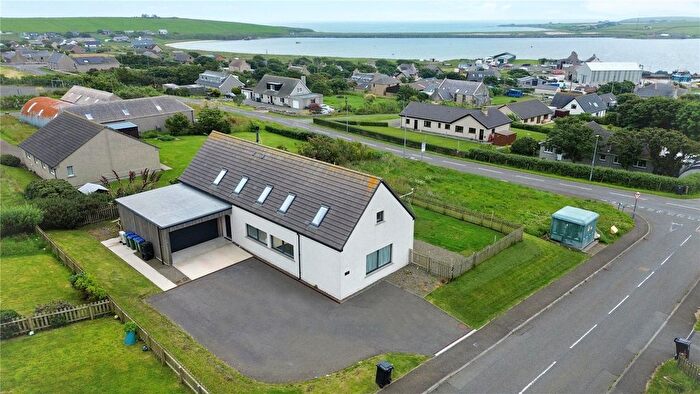
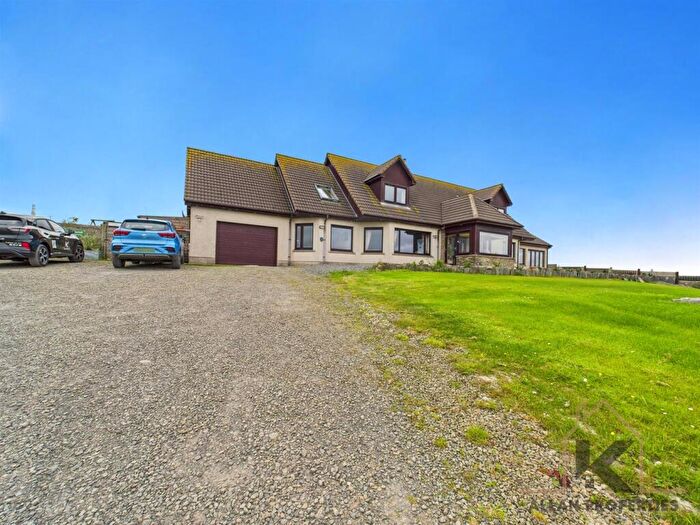
Houses and Flats for sale in KW15, Kirkwall
There are 167 results. Property prices in KW15 range from £110k to £1.3M with an average price of £351k.
![]()
If you are looking to sell your house, let it out, or receive a property valuation, an expert can help you.
Click the button below to get started.
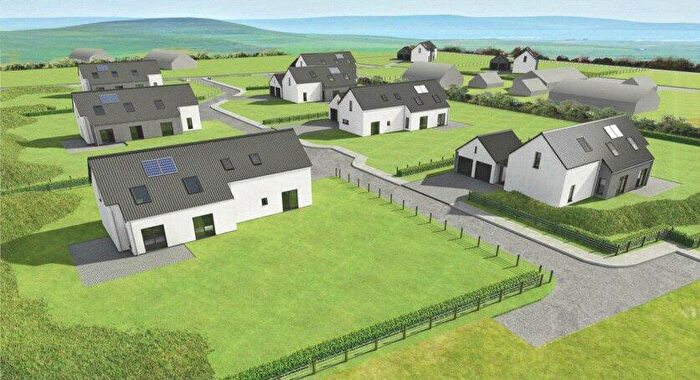

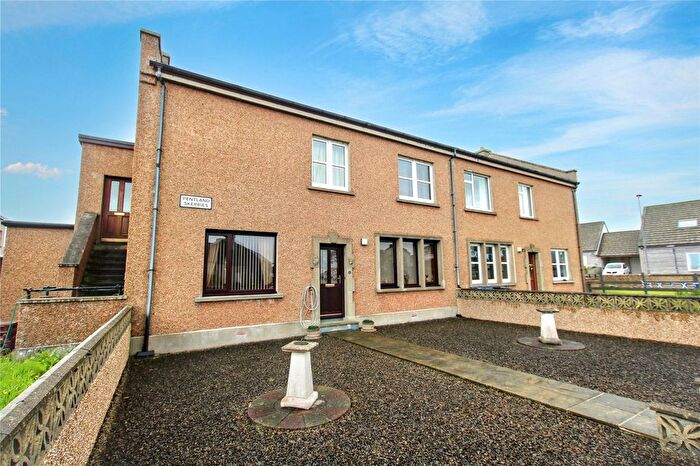
Properties for sale near KW15
![]()
If you are looking to sell your house, let it out, or receive a property valuation, an expert can help you.
Click the button below to get started.
Frequently Asked Questions about KW15
What is the average price for a property for sale in KW15?
The average price for a property for sale in KW15 is £195,350. There are 16 property listings for sale in KW15.
Which areas are included in the KW15 postcode district?
The main area within KW15 is Kirkwall.
What are the most common property types in KW15?
The most common property types in KW15 are Unknowns.
What has been the average sold property price in KW15 over the last three years?
Unknowns in KW15 have an average sold price of £195,350. The average sold property price in KW15 over the last three years is approximately £195,240.