
Properties for sale in NG23
Newark-on-Trent
- Info
- Price Paid By Year
- Property Type Price
- Transport
House Prices in NG23
Properties in NG23 have an average house price of £377,023.00 and had 737 Property Transactions within the last 3 years.
The most expensive property was sold for £1,500,000.00.
Property Price Paid in NG23 by Year
The average sold property price by year was:
| Year | Average Sold Price | Sold Properties |
|---|---|---|
| 2026 | £309,099.00 | 15 Properties |
| 2025 | £383,610.00 | 229 Properties |
| 2024 | £372,341.00 | 274 Properties |
| 2023 | £380,646.00 | 219 Properties |
| 2022 | £391,014.00 | 290 Properties |
| 2021 | £353,685.00 | 408 Properties |
| 2020 | £317,098.00 | 315 Properties |
| 2019 | £297,268.00 | 280 Properties |
| 2018 | £304,957.00 | 292 Properties |
| 2017 | £284,684.00 | 259 Properties |
| 2016 | £270,150.00 | 319 Properties |
| 2015 | £253,389.00 | 363 Properties |
| 2014 | £265,023.00 | 356 Properties |
| 2013 | £232,966.00 | 304 Properties |
| 2012 | £228,532.00 | 234 Properties |
| 2011 | £244,041.00 | 221 Properties |
| 2010 | £233,554.00 | 251 Properties |
| 2009 | £233,535.00 | 235 Properties |
| 2008 | £241,804.00 | 220 Properties |
| 2007 | £252,640.00 | 380 Properties |
| 2006 | £230,875.00 | 343 Properties |
| 2005 | £233,608.00 | 328 Properties |
| 2004 | £224,437.00 | 365 Properties |
| 2003 | £188,131.00 | 355 Properties |
| 2002 | £166,124.00 | 417 Properties |
| 2001 | £130,671.00 | 374 Properties |
| 2000 | £106,826.00 | 360 Properties |
| 1999 | £101,185.00 | 385 Properties |
| 1998 | £91,844.00 | 307 Properties |
| 1997 | £79,257.00 | 377 Properties |
| 1996 | £79,307.00 | 293 Properties |
| 1995 | £81,030.00 | 257 Properties |
Property Price per Property Type in NG23
Here you can find historic sold price data in order to help with your property search.
The average Property Paid Price for specific property types in the last three years are:
| Property Type | Average Sold Price | Sold Properties |
|---|---|---|
| Semi Detached House | £260,157.00 | 159 Semi Detached Houses |
| Detached House | £439,867.00 | 503 Detached Houses |
| Terraced House | £207,415.00 | 70 Terraced Houses |
| Flat | £145,800.00 | 5 Flats |
Transport near NG23

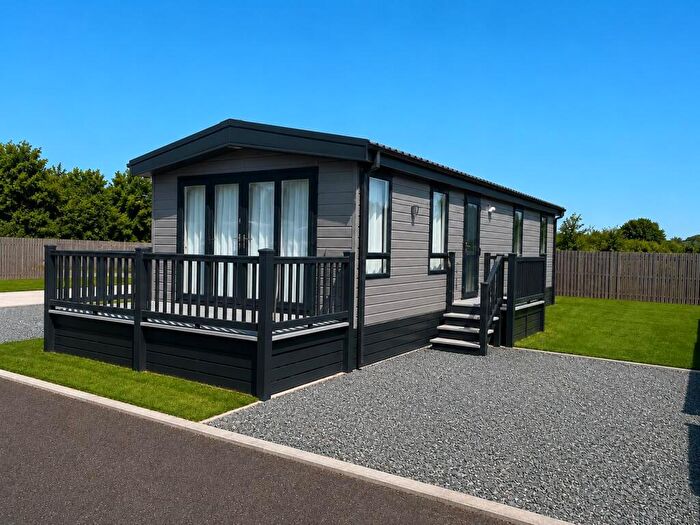
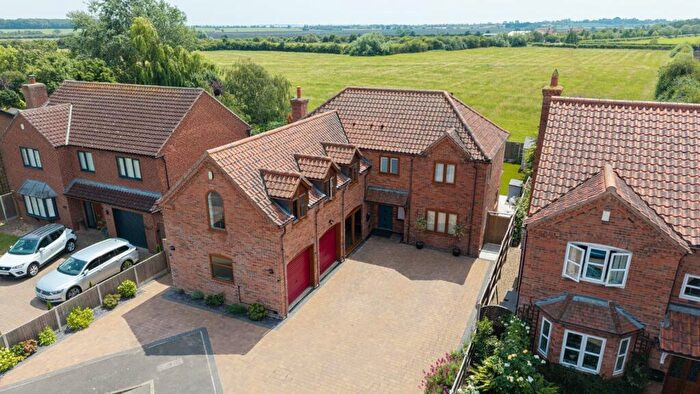
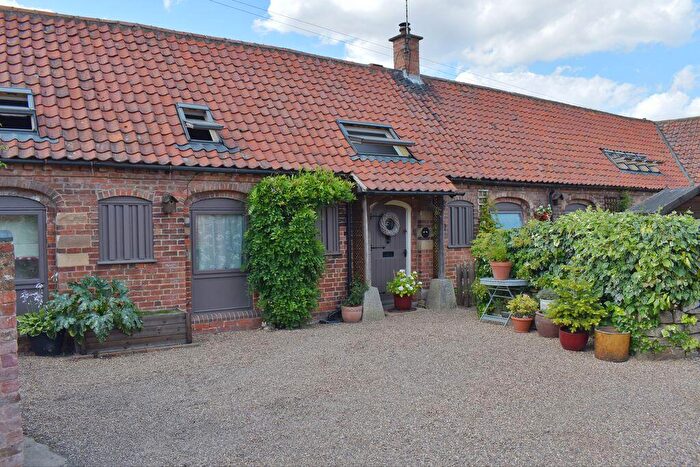
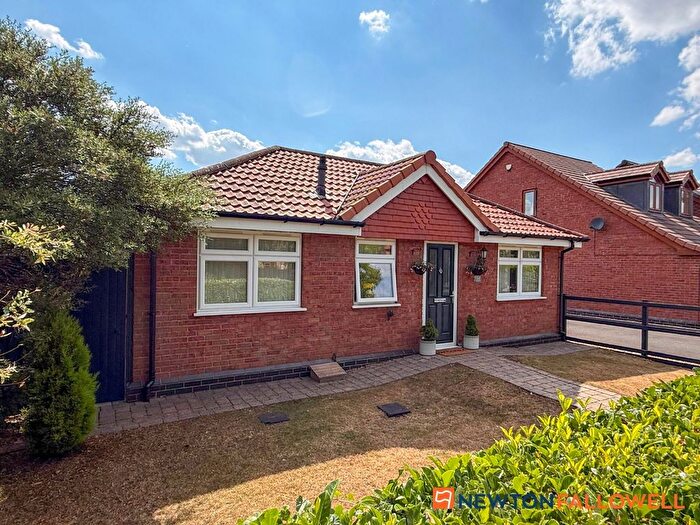
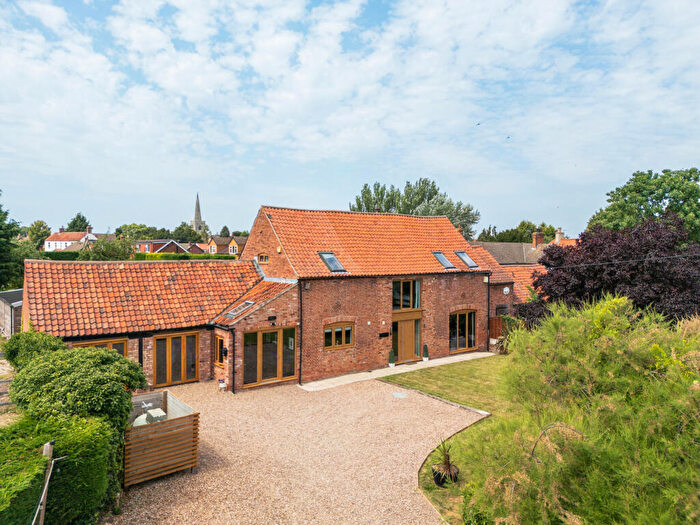
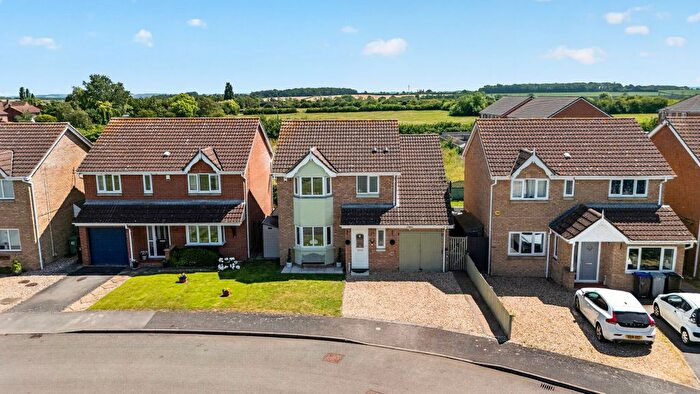
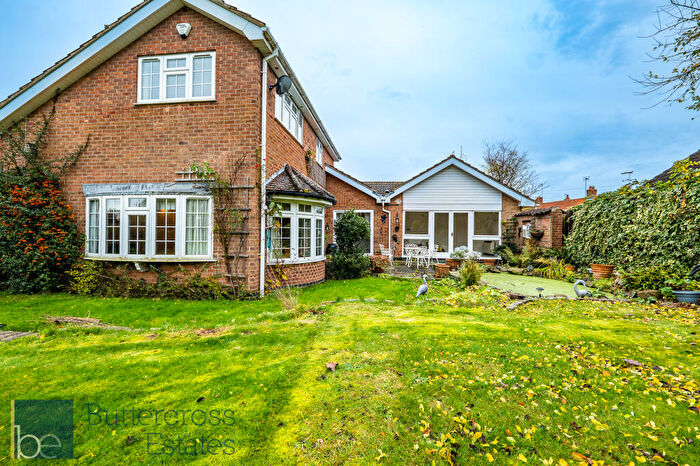
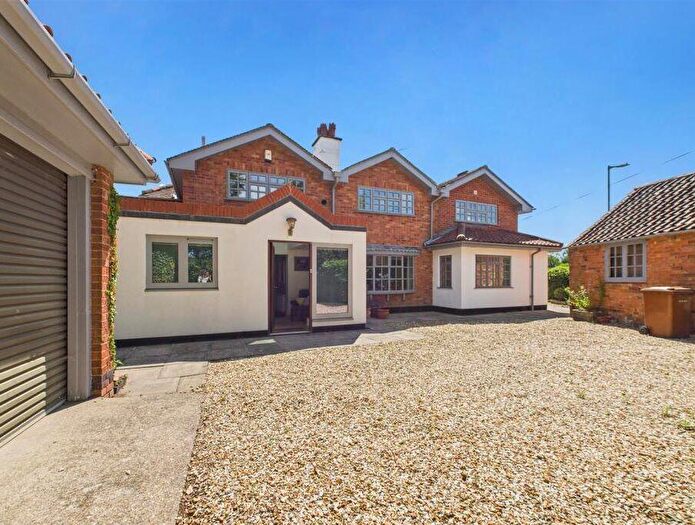
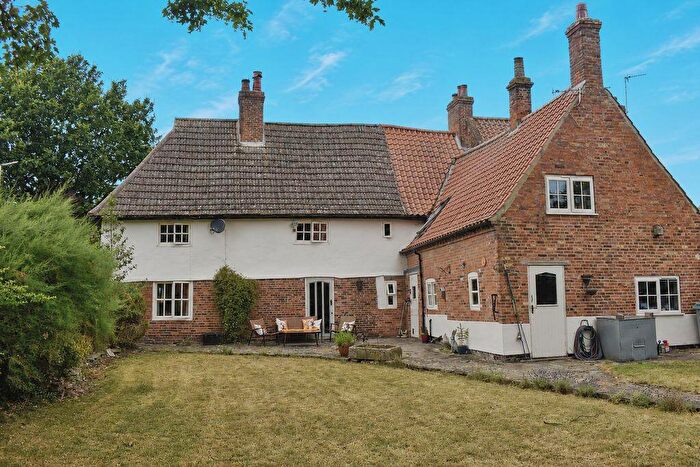
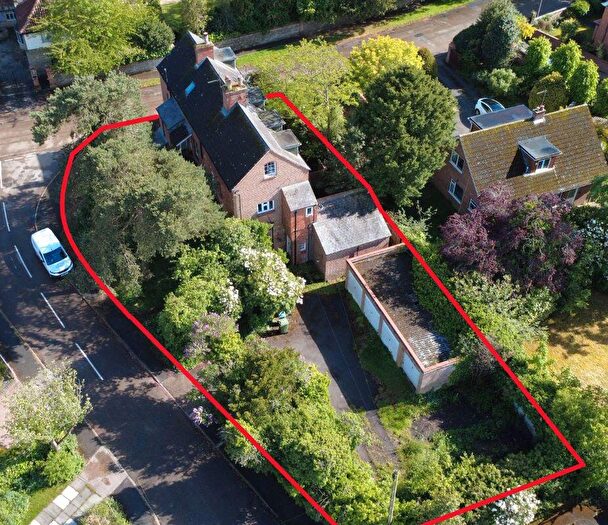
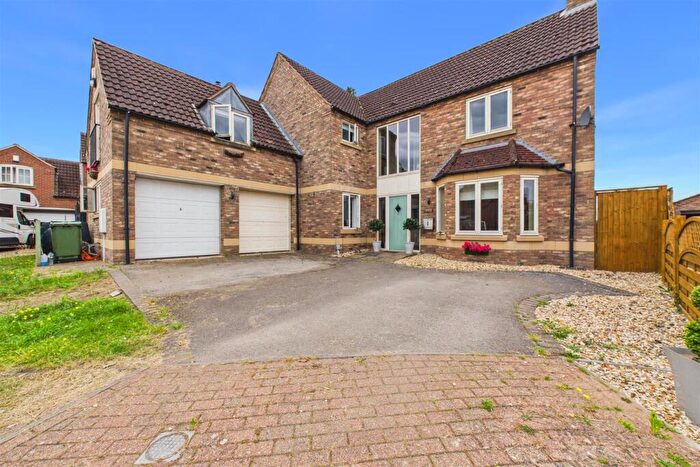
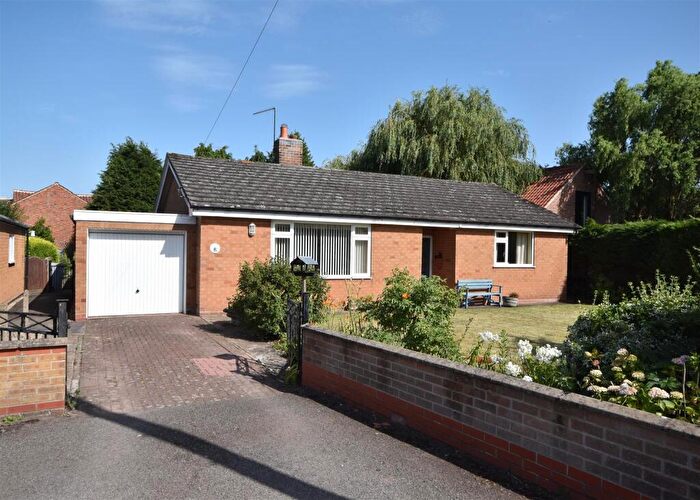
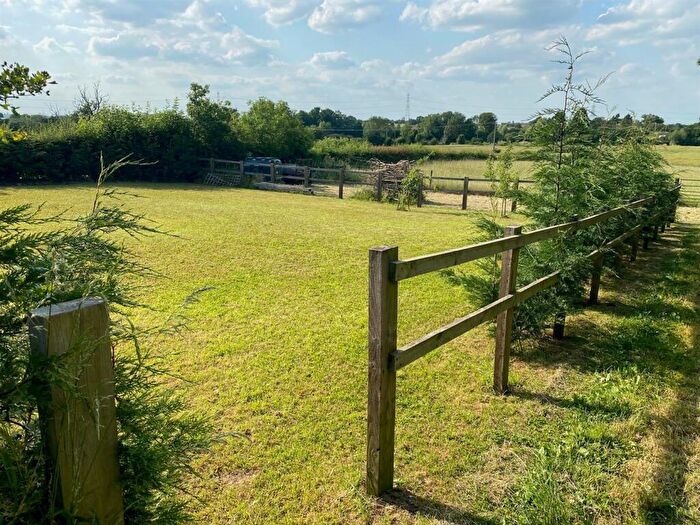
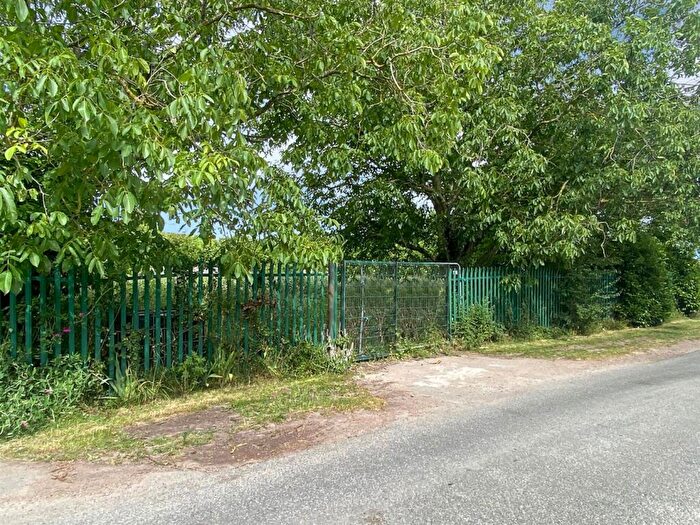
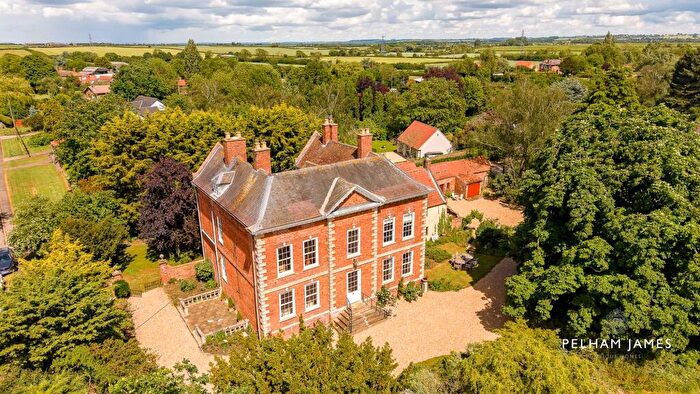
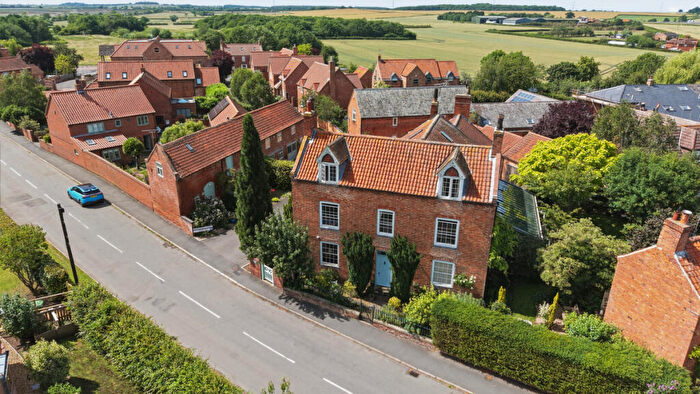
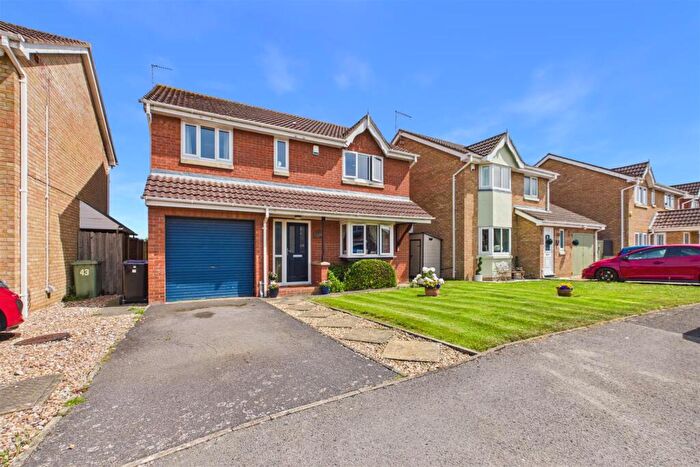
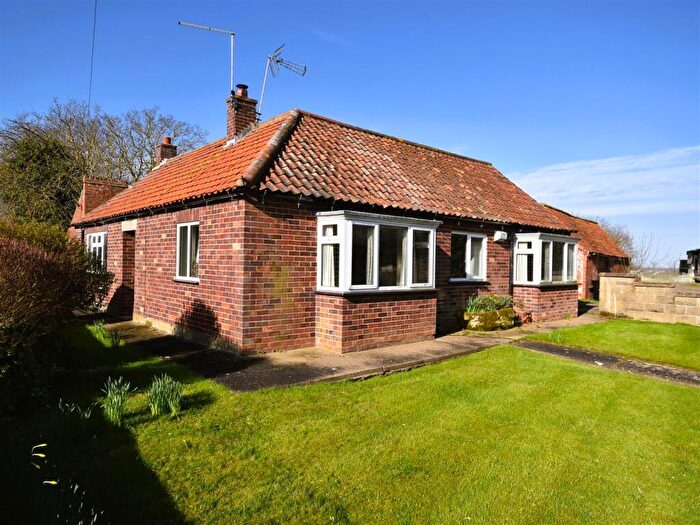
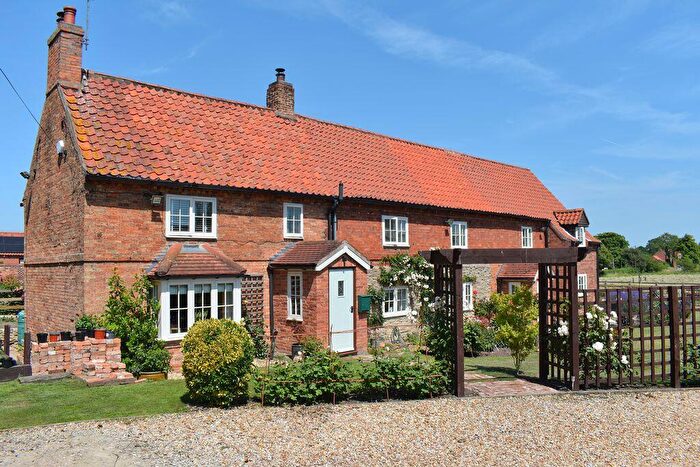
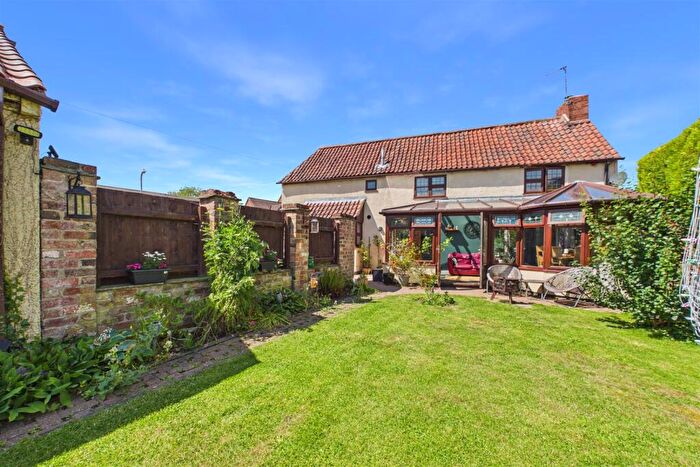
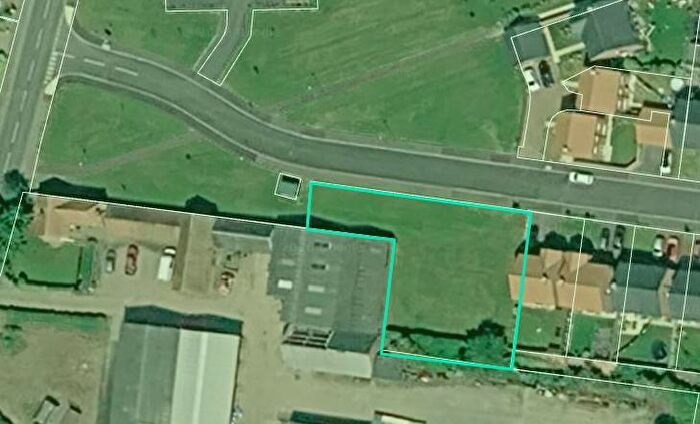
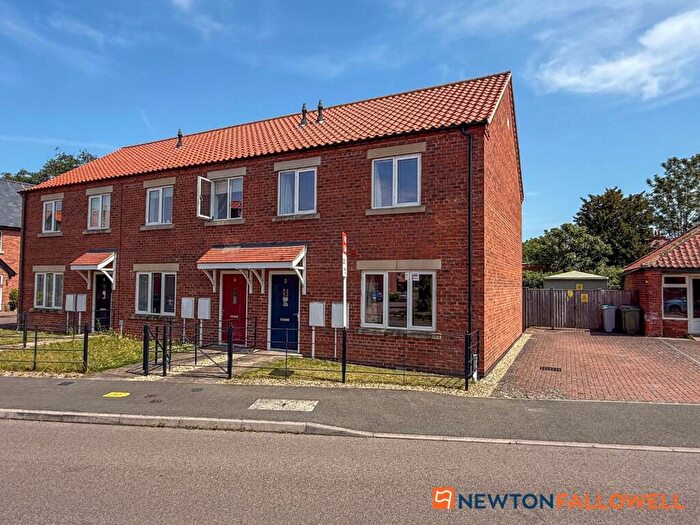
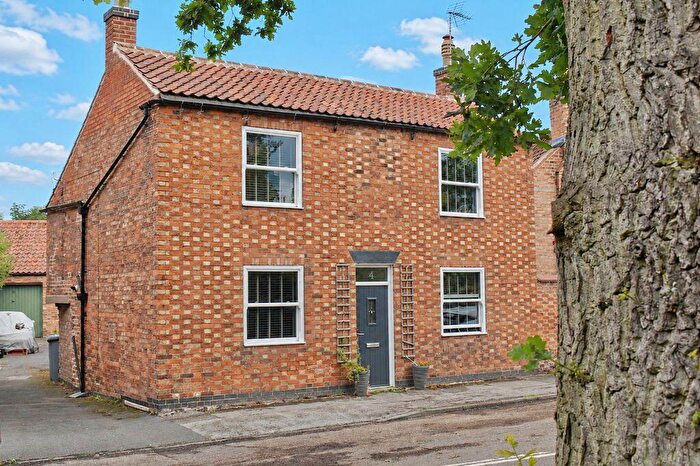
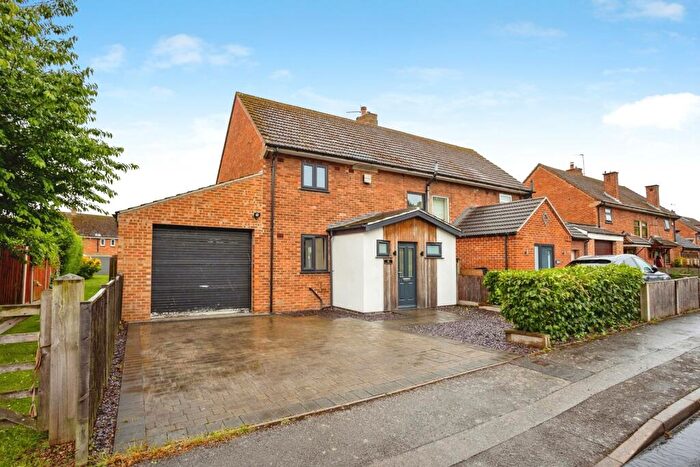
Houses and Flats for sale in NG23, Newark-on-Trent
There are 151 results. Property prices in NG23 range from £60k to £1.85M with an average price of £503k.
![]()
If you are looking to sell your house, let it out, or receive a property valuation, an expert can help you.
Click the button below to get started.
Frequently Asked Questions about NG23
What is the average price for a property for sale in NG23?
The average price for a property for sale in NG23 is £377,023. There are 151 property listings for sale in NG23.
Which areas are included in the NG23 postcode district?
The main area within NG23 is Newark-on-Trent.
What are the most common property types in NG23?
The most common property types in NG23 are Detached Houses, Semi Detached Houses, Terraced Houses and Flats.
What has been the average sold property price in NG23 over the last three years?
Detached Houses in NG23 have an average sold price of £439,867, while Semi Detached Houses have an average of £260,157. Terraced Houses have an average of £207,415 and Flats have an average of £145,800. The average sold property price in NG23 over the last three years is approximately £355,017.
Which train stations are available in NG23?
The train station available in NG23 is Collingham Station..