
Properties for sale in OL10
Heywood
- Info
- Price Paid By Year
- Property Type Price
- Transport
House Prices in OL10
Properties in OL10 have an average house price of £184,381.00 and had 1194 Property Transactions within the last 3 years.
The most expensive property was sold for £1,500,000.00.
Property Price Paid in OL10 by Year
The average sold property price by year was:
| Year | Average Sold Price | Sold Properties |
|---|---|---|
| 2026 | £189,575.00 | 20 Properties |
| 2025 | £191,650.00 | 385 Properties |
| 2024 | £181,718.00 | 392 Properties |
| 2023 | £179,700.00 | 397 Properties |
| 2022 | £186,131.00 | 474 Properties |
| 2021 | £169,243.00 | 541 Properties |
| 2020 | £144,779.00 | 376 Properties |
| 2019 | £135,493.00 | 474 Properties |
| 2018 | £123,657.00 | 454 Properties |
| 2017 | £126,882.00 | 466 Properties |
| 2016 | £113,301.00 | 544 Properties |
| 2015 | £134,765.00 | 515 Properties |
| 2014 | £122,808.00 | 471 Properties |
| 2013 | £120,995.00 | 303 Properties |
| 2012 | £130,989.00 | 268 Properties |
| 2011 | £120,274.00 | 291 Properties |
| 2010 | £115,405.00 | 238 Properties |
| 2009 | £114,701.00 | 209 Properties |
| 2008 | £117,287.00 | 274 Properties |
| 2007 | £116,596.00 | 588 Properties |
| 2006 | £112,272.00 | 521 Properties |
| 2005 | £103,295.00 | 445 Properties |
| 2004 | £92,773.00 | 563 Properties |
| 2003 | £71,523.00 | 593 Properties |
| 2002 | £65,770.00 | 711 Properties |
| 2001 | £50,891.00 | 532 Properties |
| 2000 | £47,495.00 | 446 Properties |
| 1999 | £45,783.00 | 452 Properties |
| 1998 | £42,809.00 | 418 Properties |
| 1997 | £42,129.00 | 431 Properties |
| 1996 | £40,492.00 | 381 Properties |
| 1995 | £41,291.00 | 405 Properties |
Property Price per Property Type in OL10
Here you can find historic sold price data in order to help with your property search.
The average Property Paid Price for specific property types in the last three years are:
| Property Type | Average Sold Price | Sold Properties |
|---|---|---|
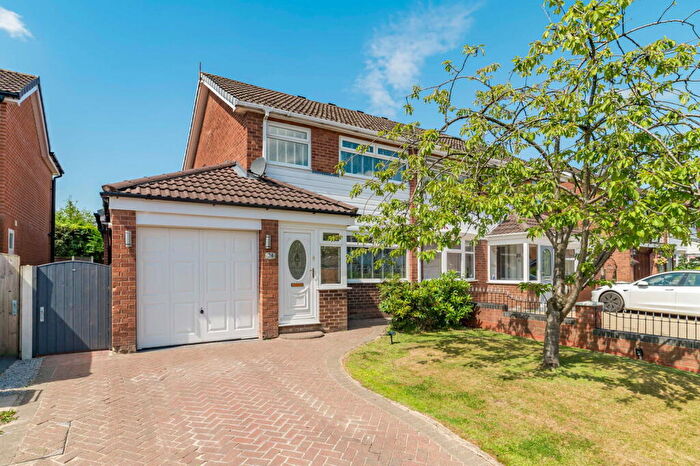
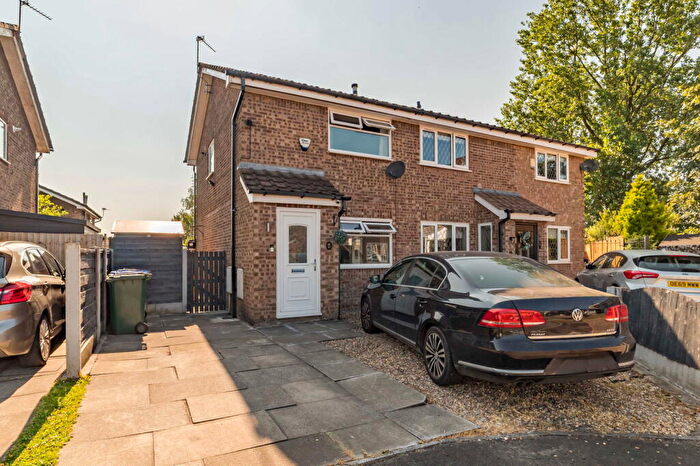
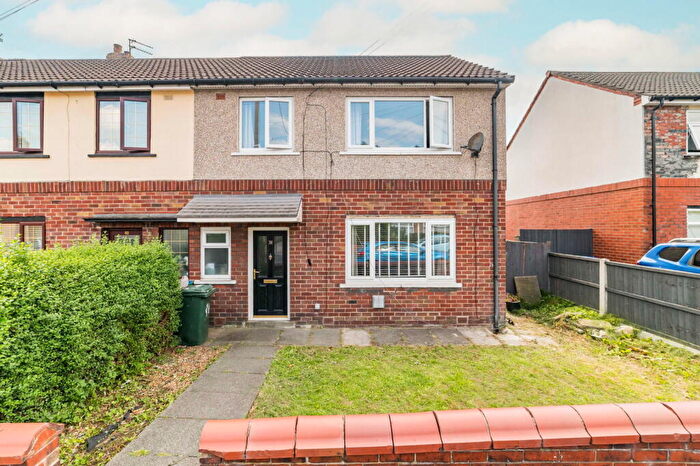
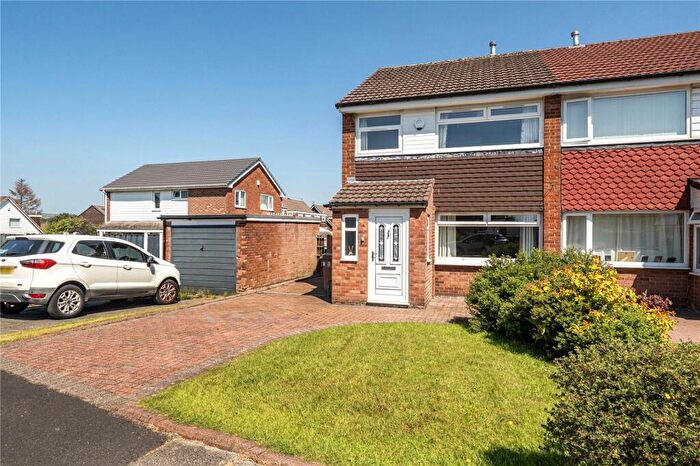
| Semi Detached House | £209,958.00 | 319 Semi Detached Houses |
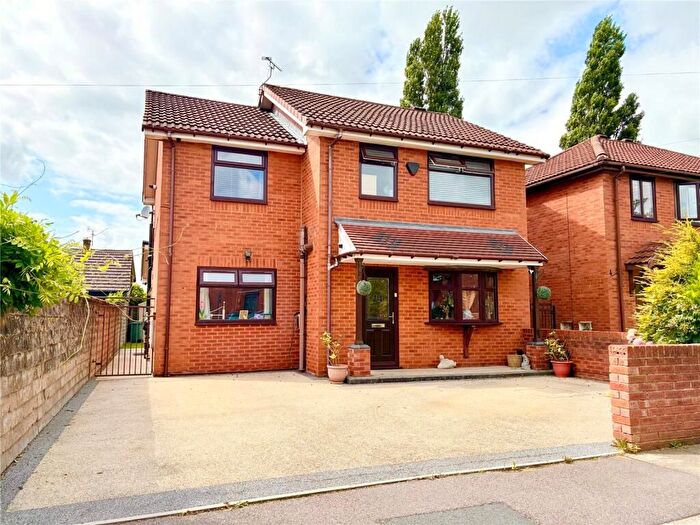
| Detached House | £344,889.00 | 130 Detached Houses |
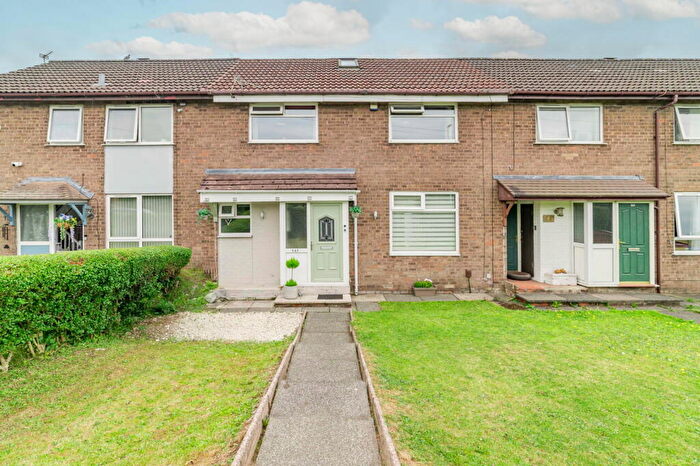
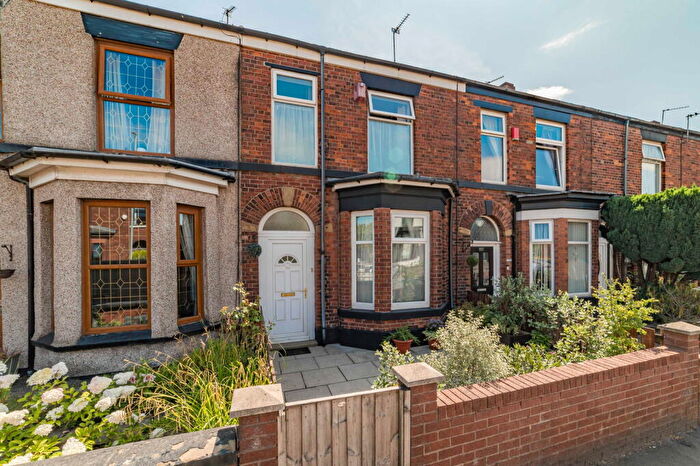
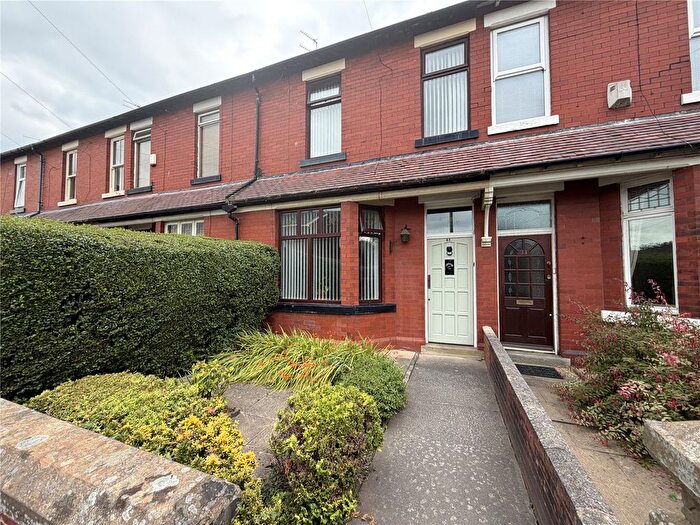
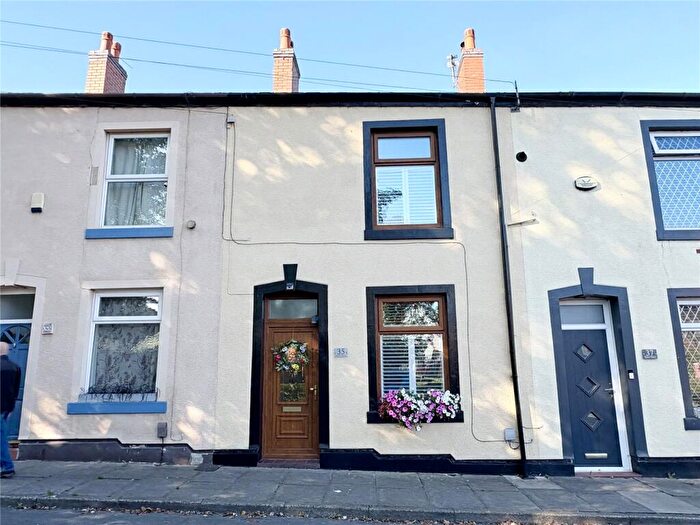
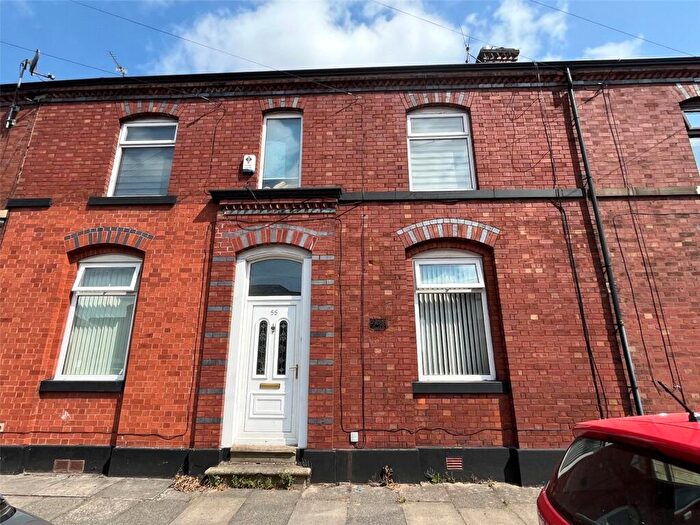
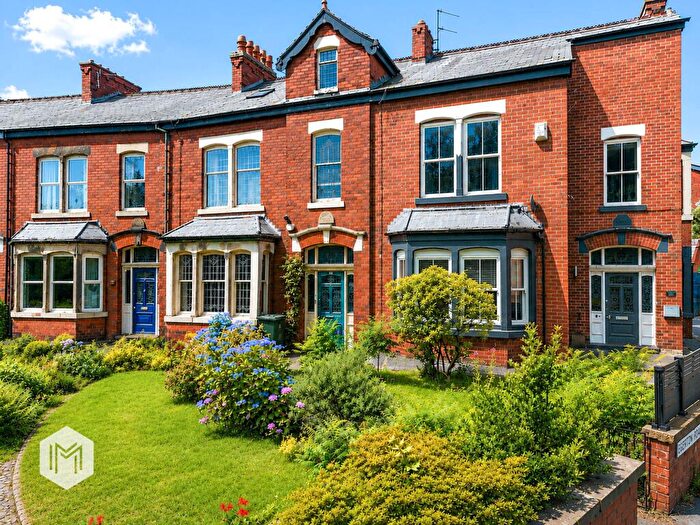
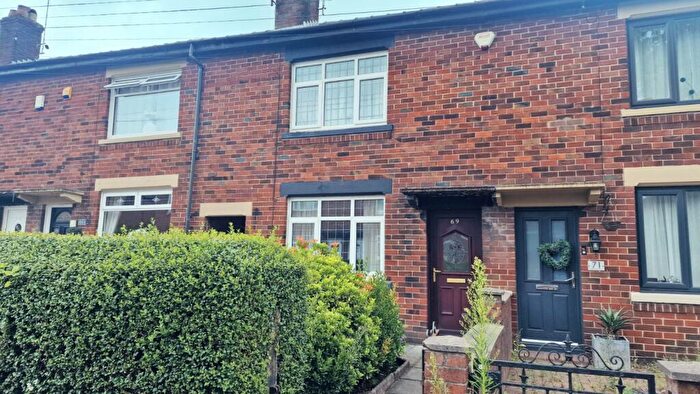
| Terraced House | £146,971.00 | 661 Terraced Houses |
| Flat | £133,226.00 | 84 Flats |
Transport near OL10

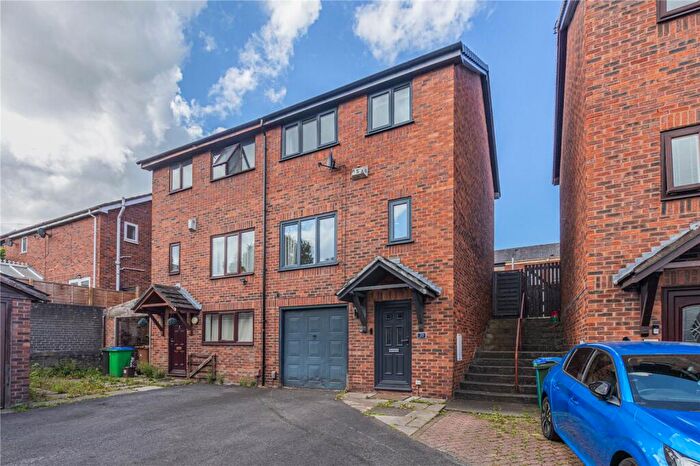
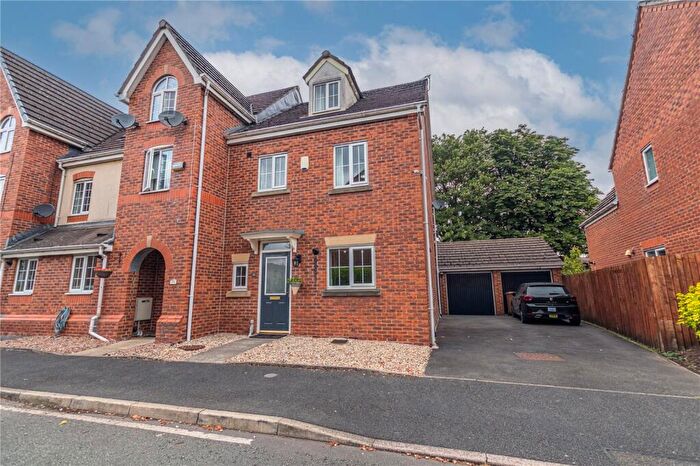
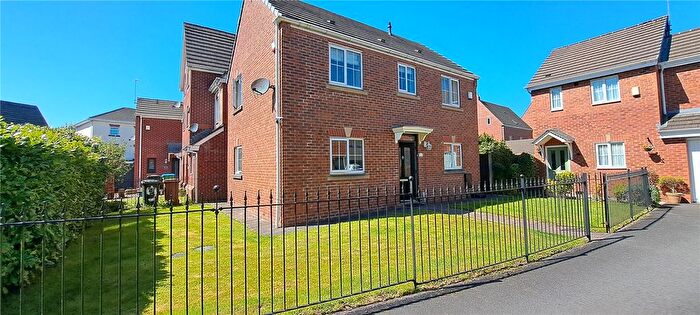
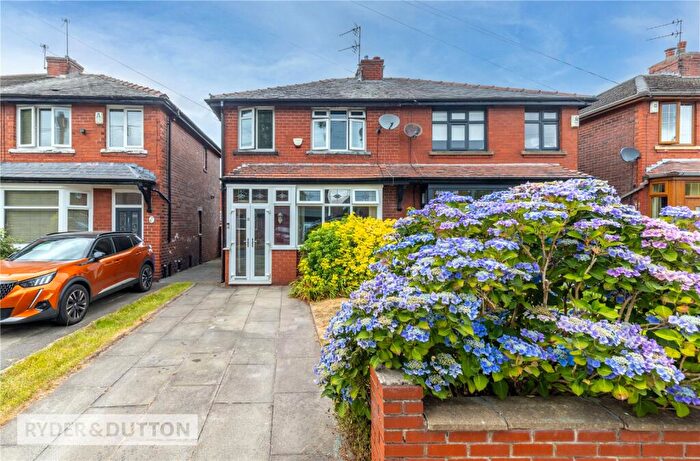
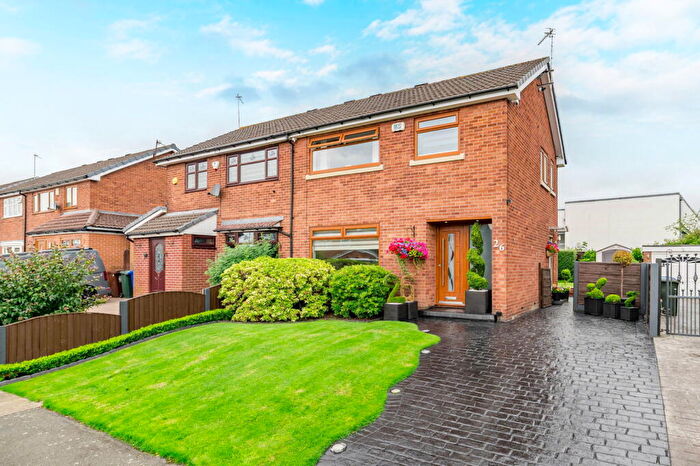
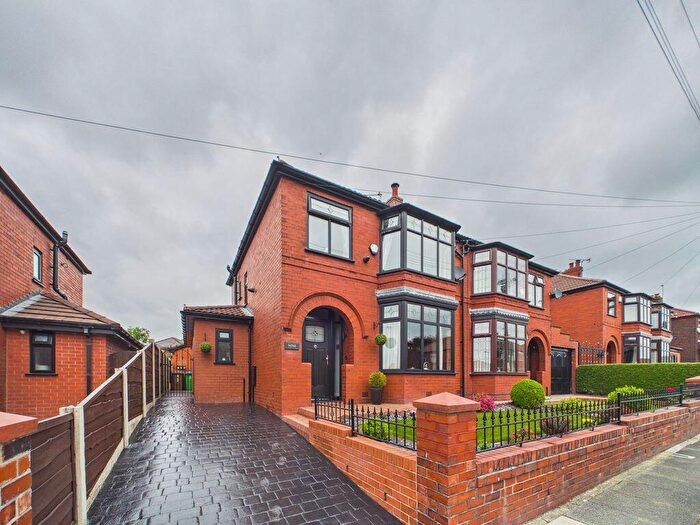
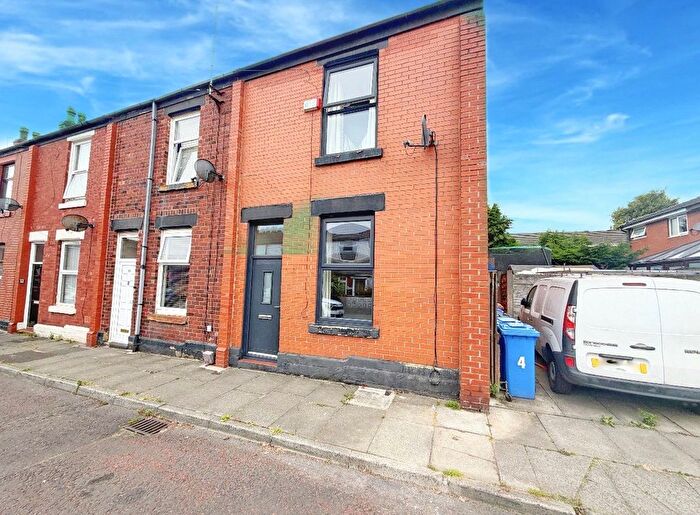
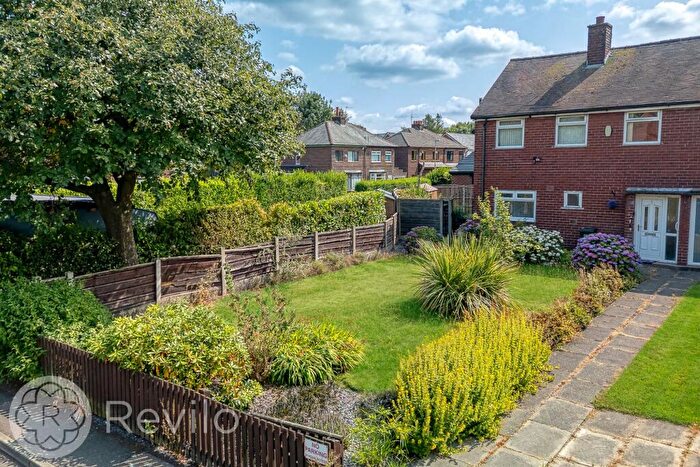
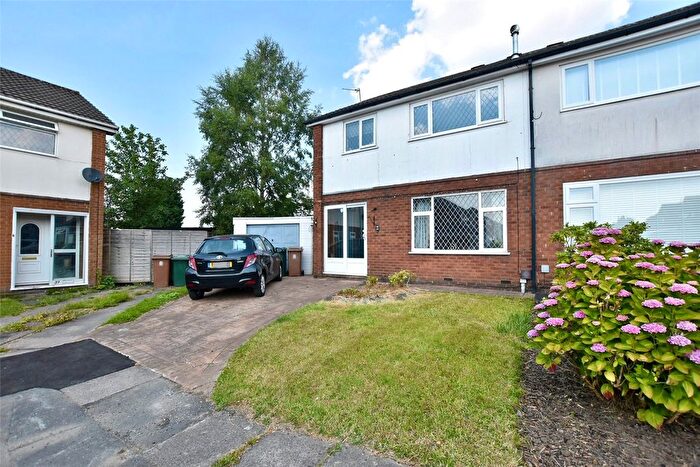
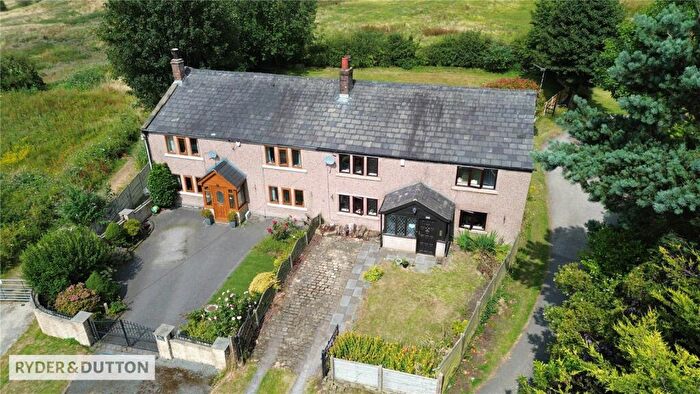
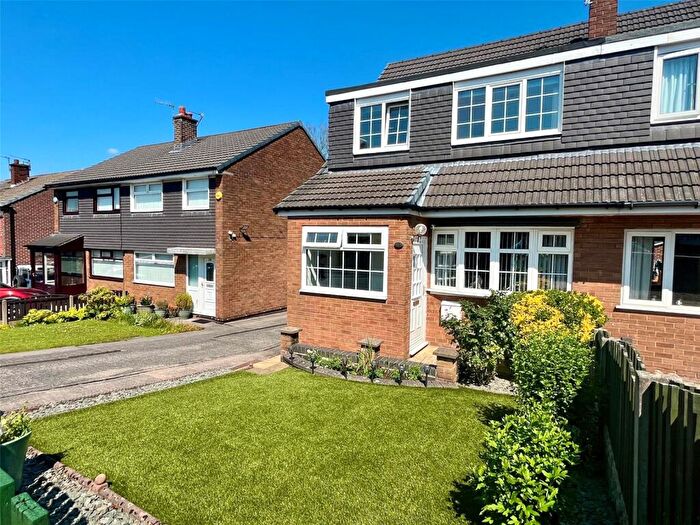
Houses and Flats for sale in OL10, Heywood
There are 102 results. Property prices in OL10 range from £80k to £1.35M with an average price of £322k.
![]()
If you are looking to sell your house, let it out, or receive a property valuation, an expert can help you.
Click the button below to get started.

Frequently Asked Questions about OL10
What is the average price for a property for sale in OL10?
The average price for a property for sale in OL10 is £184,381. There are 102 property listings for sale in OL10.
Which areas are included in the OL10 postcode district?
The main area within OL10 is Heywood.
What are the most common property types in OL10?
The most common property types in OL10 are Terraced Houses, Semi Detached Houses, Detached Houses and Flats.
What has been the average sold property price in OL10 over the last three years?
Terraced Houses in OL10 have an average sold price of £146,971, while Semi Detached Houses have an average of £209,958. Detached Houses have an average of £344,889 and Flats have an average of £133,226. The average sold property price in OL10 over the last three years is approximately £187,648.