
Properties for sale in OX1
Central and South Oxford, Kennington
- Info
- Price Paid By Year
- Property Type Price
- Transport
House Prices in OX1
Properties in OX1 have an average house price of £564,340.00 and had 532 Property Transactions within the last 3 years.
The most expensive property was sold for £2,400,000.00.
Property Price Paid in OX1 by Year
The average sold property price by year was:
| Year | Average Sold Price | Sold Properties |
|---|---|---|
| 2026 | £572,000.00 | 12 Properties |
| 2025 | £570,951.00 | 181 Properties |
| 2024 | £553,311.00 | 181 Properties |
| 2023 | £568,818.00 | 158 Properties |
| 2022 | £611,244.00 | 211 Properties |
| 2021 | £566,004.00 | 251 Properties |
| 2020 | £494,149.00 | 175 Properties |
| 2019 | £477,557.00 | 183 Properties |
| 2018 | £510,188.00 | 221 Properties |
| 2017 | £505,551.00 | 205 Properties |
| 2016 | £496,963.00 | 248 Properties |
| 2015 | £494,794.00 | 223 Properties |
| 2014 | £439,529.00 | 216 Properties |
| 2013 | £426,573.00 | 234 Properties |
| 2012 | £434,140.00 | 214 Properties |
| 2011 | £339,568.00 | 178 Properties |
| 2010 | £355,950.00 | 254 Properties |
| 2009 | £337,885.00 | 181 Properties |
| 2008 | £422,271.00 | 165 Properties |
| 2007 | £348,022.00 | 272 Properties |
| 2006 | £306,577.00 | 465 Properties |
| 2005 | £288,647.00 | 427 Properties |
| 2004 | £291,760.00 | 320 Properties |
| 2003 | £257,175.00 | 274 Properties |
| 2002 | £235,524.00 | 335 Properties |
| 2001 | £190,766.00 | 451 Properties |
| 2000 | £203,960.00 | 243 Properties |
| 1999 | £159,250.00 | 394 Properties |
| 1998 | £150,644.00 | 303 Properties |
| 1997 | £126,730.00 | 324 Properties |
| 1996 | £115,377.00 | 286 Properties |
| 1995 | £107,734.00 | 236 Properties |
Property Price per Property Type in OX1
Here you can find historic sold price data in order to help with your property search.
The average Property Paid Price for specific property types in the last three years are:
| Property Type | Average Sold Price | Sold Properties |
|---|---|---|
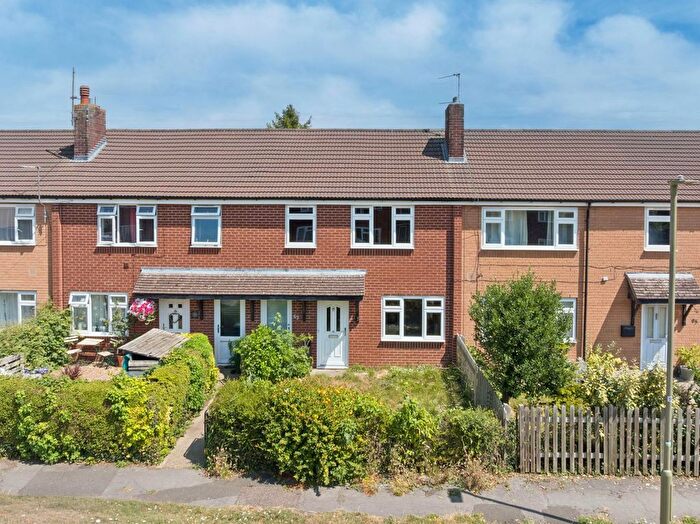
| Semi Detached House | £553,022.00 | 108 Semi Detached Houses |
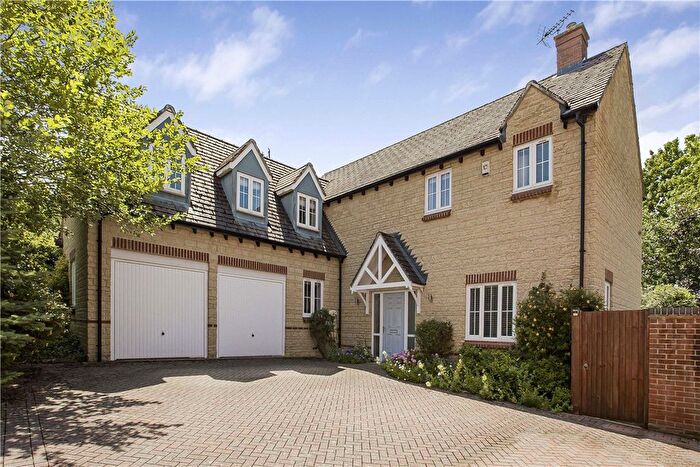
| Detached House | £732,926.00 | 116 Detached Houses |
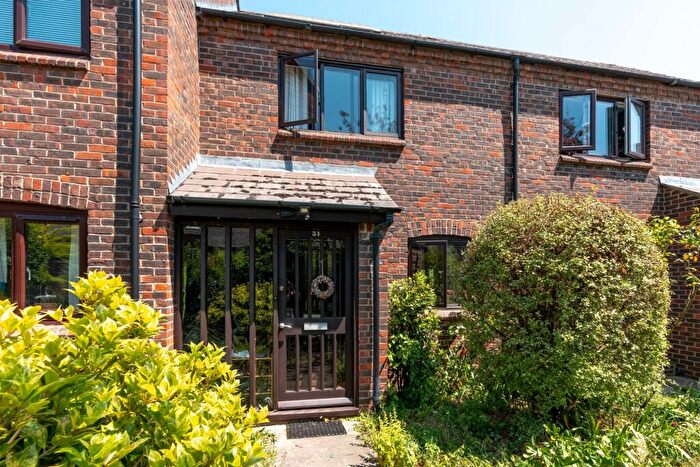
| Terraced House | £676,863.00 | 120 Terraced Houses |
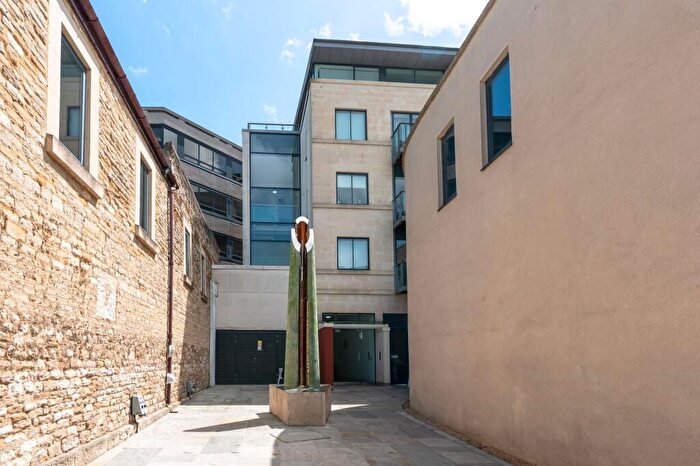
| Flat | £394,996.00 | 188 Flats |
Transport near OX1

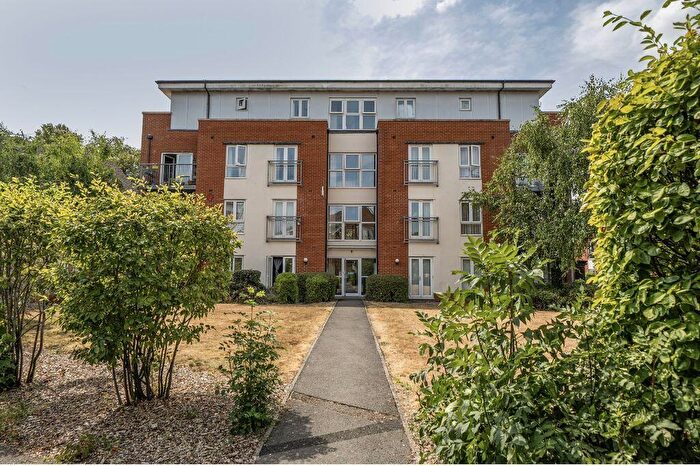
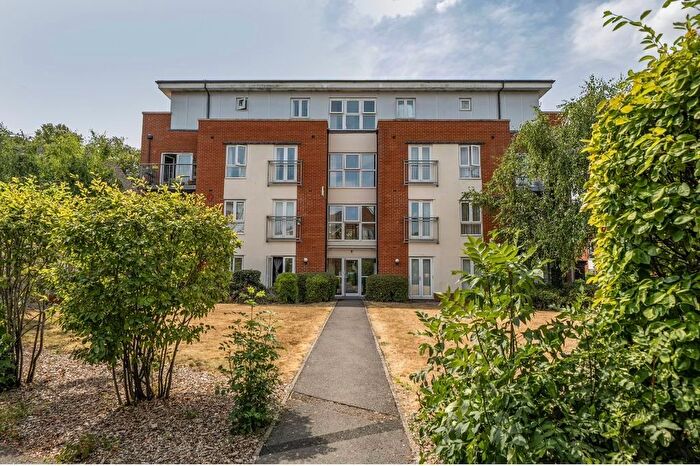
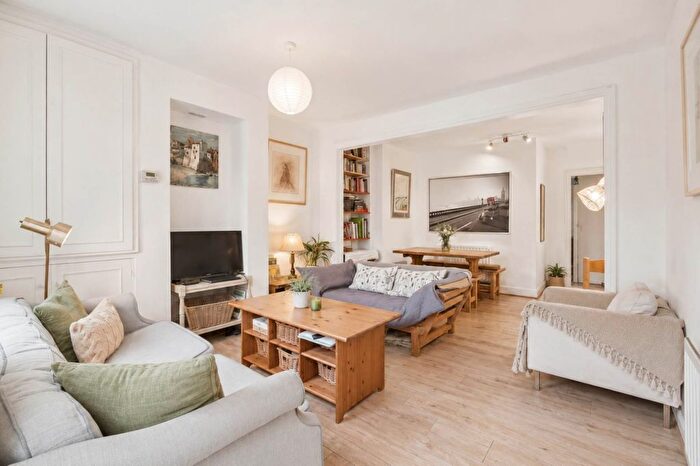
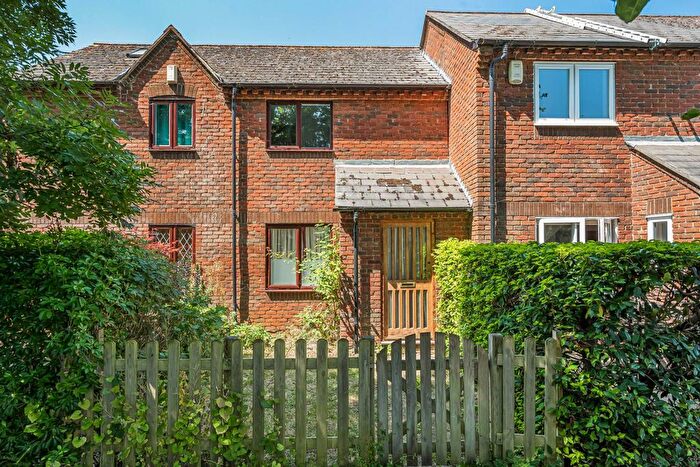
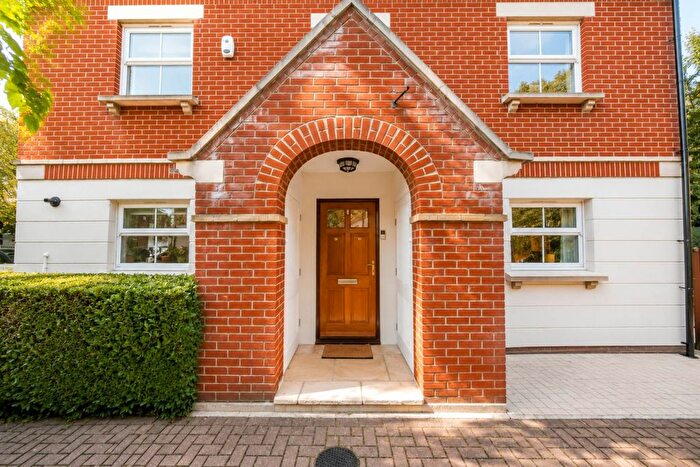
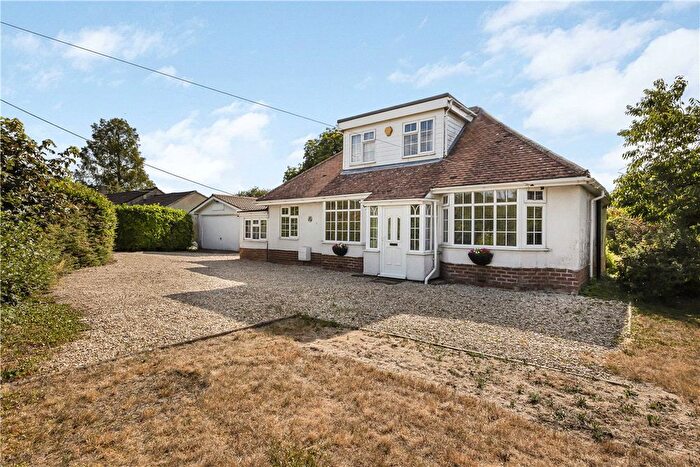
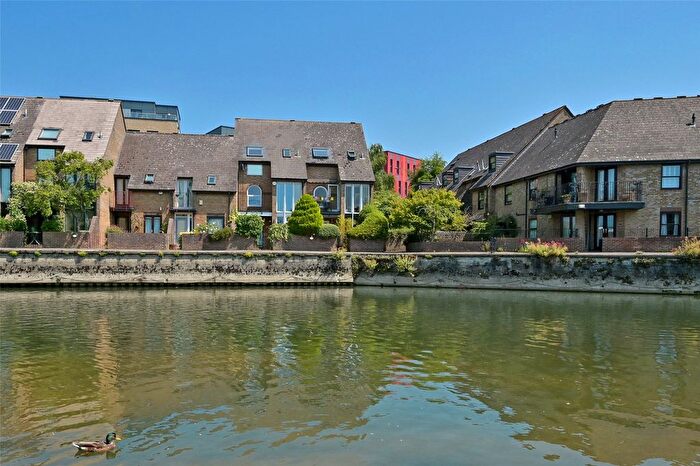
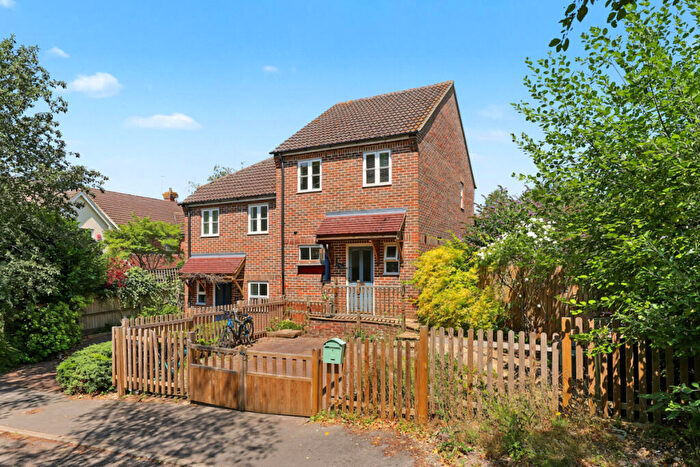
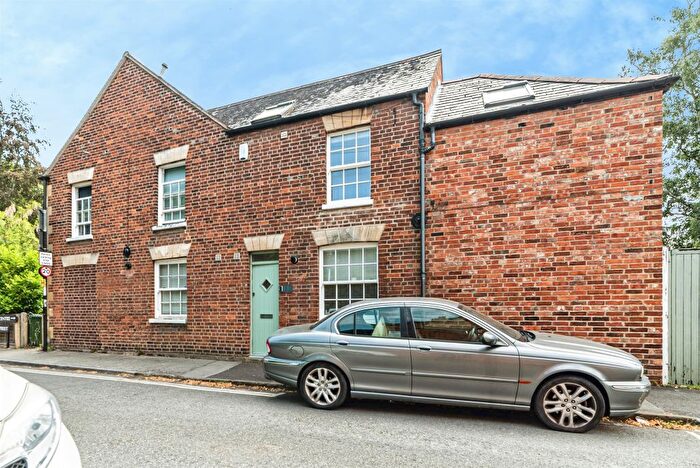
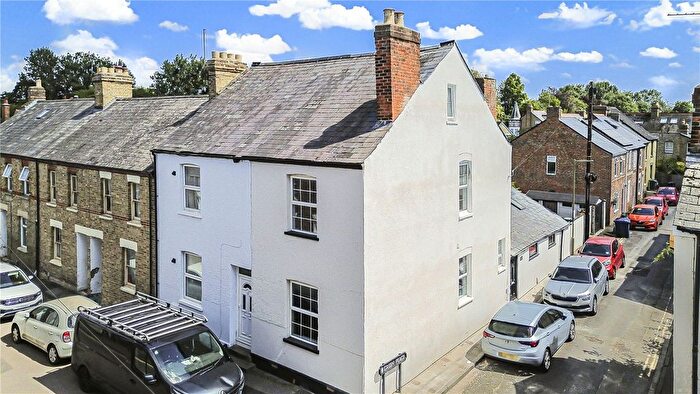
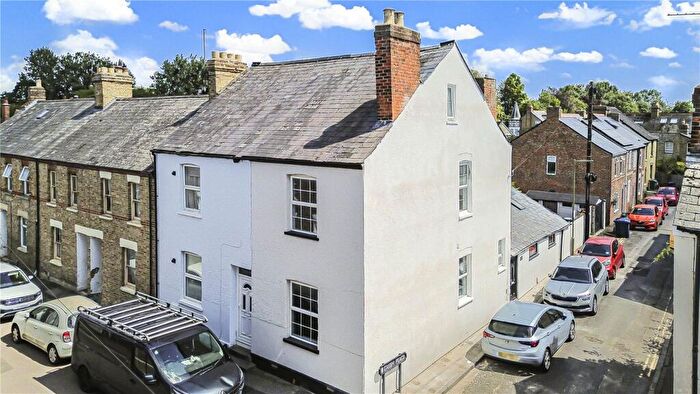
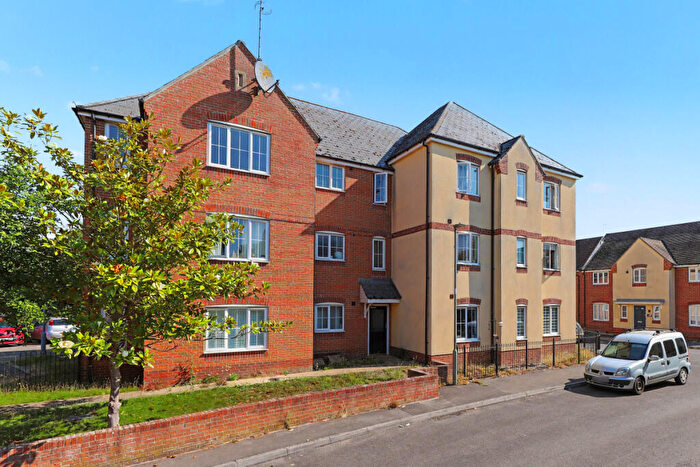
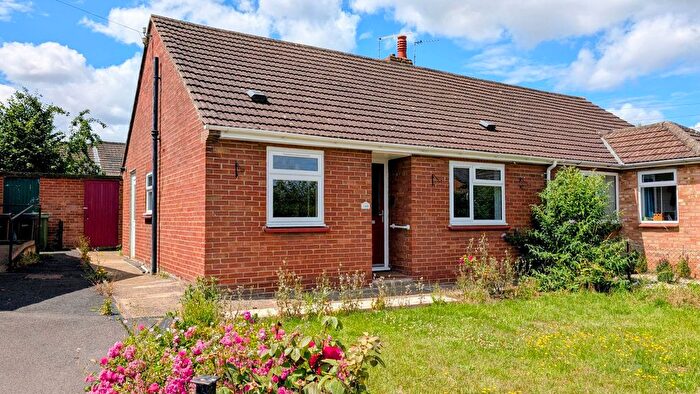
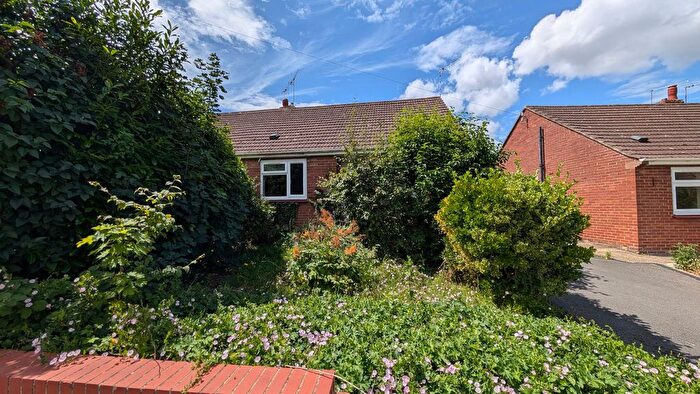
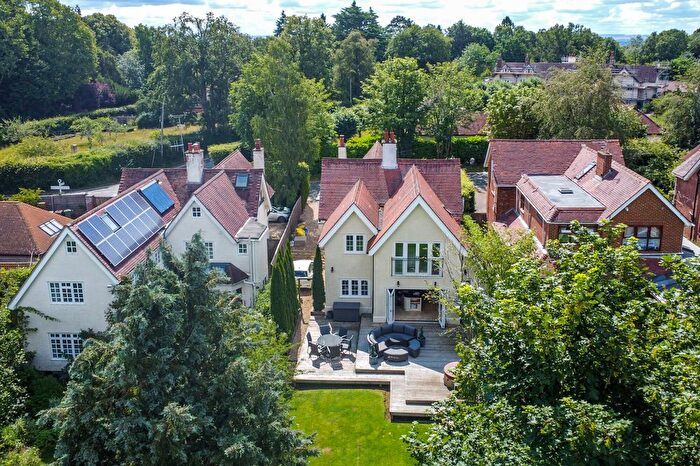
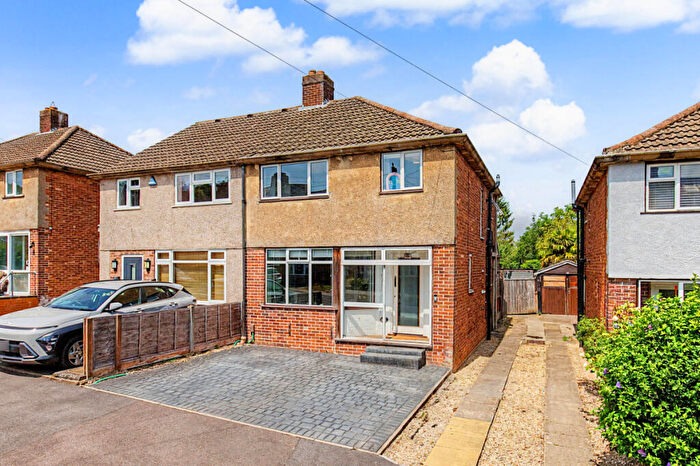
Houses and Flats for sale in OX1, Central and South Oxford, Kennington
There are 109 results. Property prices in OX1 range from £85k to £5.75M with an average price of £752k.
![]()
If you are looking to sell your house, let it out, or receive a property valuation, an expert can help you.
Click the button below to get started.


Frequently Asked Questions about OX1
What is the average price for a property for sale in OX1?
The average price for a property for sale in OX1 is £564,340. There are 109 property listings for sale in OX1.
Which areas are included in the OX1 postcode district?
The main areas within OX1 include Central and South Oxford and Kennington.
What are the most common property types in OX1?
The most common property types in OX1 are Flats, Terraced Houses, Detached Houses and Semi Detached Houses.
What has been the average sold property price in OX1 over the last three years?
Flats in OX1 have an average sold price of £394,996, while Terraced Houses have an average of £676,863. Detached Houses have an average of £732,926 and Semi Detached Houses have an average of £553,022. The average sold property price in OX1 over the last three years is approximately £565,421.
Which train stations are available in OX1?
The train stations available in OX1 are Appleford Station, Banbury Station, Cholsey Station, Culham Station, Didcot Parkway Station, King's Sutton Station, Oxford Station and Radley Station..