
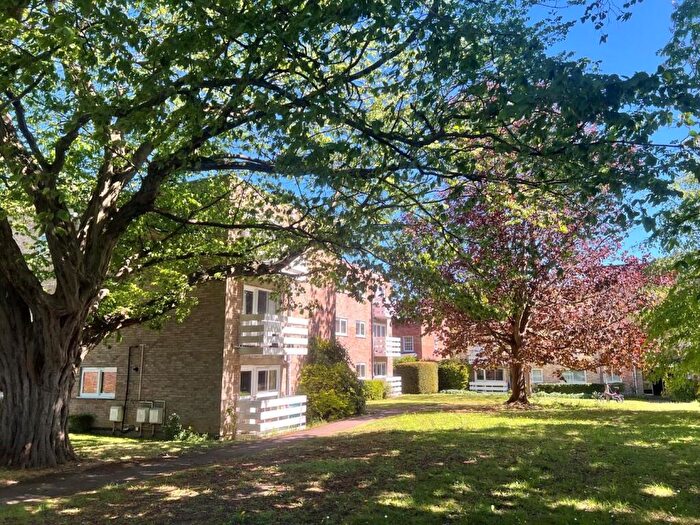
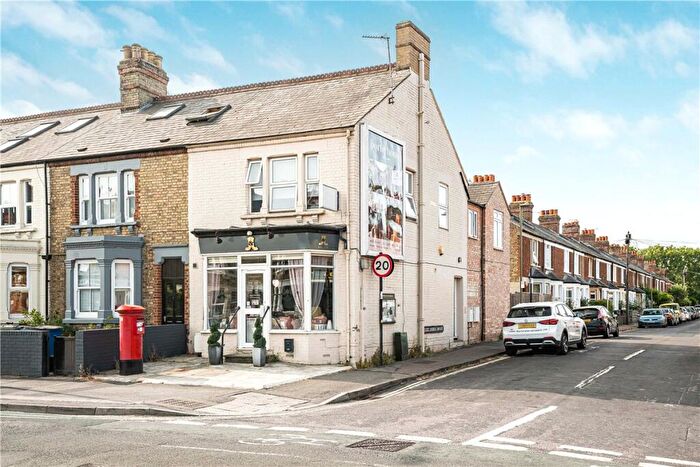
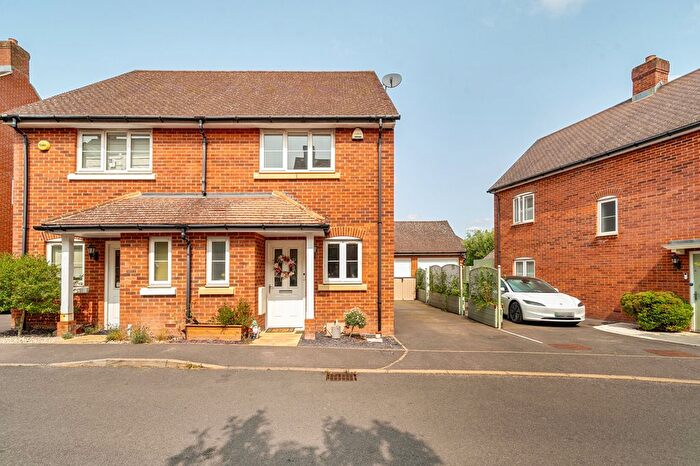
Properties for sale in OX2
North and West Oxford, Botley, North Hinksey, Summertown, Wytham
- Info
- Price Paid By Year
- Property Type Price
- Transport
House Prices in OX2
Properties in OX2 have an average house price of £802,256.00 and had 1419 Property Transactions within the last 3 years.
The most expensive property was sold for £7,350,000.00.
Property Price Paid in OX2 by Year
The average sold property price by year was:
| Year | Average Sold Price | Sold Properties |
|---|---|---|
| 2026 | £749,166.00 | 33 Properties |
| 2025 | £750,367.00 | 470 Properties |
| 2024 | £817,664.00 | 514 Properties |
| 2023 | £847,580.00 | 402 Properties |
| 2022 | £784,069.00 | 533 Properties |
| 2021 | £780,849.00 | 693 Properties |
| 2020 | £772,188.00 | 479 Properties |
| 2019 | £707,793.00 | 478 Properties |
| 2018 | £731,502.00 | 479 Properties |
| 2017 | £713,873.00 | 502 Properties |
| 2016 | £664,327.00 | 569 Properties |
| 2015 | £659,750.00 | 650 Properties |
| 2014 | £617,512.00 | 654 Properties |
| 2013 | £541,177.00 | 639 Properties |
| 2012 | £537,880.00 | 539 Properties |
| 2011 | £530,839.00 | 569 Properties |
| 2010 | £468,092.00 | 671 Properties |
| 2009 | £389,228.00 | 593 Properties |
| 2008 | £463,485.00 | 497 Properties |
| 2007 | £412,585.00 | 719 Properties |
| 2006 | £381,555.00 | 894 Properties |
| 2005 | £369,101.00 | 654 Properties |
| 2004 | £359,822.00 | 761 Properties |
| 2003 | £329,598.00 | 689 Properties |
| 2002 | £300,834.00 | 859 Properties |
| 2001 | £263,876.00 | 860 Properties |
| 2000 | £229,371.00 | 654 Properties |
| 1999 | £183,631.00 | 740 Properties |
| 1998 | £167,984.00 | 779 Properties |
| 1997 | £145,554.00 | 773 Properties |
| 1996 | £118,872.00 | 673 Properties |
| 1995 | £128,779.00 | 536 Properties |
Property Price per Property Type in OX2
Here you can find historic sold price data in order to help with your property search.
The average Property Paid Price for specific property types in the last three years are:
| Property Type | Average Sold Price | Sold Properties |
|---|---|---|
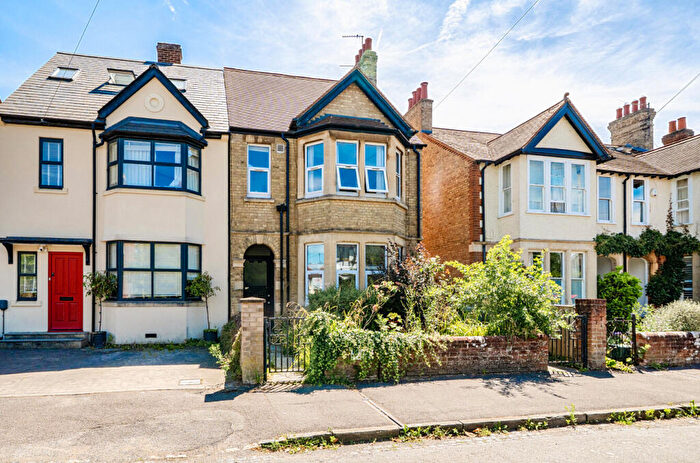
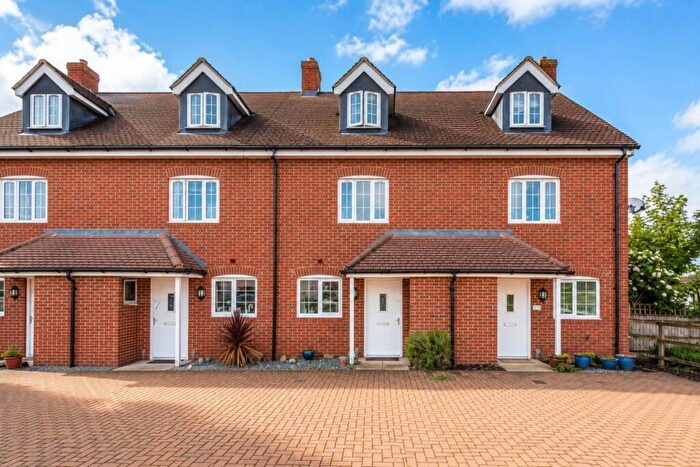
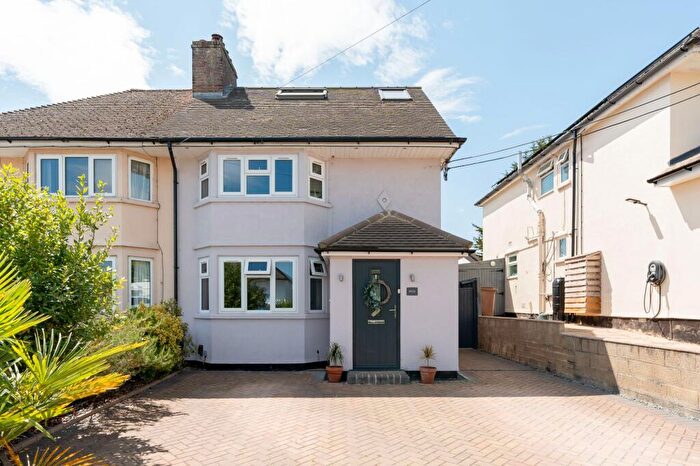
| Semi Detached House | £867,073.00 | 391 Semi Detached Houses |
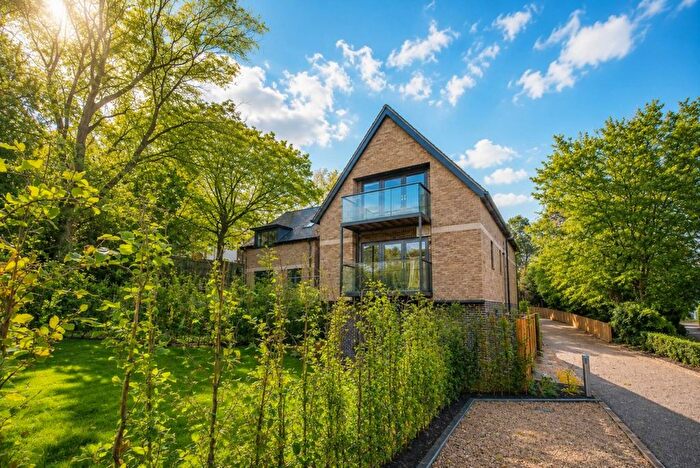
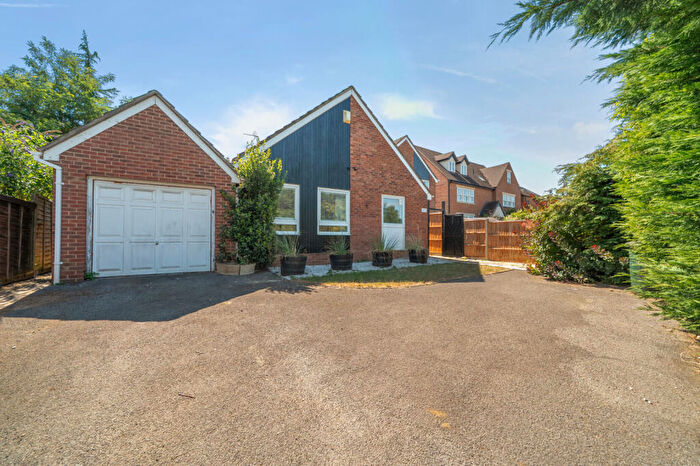
| Detached House | £1,235,014.00 | 304 Detached Houses |
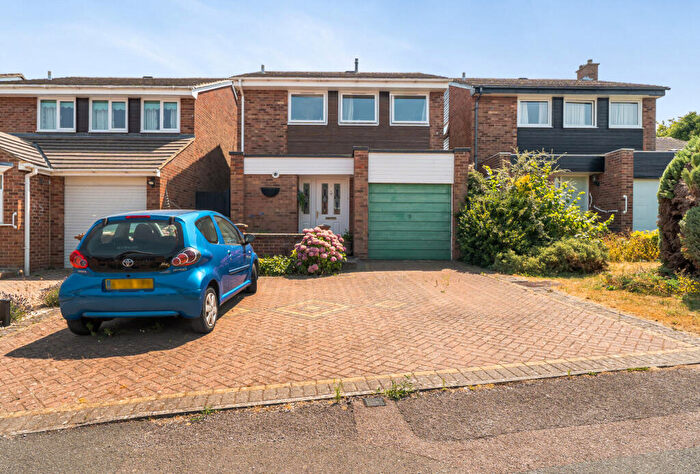
| Terraced House | £780,017.00 | 340 Terraced Houses |
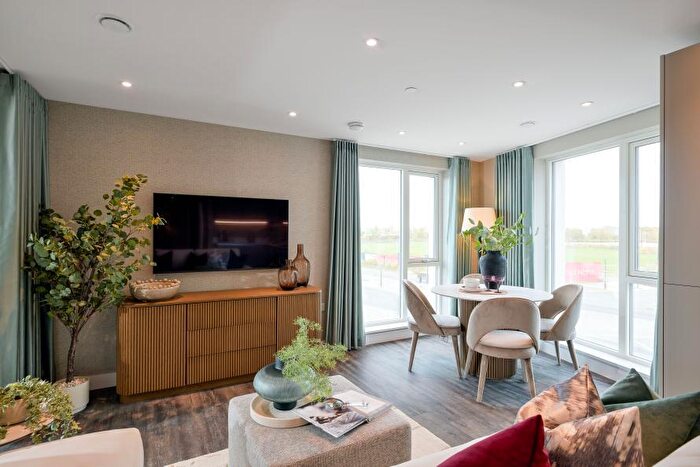
| Flat | £413,350.00 | 384 Flats |
Transport near OX2

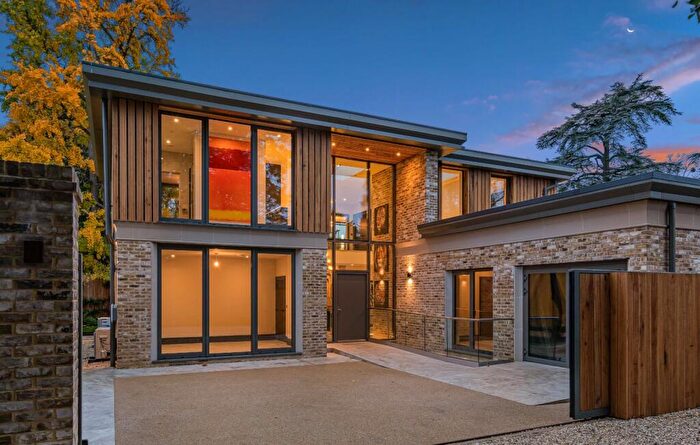
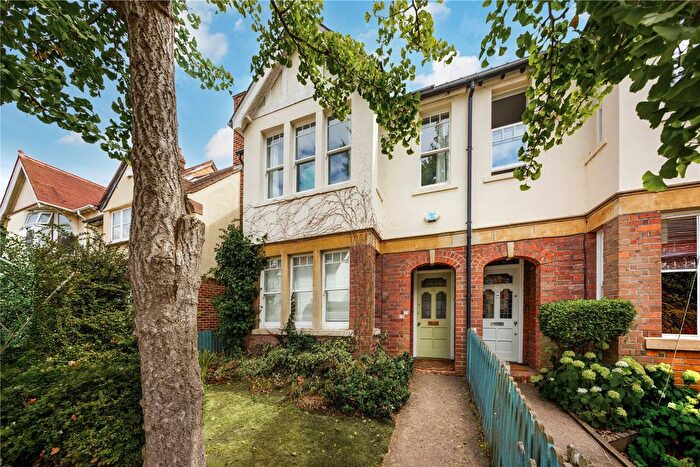
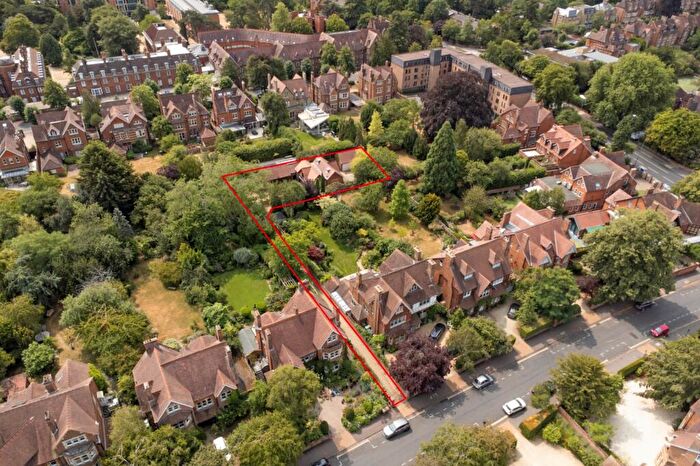
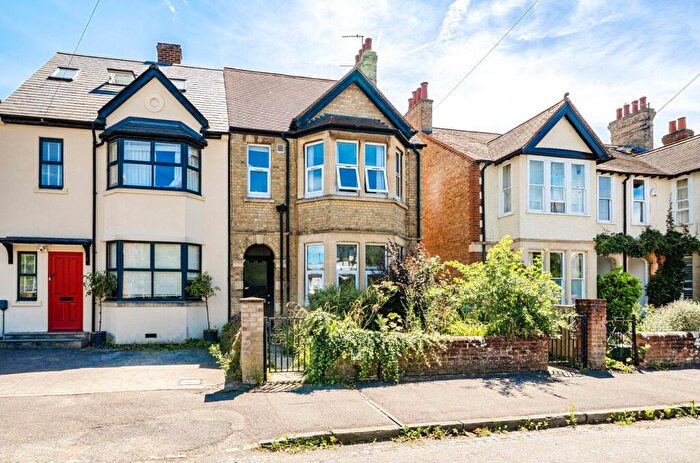
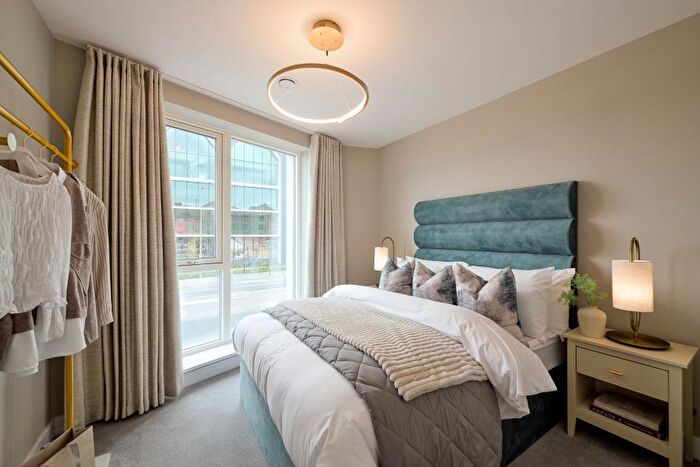
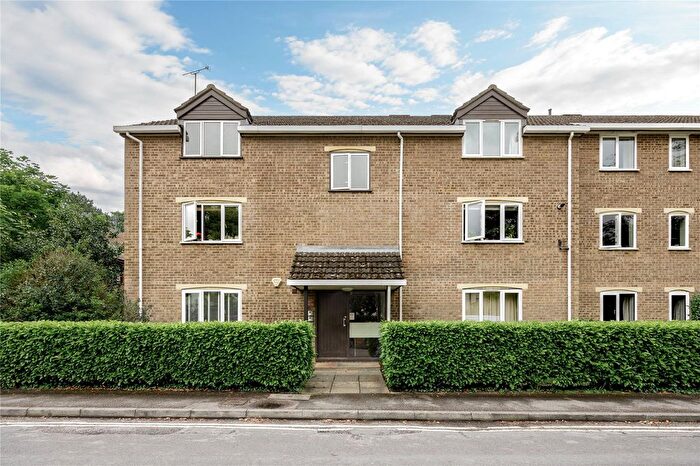
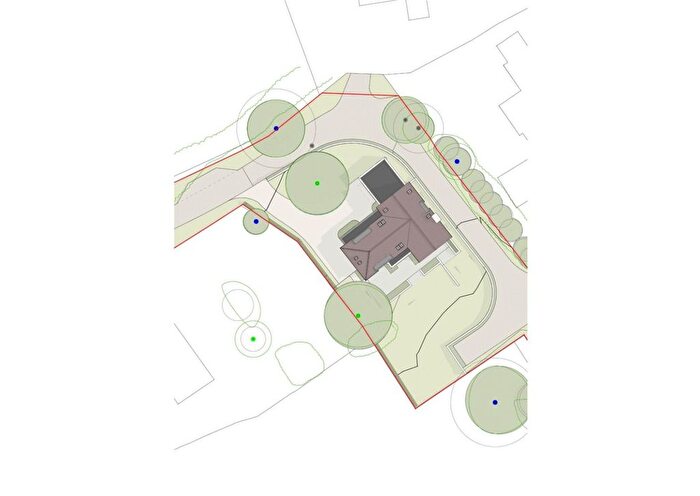
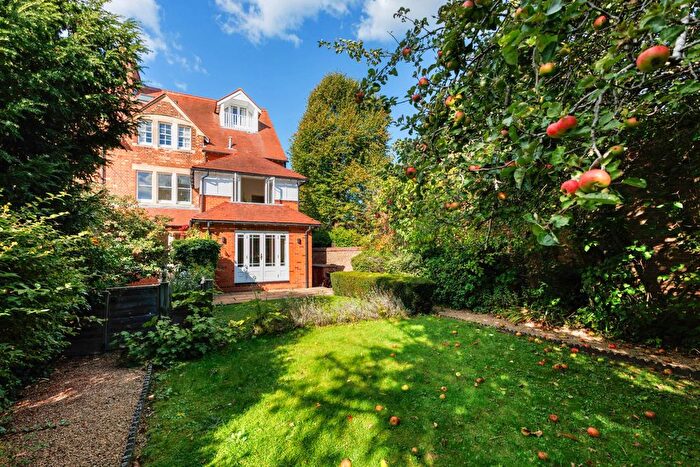
Houses and Flats for sale in OX2, North and West Oxford, Botley, North Hinksey, Summertown
There are 224 results. Property prices in OX2 range from £103k to £5.95M with an average price of £762k.
![]()
If you are looking to sell your house, let it out, or receive a property valuation, an expert can help you.
Click the button below to get started.


Frequently Asked Questions about OX2
What is the average price for a property for sale in OX2?
The average price for a property for sale in OX2 is £802,256. There are 224 property listings for sale in OX2.
Which areas are included in the OX2 postcode district?
The main areas within OX2 include North and West Oxford, Botley, North Hinksey, Summertown and Wytham.
What are the most common property types in OX2?
The most common property types in OX2 are Semi Detached Houses, Flats, Terraced Houses and Detached Houses.
What has been the average sold property price in OX2 over the last three years?
Semi Detached Houses in OX2 have an average sold price of £867,073, while Flats have an average of £413,350. Terraced Houses have an average of £780,017 and Detached Houses have an average of £1,235,014. The average sold property price in OX2 over the last three years is approximately £772,399.
Which train stations are available in OX2?
The train stations available in OX2 are Bicester North Station, Bicester Village Station, Hanborough Station and Oxford Parkway Station..