
Properties for sale in OX3
North East Oxford, Headington, Marston, Elsfield
- Info
- Price Paid By Year
- Property Type Price
- Transport
House Prices in OX3
Properties in OX3 have an average house price of £491,649.00 and had 1300 Property Transactions within the last 3 years.
The most expensive property was sold for £8,100,000.00.
Property Price Paid in OX3 by Year
The average sold property price by year was:
| Year | Average Sold Price | Sold Properties |
|---|---|---|
| 2026 | £457,360.00 | 25 Properties |
| 2025 | £506,307.00 | 403 Properties |
| 2024 | £475,393.00 | 502 Properties |
| 2023 | £500,057.00 | 370 Properties |
| 2022 | £517,479.00 | 456 Properties |
| 2021 | £463,917.00 | 536 Properties |
| 2020 | £481,127.00 | 373 Properties |
| 2019 | £440,724.00 | 430 Properties |
| 2018 | £436,137.00 | 464 Properties |
| 2017 | £446,792.00 | 413 Properties |
| 2016 | £446,976.00 | 466 Properties |
| 2015 | £409,799.00 | 536 Properties |
| 2014 | £373,904.00 | 595 Properties |
| 2013 | £321,729.00 | 529 Properties |
| 2012 | £312,222.00 | 434 Properties |
| 2011 | £299,357.00 | 471 Properties |
| 2010 | £294,828.00 | 480 Properties |
| 2009 | £275,977.00 | 494 Properties |
| 2008 | £284,355.00 | 457 Properties |
| 2007 | £285,021.00 | 737 Properties |
| 2006 | £264,195.00 | 834 Properties |
| 2005 | £234,654.00 | 721 Properties |
| 2004 | £247,522.00 | 729 Properties |
| 2003 | £234,501.00 | 715 Properties |
| 2002 | £198,420.00 | 702 Properties |
| 2001 | £158,043.00 | 713 Properties |
| 2000 | £153,249.00 | 631 Properties |
| 1999 | £122,833.00 | 834 Properties |
| 1998 | £115,195.00 | 690 Properties |
| 1997 | £96,358.00 | 662 Properties |
| 1996 | £88,561.00 | 641 Properties |
| 1995 | £91,085.00 | 482 Properties |
Property Price per Property Type in OX3
Here you can find historic sold price data in order to help with your property search.
The average Property Paid Price for specific property types in the last three years are:
| Property Type | Average Sold Price | Sold Properties |
|---|---|---|
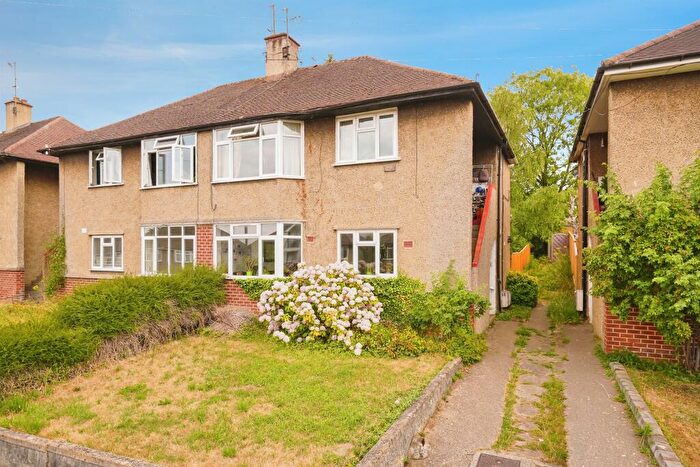
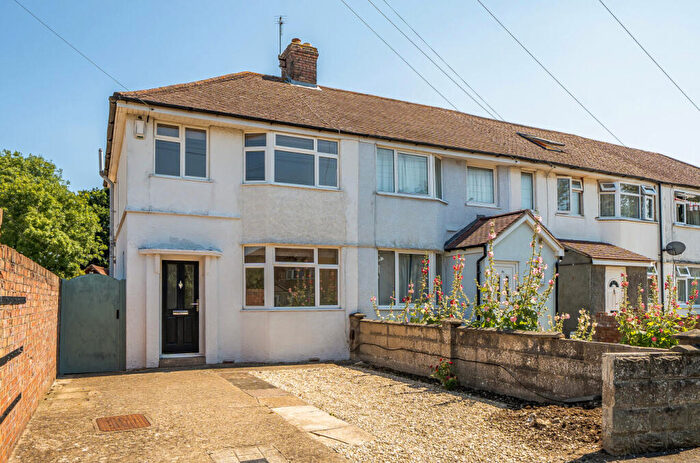
| Semi Detached House | £521,371.00 | 530 Semi Detached Houses |
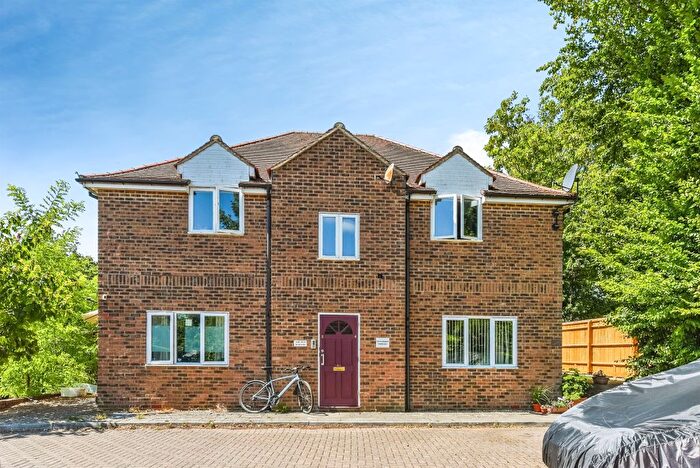
| Detached House | £917,891.00 | 168 Detached Houses |
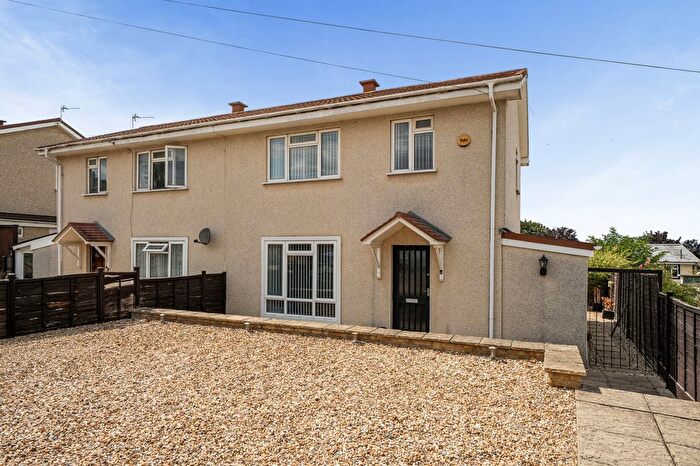
| Terraced House | £426,212.00 | 265 Terraced Houses |
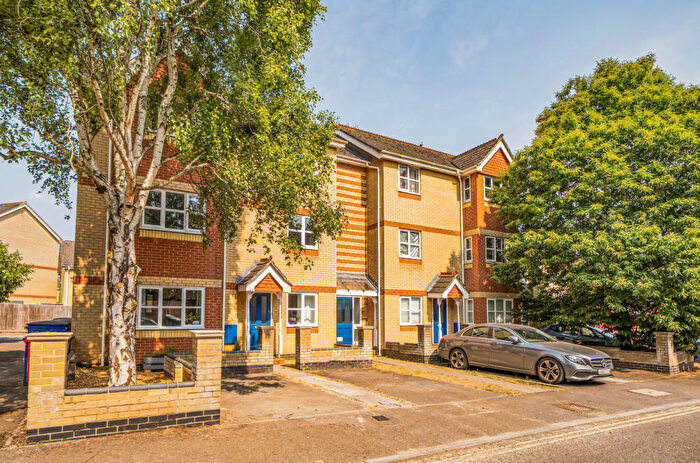
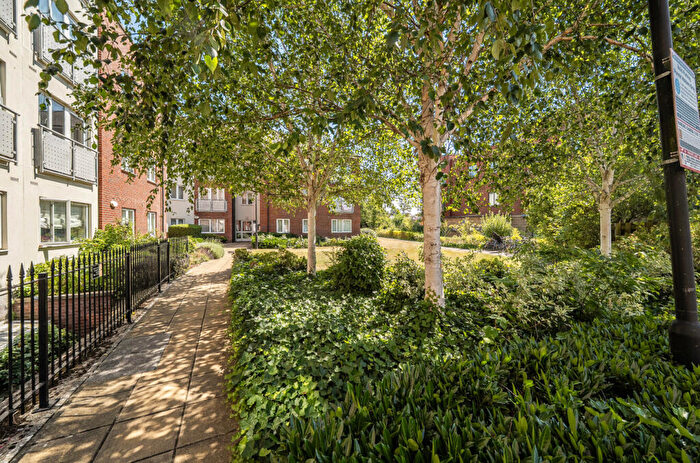
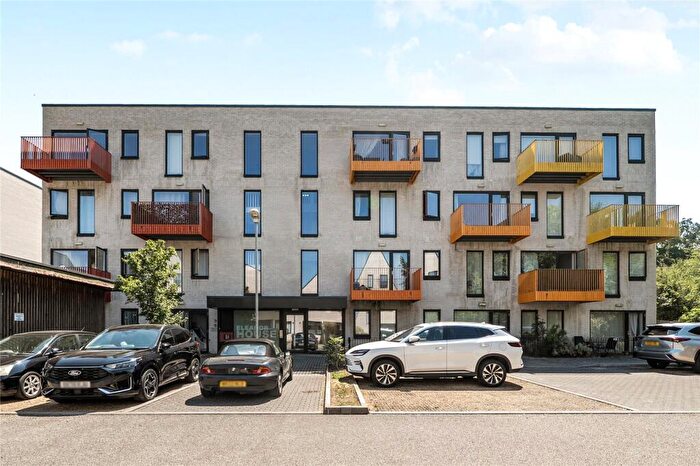
| Flat | £283,875.00 | 337 Flats |
Transport near OX3

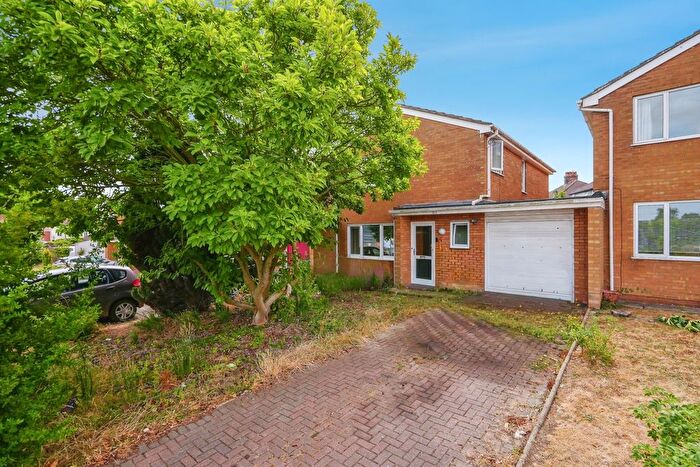
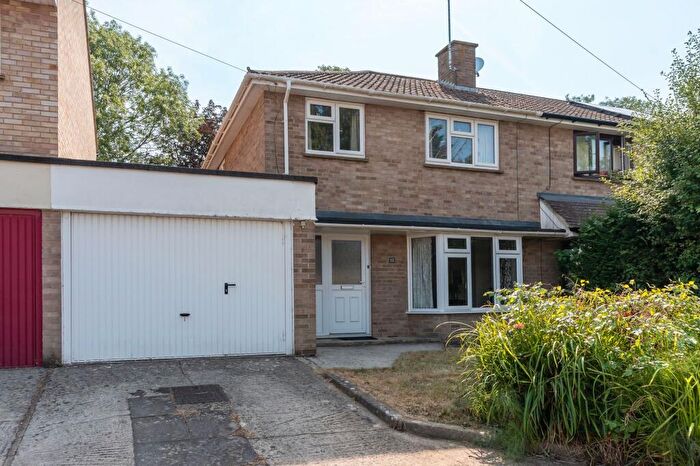
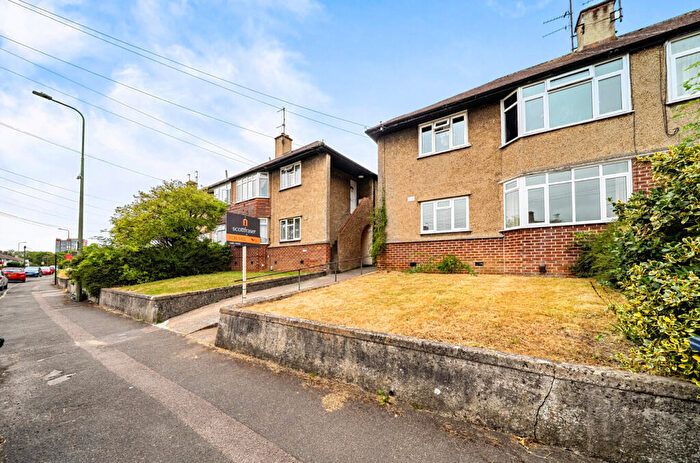
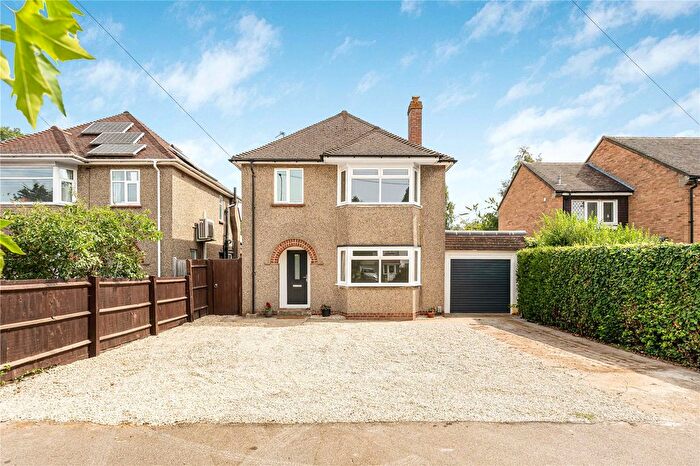
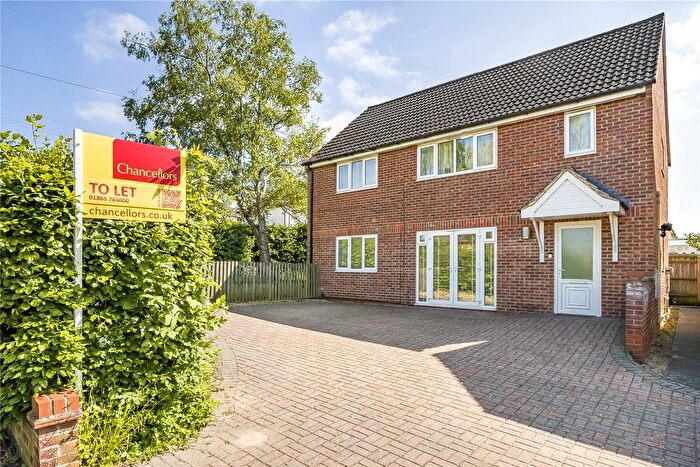
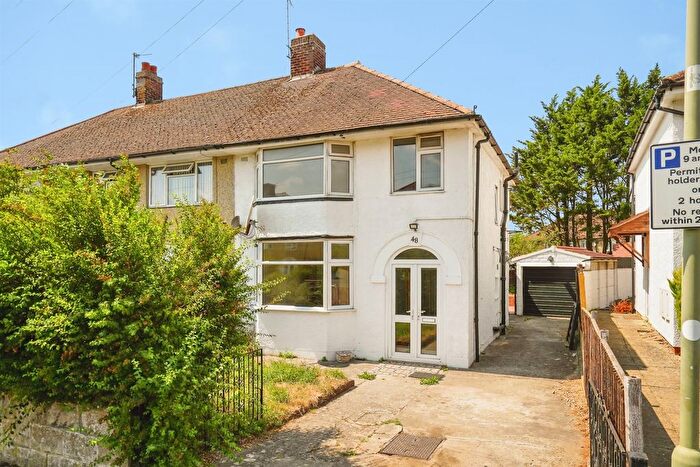
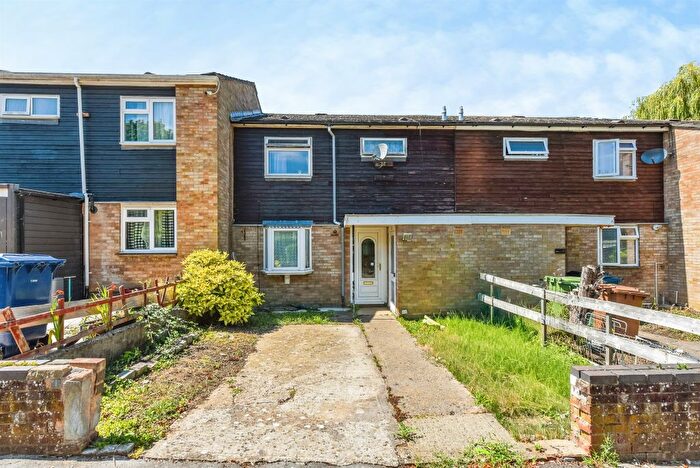
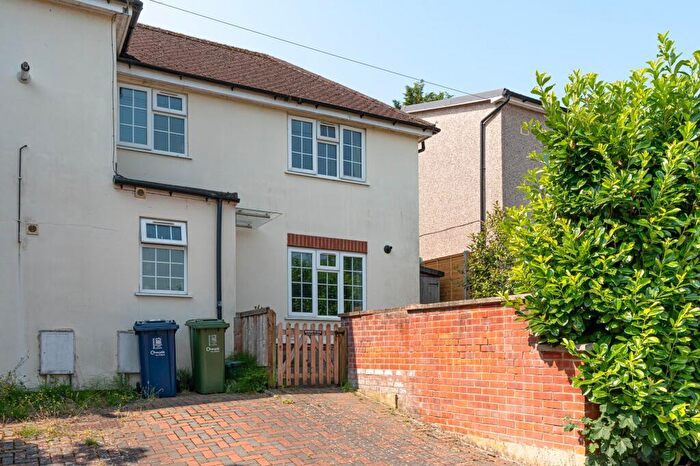
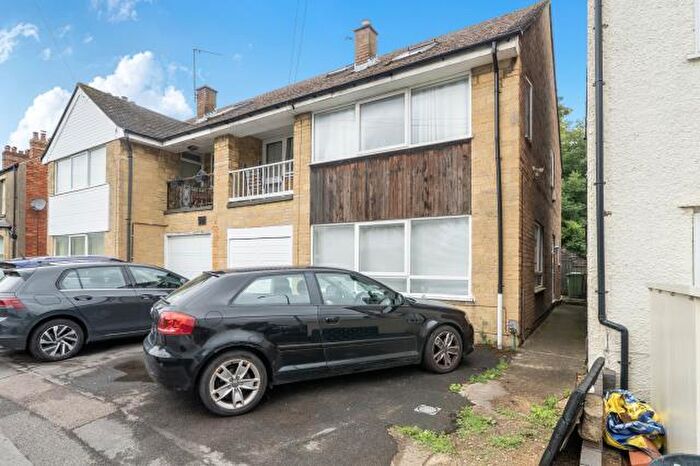
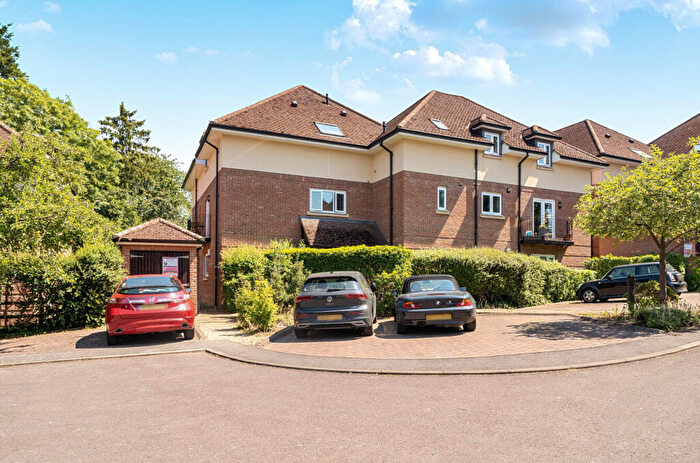
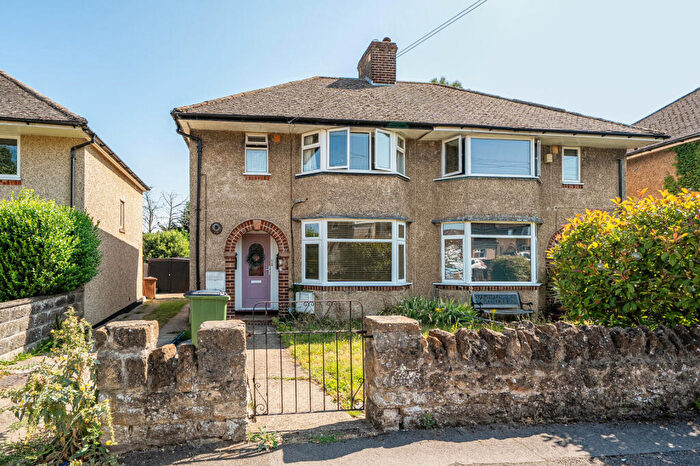
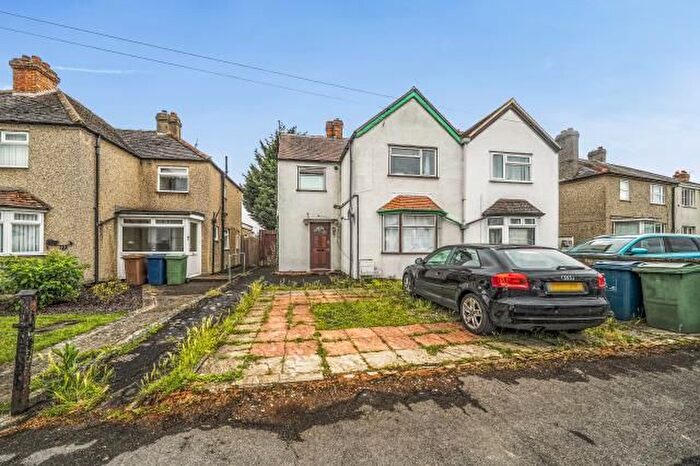
Houses and Flats for sale in OX3, North East Oxford, Headington, Marston, Elsfield
There are 220 results. Property prices in OX3 range from £64k to £1.98M with an average price of £486k.

![]()
If you are looking to sell your house, let it out, or receive a property valuation, an expert can help you.
Click the button below to get started.
Frequently Asked Questions about OX3
What is the average price for a property for sale in OX3?
The average price for a property for sale in OX3 is £491,649. There are 220 property listings for sale in OX3.
Which areas are included in the OX3 postcode district?
The main areas within OX3 include North East Oxford, Headington, Marston and Elsfield.
What are the most common property types in OX3?
The most common property types in OX3 are Semi Detached Houses, Flats, Terraced Houses and Detached Houses.
What has been the average sold property price in OX3 over the last three years?
Semi Detached Houses in OX3 have an average sold price of £521,371, while Flats have an average of £283,875. Terraced Houses have an average of £426,212 and Detached Houses have an average of £917,891. The average sold property price in OX3 over the last three years is approximately £479,687.
Which train stations are available in OX3?
The train station available in OX3 is Ascott-Under-Wychwood Station..