
Properties for sale in SE
South East London
- Info
- Price Paid By Year
- Property Type Price
House Prices in SE
Properties in SE have an average house price of £553,602 and had 39202 Property Transactions within the last 3 years.
The most expensive property was sold for £11,193,728.
Property Price Paid in SE by Year
The average sold property price by year was:
| Year | Average Sold Price | Sold Properties |
|---|---|---|
| 2026 | £547,810.00 | 4,983 Properties |
| 2025 | £558,033.00 | 12,312 Properties |
| 2024 | £559,312.00 | 11,739 Properties |
| 2023 | £544,482.00 | 10,168 Properties |
| 2022 | £562,558.00 | 13,131 Properties |
| 2021 | £549,665.00 | 15,278 Properties |
| 2020 | £570,009.00 | 11,400 Properties |
| 2019 | £549,485.00 | 13,145 Properties |
| 2018 | £542,467.00 | 14,153 Properties |
| 2017 | £520,342.00 | 14,591 Properties |
| 2016 | £493,755.00 | 15,427 Properties |
| 2015 | £446,031.00 | 17,123 Properties |
| 2014 | £397,360.00 | 16,948 Properties |
| 2013 | £354,834.00 | 14,865 Properties |
| 2012 | £328,106.00 | 11,652 Properties |
| 2011 | £321,401.00 | 10,611 Properties |
| 2010 | £315,582.00 | 10,197 Properties |
| 2009 | £280,431.00 | 7,790 Properties |
| 2008 | £278,743.00 | 9,466 Properties |
| 2007 | £276,218.00 | 20,793 Properties |
| 2006 | £246,936.00 | 20,985 Properties |
| 2005 | £230,046.00 | 17,386 Properties |
| 2004 | £217,526.00 | 20,210 Properties |
| 2003 | £202,221.00 | 18,699 Properties |
| 2002 | £183,678.00 | 21,389 Properties |
| 2001 | £162,345.00 | 20,194 Properties |
| 2000 | £140,993.00 | 18,711 Properties |
| 1999 | £114,963.00 | 19,475 Properties |
| 1998 | £99,217.00 | 16,796 Properties |
| 1997 | £85,541.00 | 16,983 Properties |
| 1996 | £75,663.00 | 13,560 Properties |
| 1995 | £69,937.00 | 10,778 Properties |
Property Price per Property Type in SE
Here you can find historic sold price data in order to help with your property search.
The average Property Paid Price for specific property types in the last three years are:
| Property Type | Average Sold Price | Sold Properties |
|---|---|---|
| Detached House | £1,208,593.00 | 721 Detached Houses |
| Flat | £428,075.00 | 23,572 Flats |
| Semi Detached House | £839,661.00 | 3,486 Semi Detached Houses |
| Terraced House | £683,994.00 | 11,423 Terraced Houses |
Houses and Flats for sale in SE, South East London

There are 8,547 results. Property prices in SE range from £175k to £3.5M with an average price of £570k.
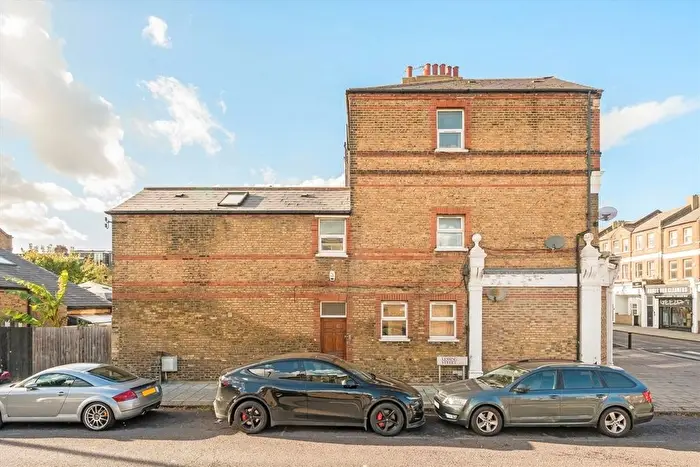

 3 Bedrooms
 2 Bathrooms


If you are looking to sell your house, let it out, or receive a property valuation, an expert can help you.
Click the button below to get started.





Postcode districts in SE, South East London
Navigate through our locations to find the location of your next house in SE, South East London, England for sale or to rent.
Transport in SE, South East London
Please see below transportation links in this area:
-

 Brockley Station
-
St Johns Station
-
St.John's Station
-
New Cross Gate Station
-
New Cross Station
-
 Elverson Road Station
-
Deptford Bridge Station
-
Lewisham Station
-
Crofton Park Station
-
Nunhead Station
Frequently asked questions about SE
What is the average price for a property for sale in SE?
The average price for a property for sale in SE is £553,602. This amount is 54% higher than the average price in England. There are 8,547 property listings for sale in SE.
What locations have the most expensive properties for sale in SE?
The locations with the most expensive properties for sale in SE are SE21 at an average of £1,025,487, SE24 at an average of £910,899 and SE22 at an average of £778,937.
What locations have the most affordable properties for sale in SE?
The locations with the most affordable properties for sale in SE are SE28 at an average of £323,075, SE25 at an average of £381,374 and SE2 at an average of £400,053.
Which train stations are available in or near SE?
Some of the train stations available in or near SE are Brockley, St Johns and St.John's.