
Properties for sale in TQ14
Teignmouth
- Info
- Price Paid By Year
- Property Type Price
- Transport
House Prices in TQ14
Properties in TQ14 have an average house price of £351,195.00 and had 1043 Property Transactions within the last 3 years.
The most expensive property was sold for £2,100,000.00.
Property Price Paid in TQ14 by Year
The average sold property price by year was:
| Year | Average Sold Price | Sold Properties |
|---|---|---|
| 2026 | £318,981.00 | 27 Properties |
| 2025 | £355,314.00 | 299 Properties |
| 2024 | £355,845.00 | 378 Properties |
| 2023 | £344,943.00 | 339 Properties |
| 2022 | £353,837.00 | 426 Properties |
| 2021 | £336,646.00 | 578 Properties |
| 2020 | £335,019.00 | 358 Properties |
| 2019 | £286,850.00 | 408 Properties |
| 2018 | £296,937.00 | 452 Properties |
| 2017 | £293,936.00 | 471 Properties |
| 2016 | £259,469.00 | 485 Properties |
| 2015 | £257,755.00 | 514 Properties |
| 2014 | £244,475.00 | 491 Properties |
| 2013 | £229,675.00 | 486 Properties |
| 2012 | £238,525.00 | 386 Properties |
| 2011 | £230,791.00 | 358 Properties |
| 2010 | £242,341.00 | 415 Properties |
| 2009 | £213,519.00 | 405 Properties |
| 2008 | £223,773.00 | 328 Properties |
| 2007 | £239,366.00 | 602 Properties |
| 2006 | £215,106.00 | 625 Properties |
| 2005 | £216,383.00 | 428 Properties |
| 2004 | £202,407.00 | 552 Properties |
| 2003 | £170,828.00 | 526 Properties |
| 2002 | £152,050.00 | 580 Properties |
| 2001 | £122,610.00 | 573 Properties |
| 2000 | £101,794.00 | 560 Properties |
| 1999 | £93,397.00 | 631 Properties |
| 1998 | £78,117.00 | 486 Properties |
| 1997 | £76,527.00 | 555 Properties |
| 1996 | £66,509.00 | 464 Properties |
| 1995 | £69,985.00 | 391 Properties |
Property Price per Property Type in TQ14
Here you can find historic sold price data in order to help with your property search.
The average Property Paid Price for specific property types in the last three years are:
| Property Type | Average Sold Price | Sold Properties |
|---|---|---|
| Semi Detached House | £334,846.00 | 144 Semi Detached Houses |
| Detached House | £497,436.00 | 385 Detached Houses |
| Terraced House | £285,636.00 | 235 Terraced Houses |
| Flat | £213,052.00 | 279 Flats |
Transport near TQ14

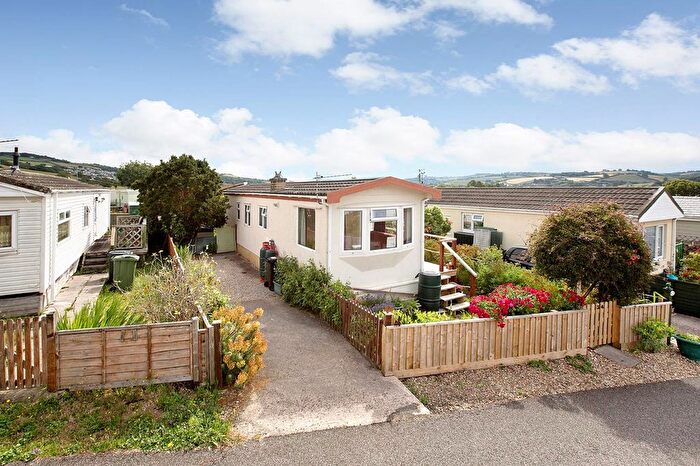
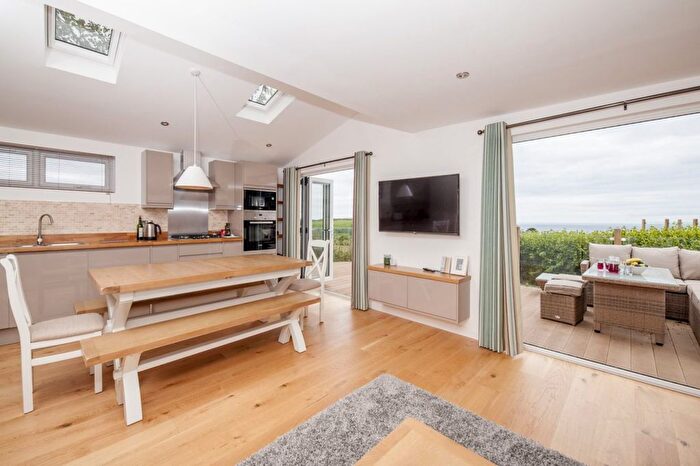
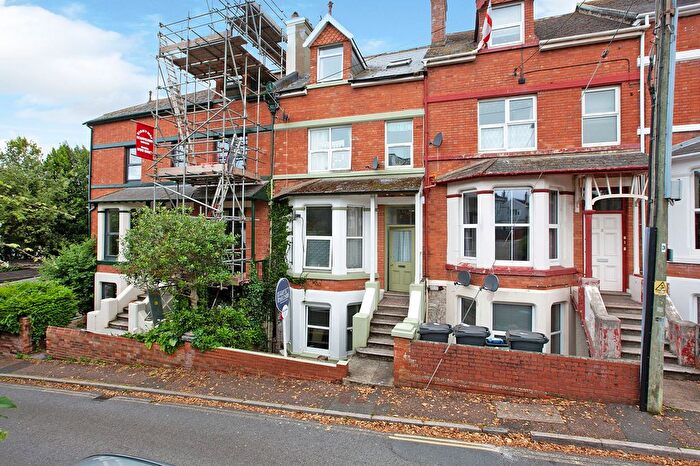
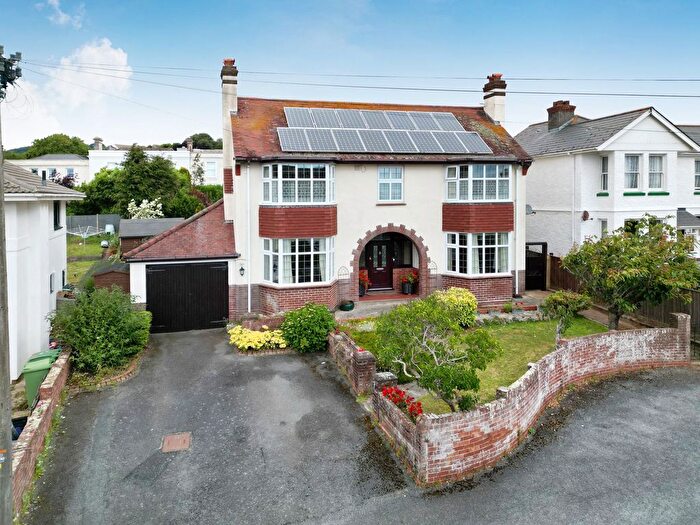
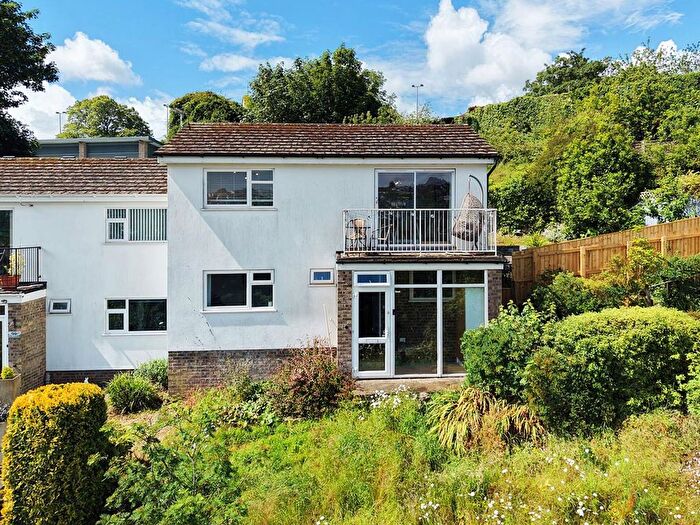
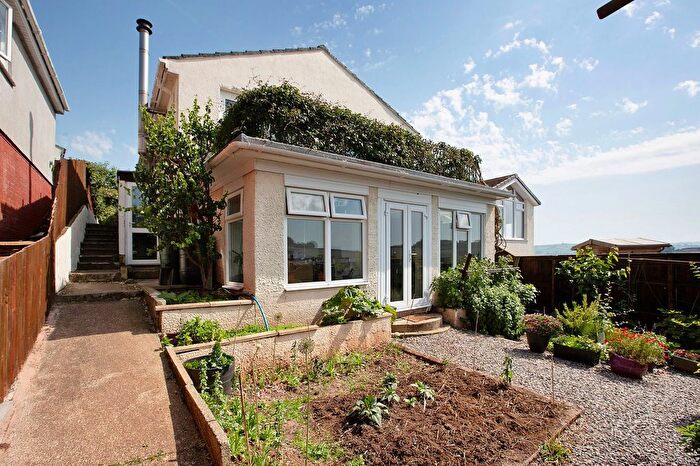
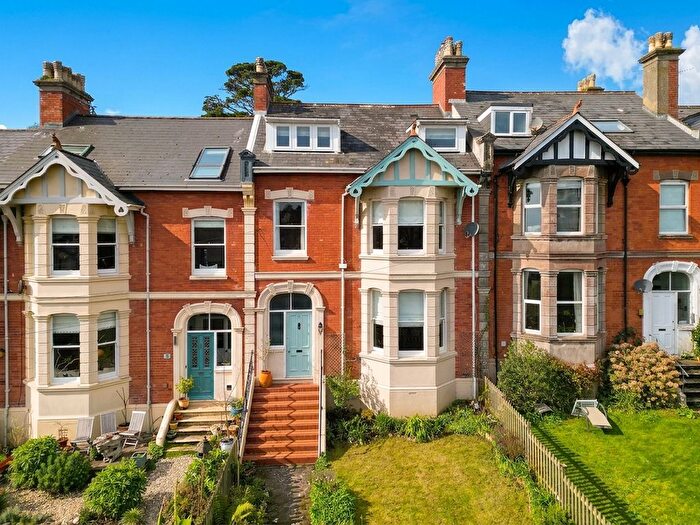
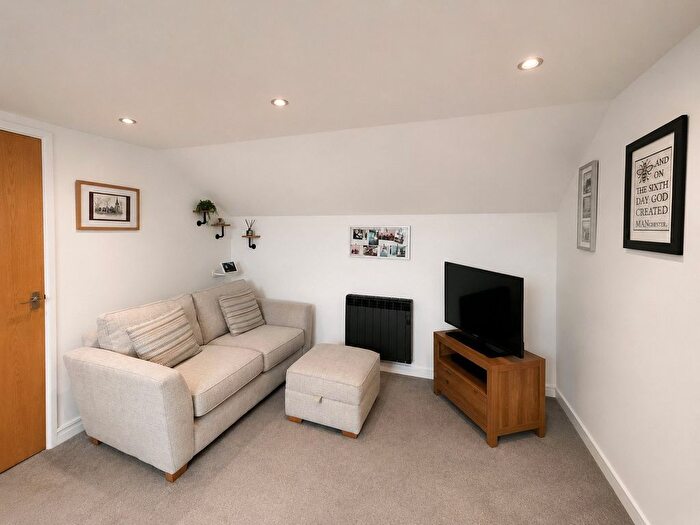
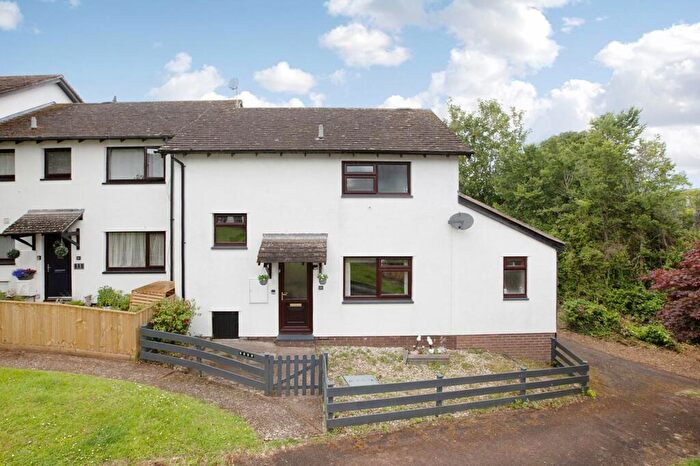
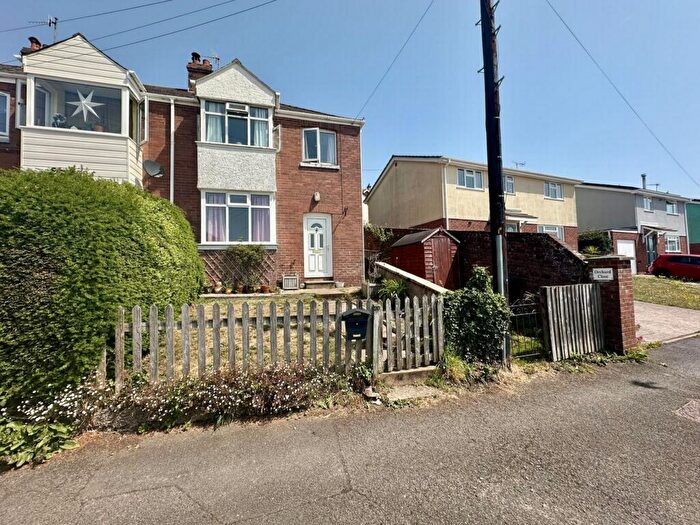
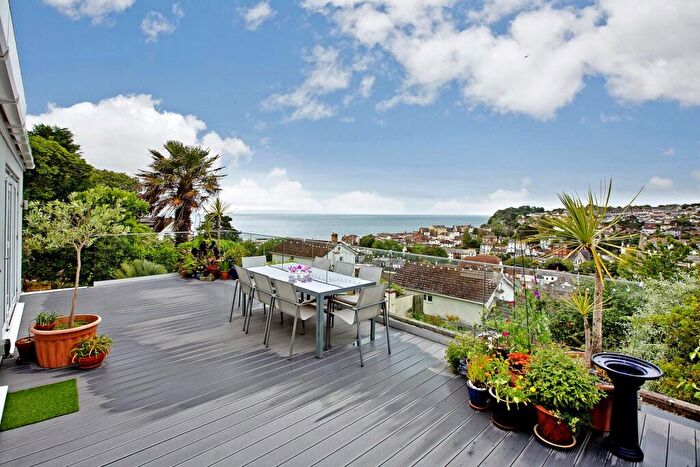
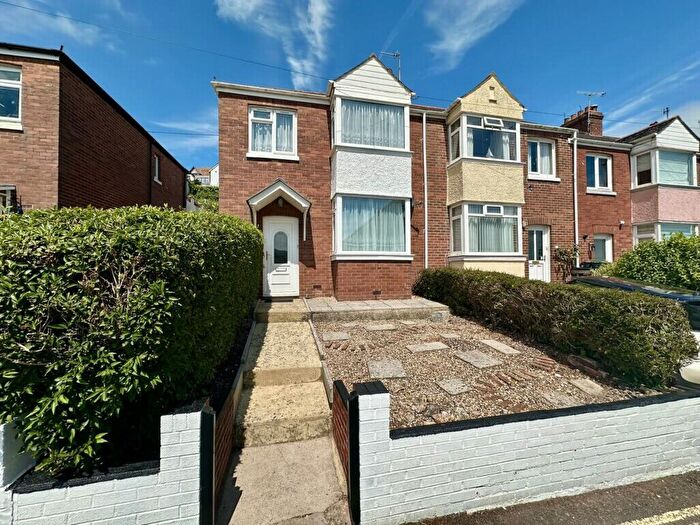
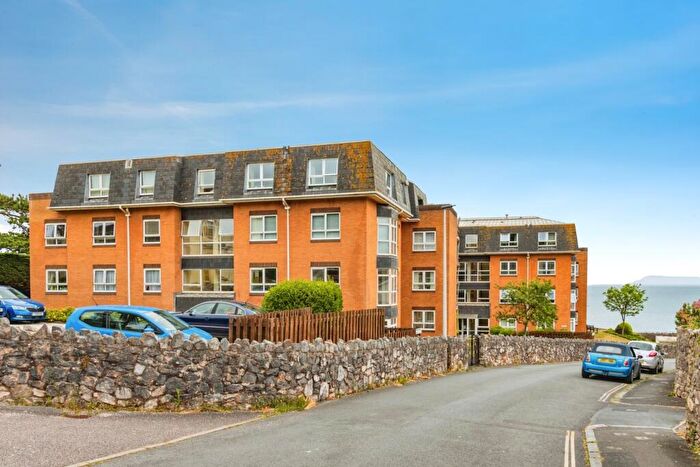
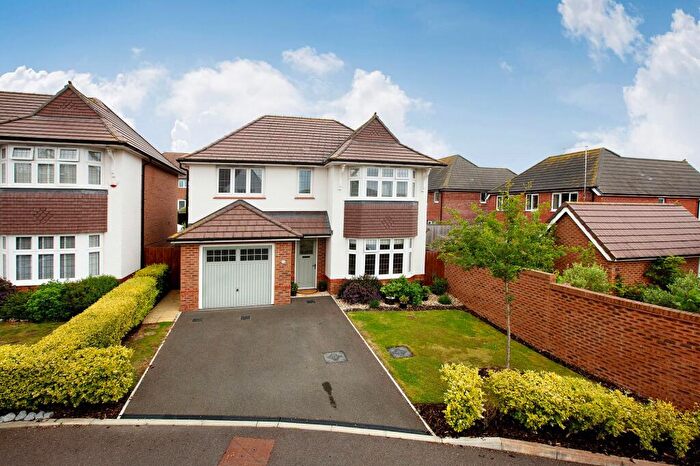
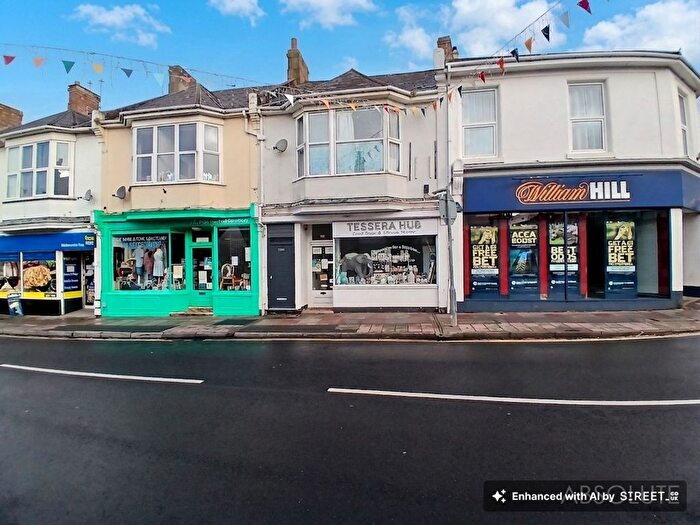
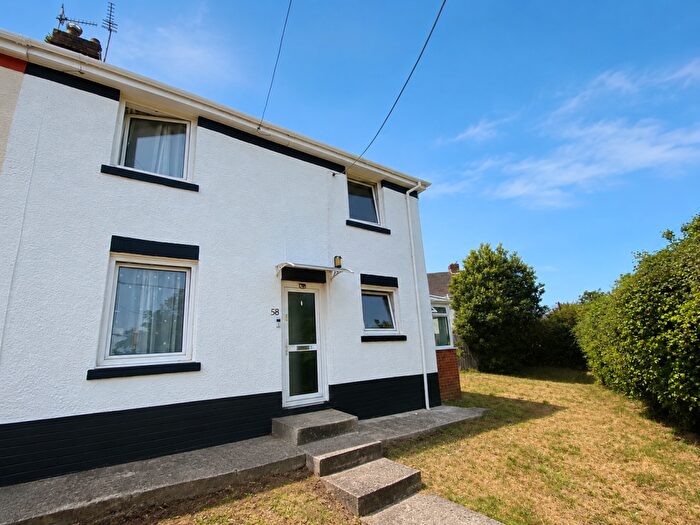
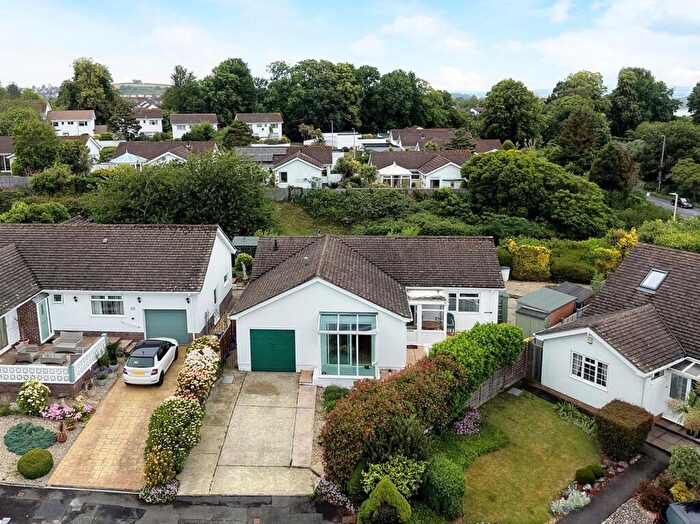
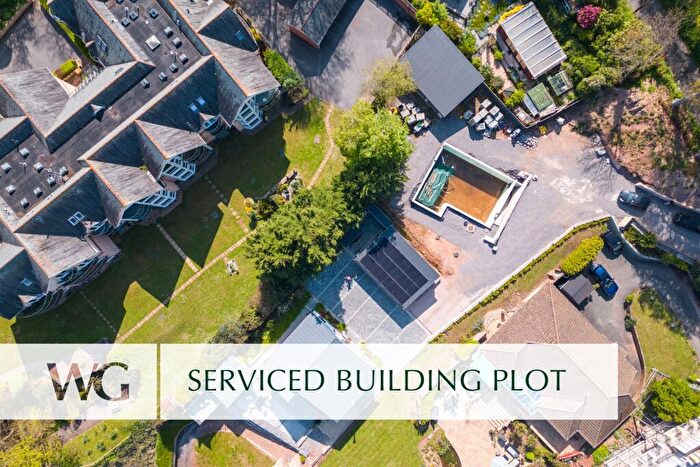
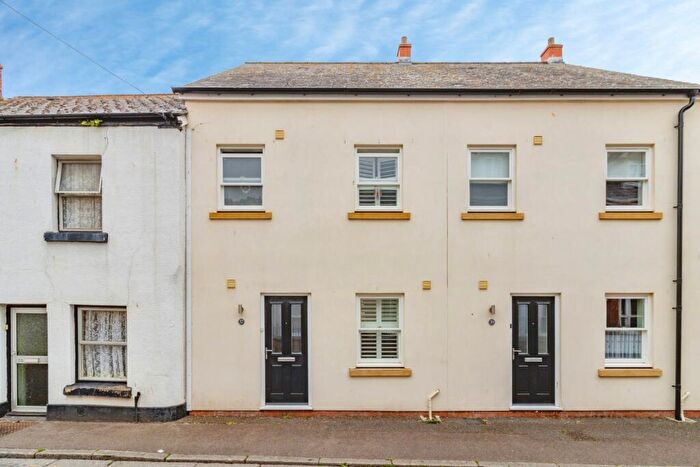
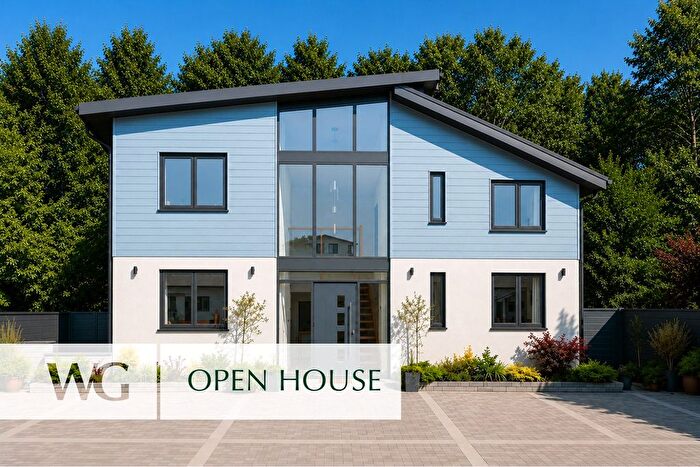
Houses and Flats for sale in TQ14, Teignmouth
There are 138 results. Property prices in TQ14 range from £64k to £675k with an average price of £334k.
![]()
If you are looking to sell your house, let it out, or receive a property valuation, an expert can help you.
Click the button below to get started.
Properties for sale near TQ14
![]()
If you are looking to sell your house, let it out, or receive a property valuation, an expert can help you.
Click the button below to get started.
Frequently Asked Questions about TQ14
What is the average price for a property for sale in TQ14?
The average price for a property for sale in TQ14 is £351,195. There are 8 property listings for sale in TQ14.
Which areas are included in the TQ14 postcode district?
The main area within TQ14 is Teignmouth.
What are the most common property types in TQ14?
The most common property types in TQ14 are Detached Houses, Flats, Terraced Houses and Semi Detached Houses.
What has been the average sold property price in TQ14 over the last three years?
Detached Houses in TQ14 have an average sold price of £497,436, while Flats have an average of £213,052. Terraced Houses have an average of £285,636 and Semi Detached Houses have an average of £334,846. The average sold property price in TQ14 over the last three years is approximately £343,380.
Which train stations are available in TQ14?
The train station available in TQ14 is Teignmouth Station..