
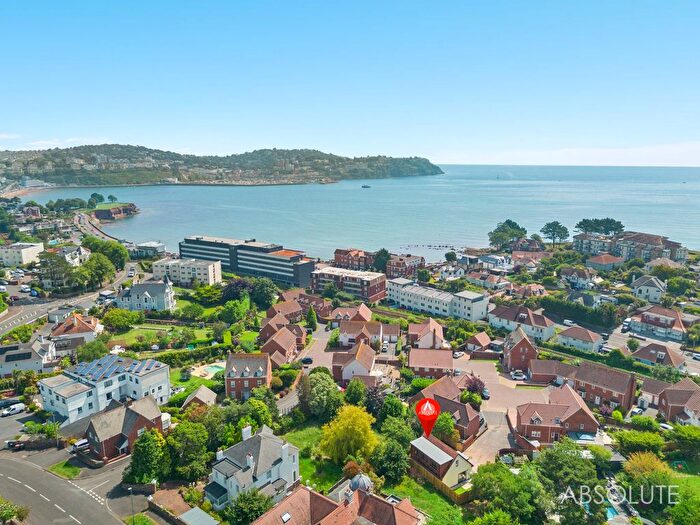
Properties for sale in TQ2
Torquay (west, north)
- Info
- Price Paid By Year
- Property Type Price
- Transport
House Prices in TQ2
Properties in TQ2 have an average house price of £273,090.00 and had 1427 Property Transactions within the last 3 years.
The most expensive property was sold for £1,400,000.00.
Property Price Paid in TQ2 by Year
The average sold property price by year was:
| Year | Average Sold Price | Sold Properties |
|---|---|---|
| 2026 | £249,315.00 | 41 Properties |
| 2025 | £273,449.00 | 471 Properties |
| 2024 | £270,970.00 | 483 Properties |
| 2023 | £277,326.00 | 432 Properties |
| 2022 | £277,463.00 | 618 Properties |
| 2021 | £264,307.00 | 750 Properties |
| 2020 | £231,589.00 | 501 Properties |
| 2019 | £234,921.00 | 607 Properties |
| 2018 | £207,098.00 | 680 Properties |
| 2017 | £214,972.00 | 717 Properties |
| 2016 | £206,328.00 | 641 Properties |
| 2015 | £203,443.00 | 643 Properties |
| 2014 | £181,727.00 | 605 Properties |
| 2013 | £175,803.00 | 599 Properties |
| 2012 | £180,710.00 | 462 Properties |
| 2011 | £184,060.00 | 441 Properties |
| 2010 | £188,715.00 | 460 Properties |
| 2009 | £179,776.00 | 439 Properties |
| 2008 | £194,132.00 | 446 Properties |
| 2007 | £189,551.00 | 963 Properties |
| 2006 | £180,519.00 | 946 Properties |
| 2005 | £170,741.00 | 684 Properties |
| 2004 | £175,228.00 | 943 Properties |
| 2003 | £141,352.00 | 1,001 Properties |
| 2002 | £116,982.00 | 1,131 Properties |
| 2001 | £96,719.00 | 1,034 Properties |
| 2000 | £84,055.00 | 973 Properties |
| 1999 | £73,872.00 | 1,013 Properties |
| 1998 | £69,559.00 | 904 Properties |
| 1997 | £67,396.00 | 817 Properties |
| 1996 | £58,057.00 | 676 Properties |
| 1995 | £58,386.00 | 597 Properties |
Property Price per Property Type in TQ2
Here you can find historic sold price data in order to help with your property search.
The average Property Paid Price for specific property types in the last three years are:
| Property Type | Average Sold Price | Sold Properties |
|---|---|---|
| Semi Detached House | £286,131.00 | 397 Semi Detached Houses |
| Detached House | £438,572.00 | 282 Detached Houses |
| Terraced House | £221,625.00 | 460 Terraced Houses |
| Flat | £175,281.00 | 288 Flats |
Transport near TQ2

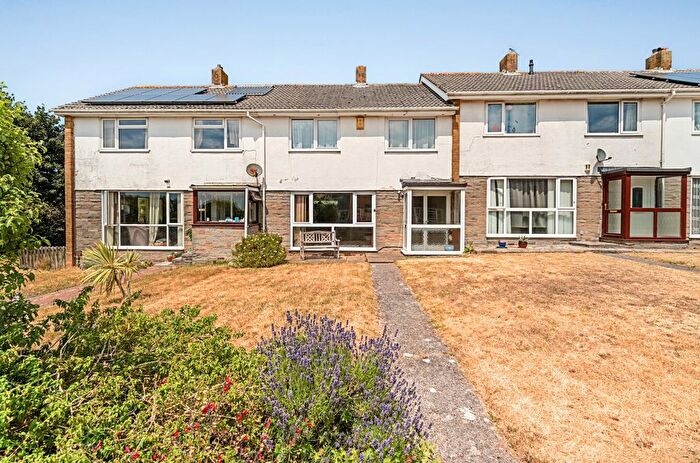
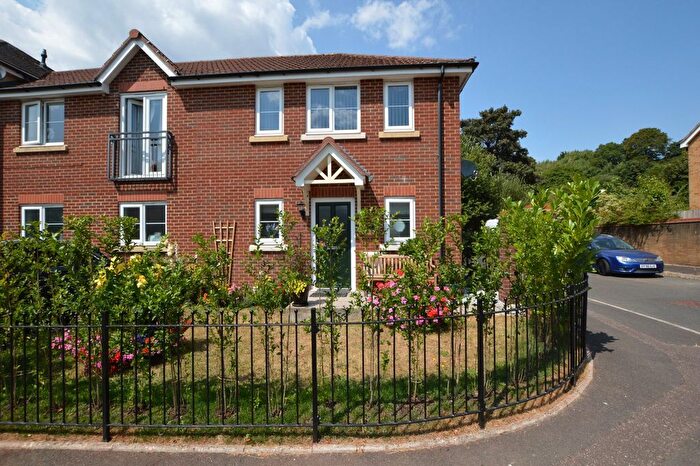
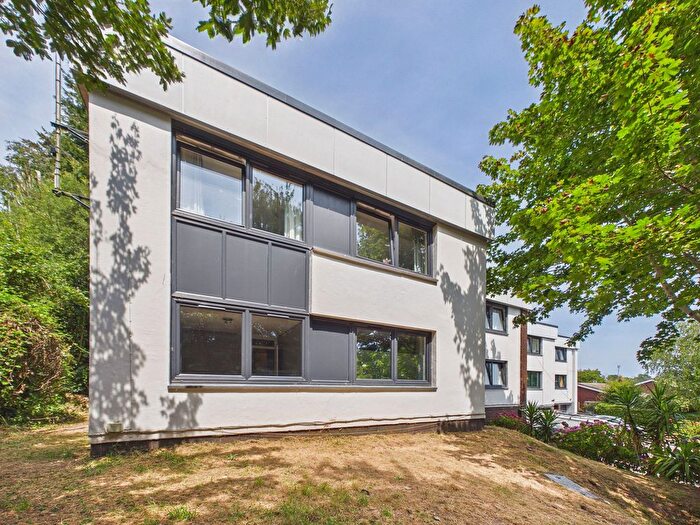
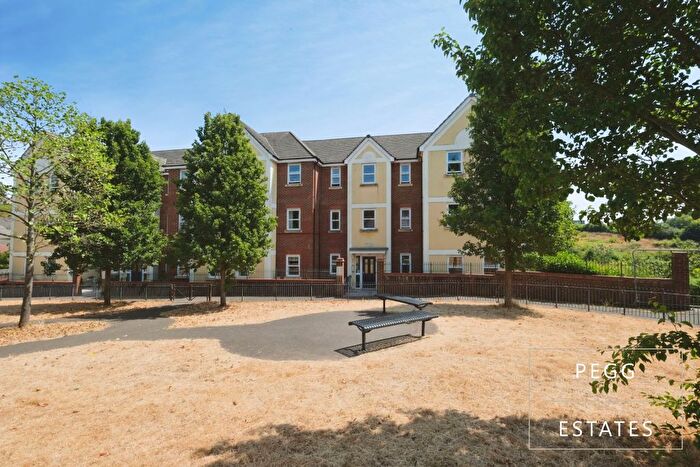
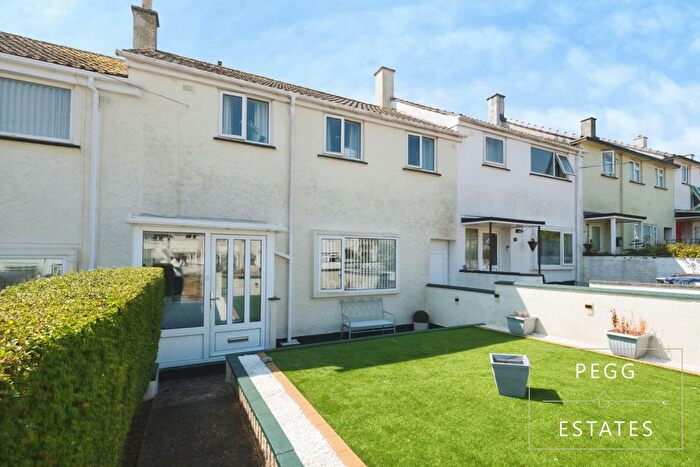
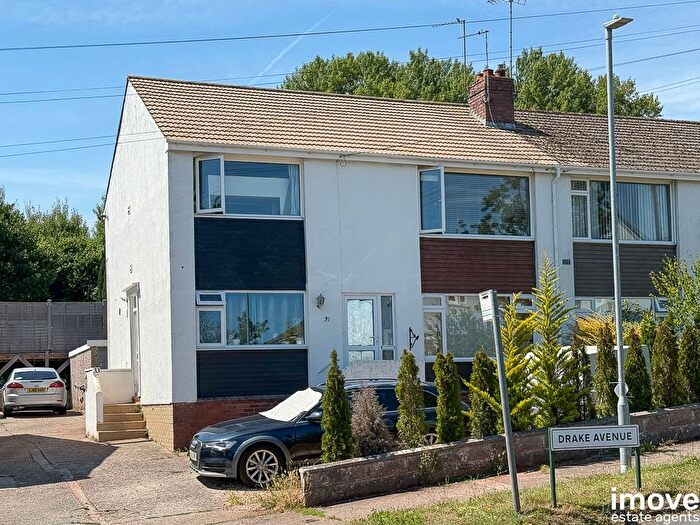
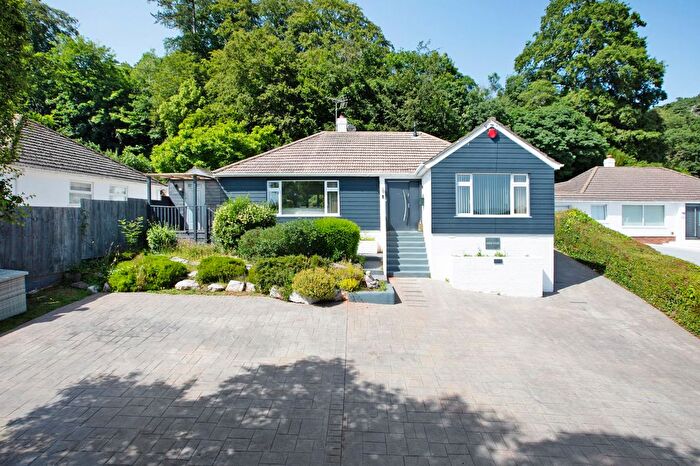
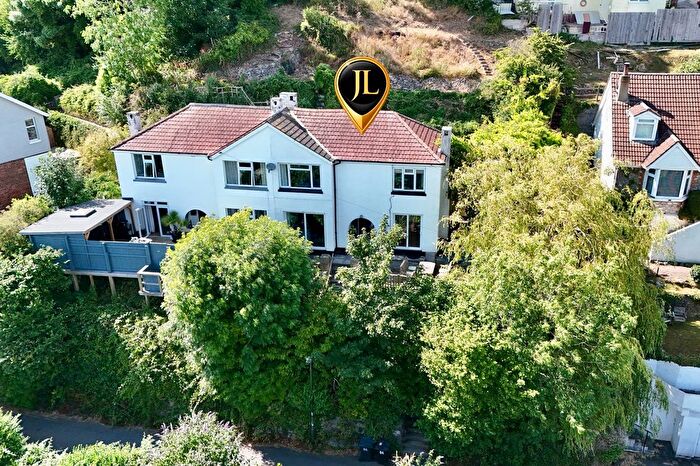
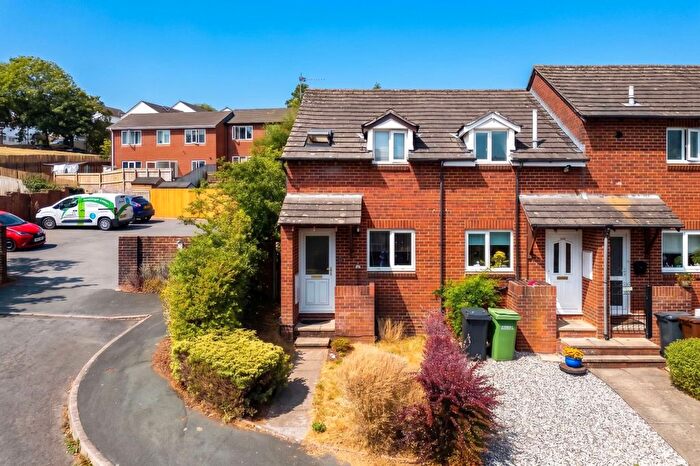
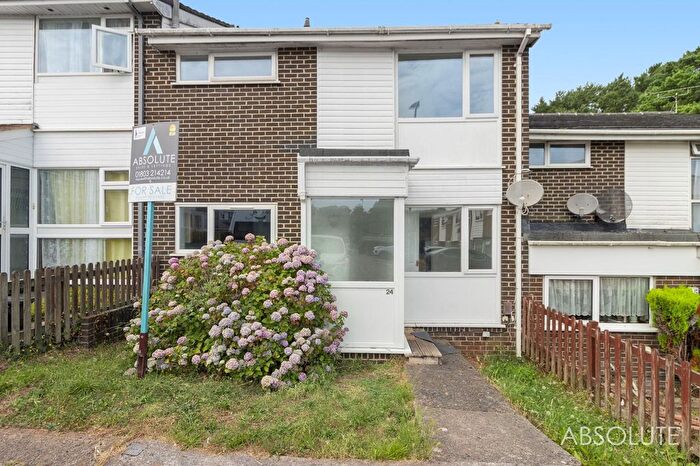
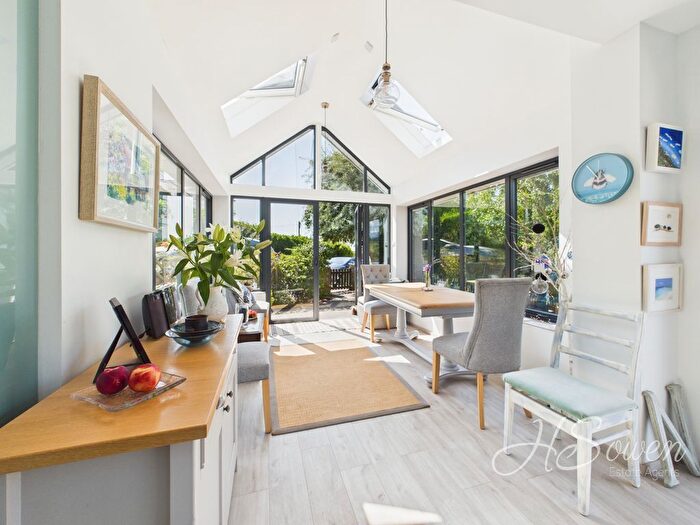
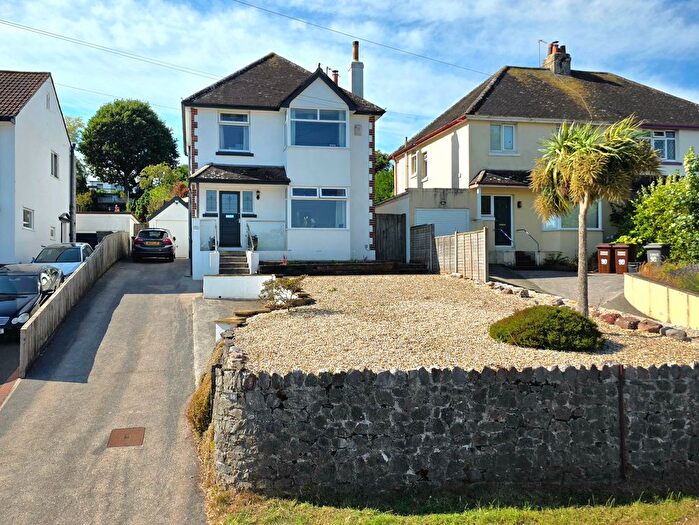
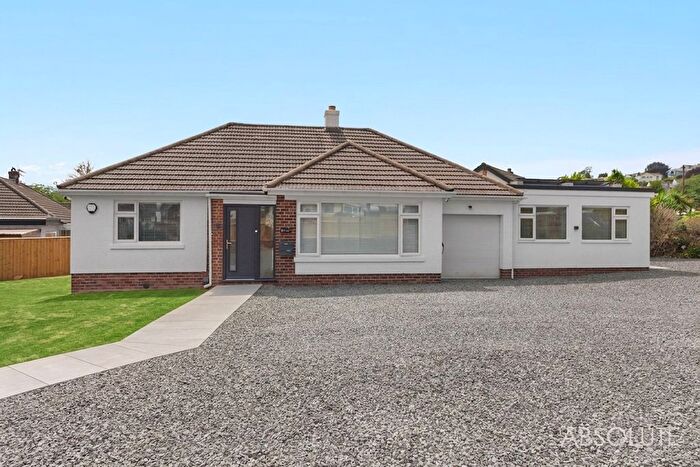
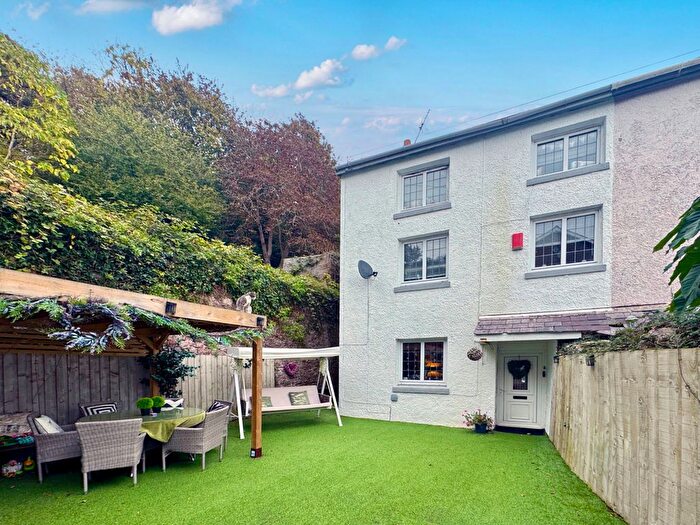
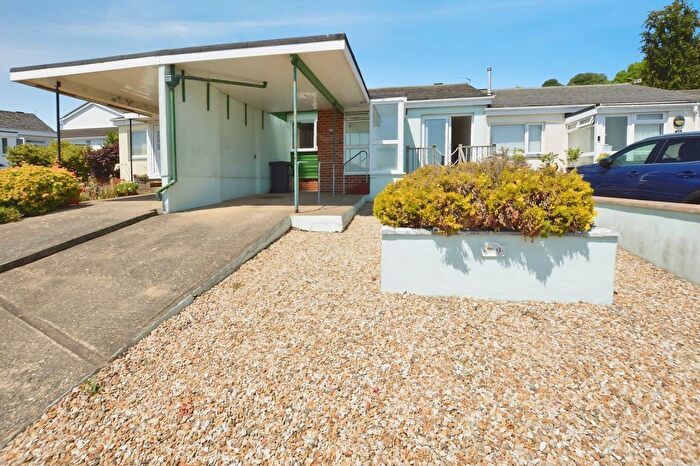
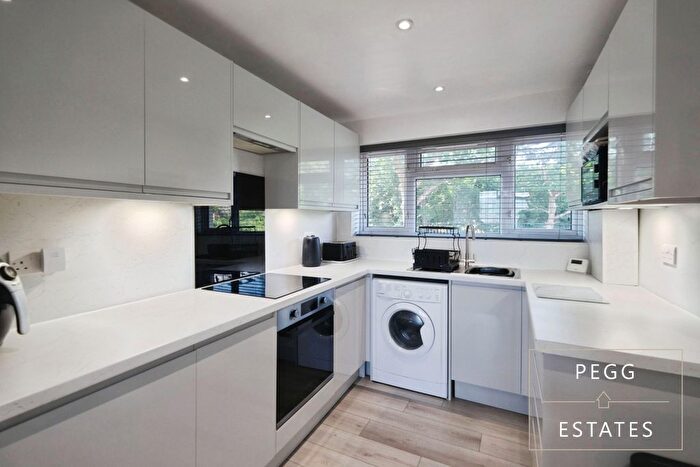
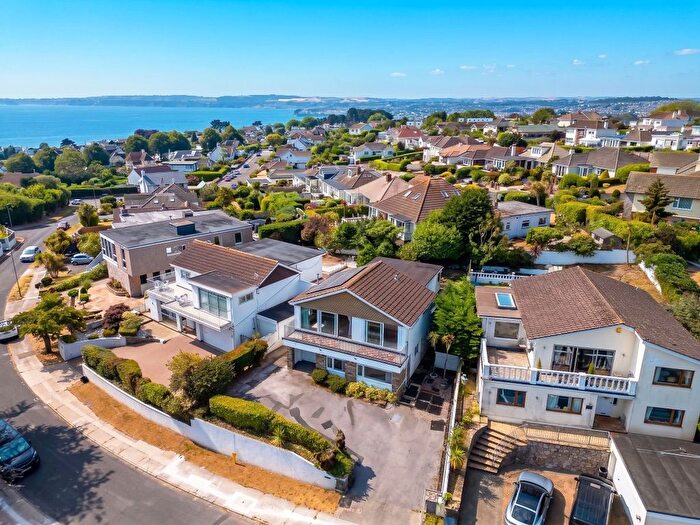
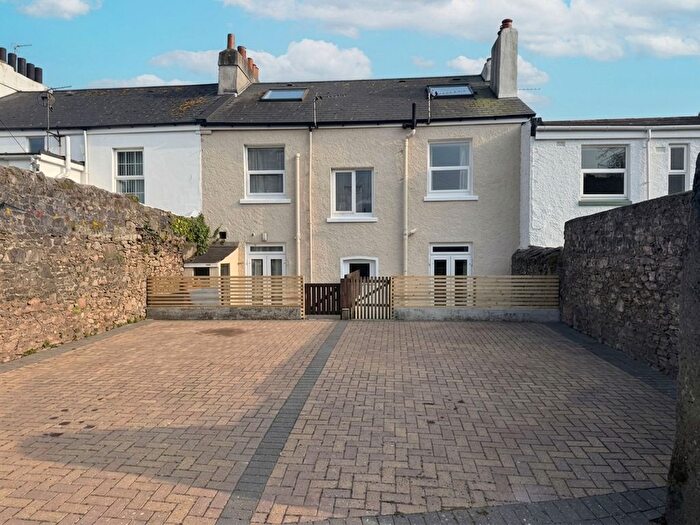
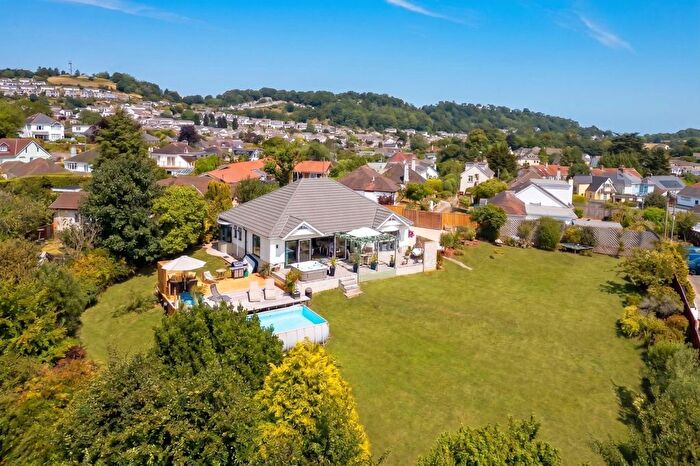
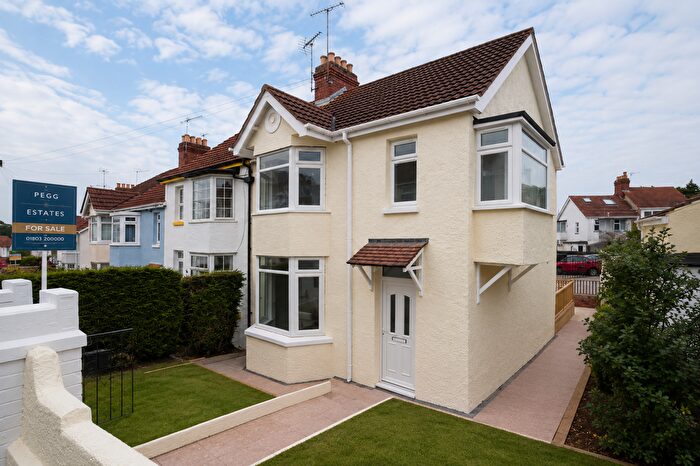
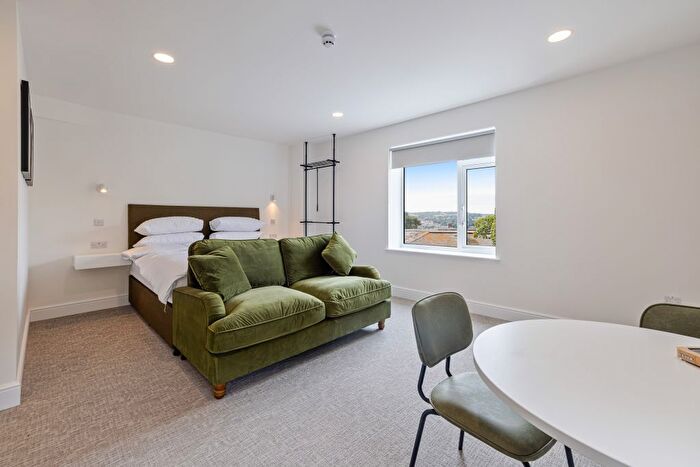
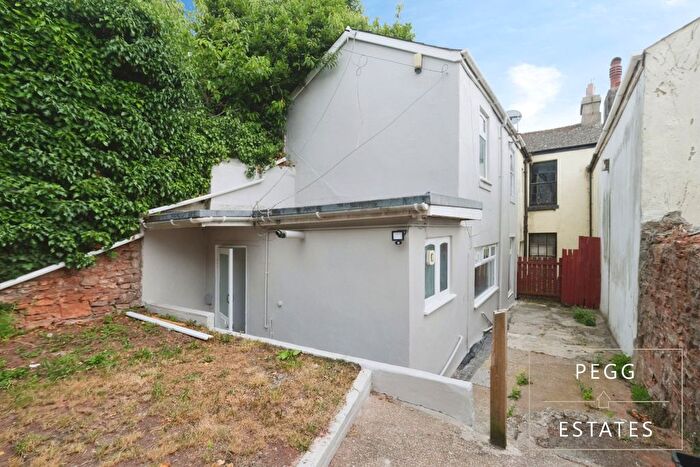
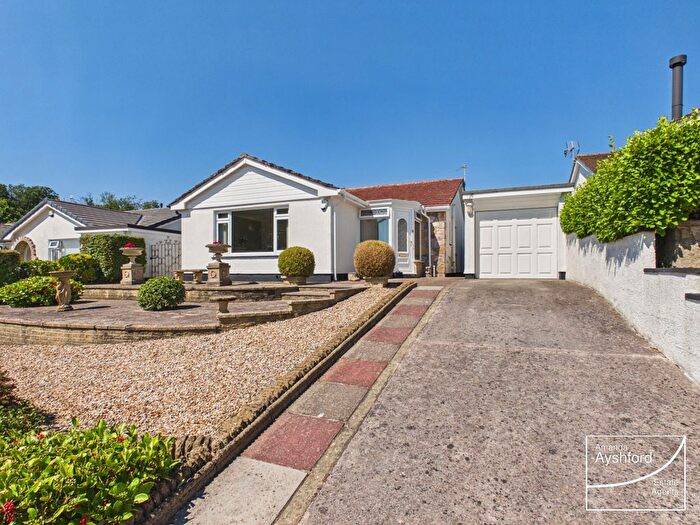
Houses and Flats for sale in TQ2, Torquay (west, north)
There are 76 results. Property prices in TQ2 range from £17k to £1.35M with an average price of £336k.
![]()
If you are looking to sell your house, let it out, or receive a property valuation, an expert can help you.
Click the button below to get started.
Frequently Asked Questions about TQ2
What is the average price for a property for sale in TQ2?
The average price for a property for sale in TQ2 is £273,090. There are 76 property listings for sale in TQ2.
Which areas are included in the TQ2 postcode district?
The main areas within TQ2 include Torquay (west and north).
What are the most common property types in TQ2?
The most common property types in TQ2 are Terraced Houses, Semi Detached Houses, Flats and Detached Houses.
What has been the average sold property price in TQ2 over the last three years?
Terraced Houses in TQ2 have an average sold price of £221,625, while Semi Detached Houses have an average of £286,131. Flats have an average of £175,281 and Detached Houses have an average of £438,572. The average sold property price in TQ2 over the last three years is approximately £264,578.
Which train stations are available in TQ2?
The train stations available in TQ2 are Torquay Station and Torre Station..