
Properties for sale in TQ5
Brixham
- Info
- Price Paid By Year
- Property Type Price
- Transport
House Prices in TQ5
Properties in TQ5 have an average house price of £331,633.00 and had 893 Property Transactions within the last 3 years.
The most expensive property was sold for £2,090,000.00.
Property Price Paid in TQ5 by Year
The average sold property price by year was:
| Year | Average Sold Price | Sold Properties |
|---|---|---|
| 2026 | £302,272.00 | 22 Properties |
| 2025 | £329,232.00 | 286 Properties |
| 2024 | £330,468.00 | 327 Properties |
| 2023 | £338,276.00 | 258 Properties |
| 2022 | £342,382.00 | 402 Properties |
| 2021 | £307,104.00 | 540 Properties |
| 2020 | £275,504.00 | 394 Properties |
| 2019 | £253,721.00 | 513 Properties |
| 2018 | £248,916.00 | 486 Properties |
| 2017 | £237,039.00 | 523 Properties |
| 2016 | £235,147.00 | 545 Properties |
| 2015 | £220,552.00 | 538 Properties |
| 2014 | £206,406.00 | 487 Properties |
| 2013 | £202,499.00 | 392 Properties |
| 2012 | £195,477.00 | 362 Properties |
| 2011 | £195,866.00 | 332 Properties |
| 2010 | £206,189.00 | 334 Properties |
| 2009 | £188,979.00 | 335 Properties |
| 2008 | £192,514.00 | 251 Properties |
| 2007 | £215,806.00 | 527 Properties |
| 2006 | £190,381.00 | 532 Properties |
| 2005 | £186,893.00 | 434 Properties |
| 2004 | £172,594.00 | 512 Properties |
| 2003 | £151,430.00 | 591 Properties |
| 2002 | £124,844.00 | 700 Properties |
| 2001 | £101,522.00 | 603 Properties |
| 2000 | £86,421.00 | 599 Properties |
| 1999 | £80,239.00 | 642 Properties |
| 1998 | £69,406.00 | 546 Properties |
| 1997 | £68,505.00 | 554 Properties |
| 1996 | £60,979.00 | 474 Properties |
| 1995 | £56,769.00 | 388 Properties |
Property Price per Property Type in TQ5
Here you can find historic sold price data in order to help with your property search.
The average Property Paid Price for specific property types in the last three years are:
| Property Type | Average Sold Price | Sold Properties |
|---|---|---|
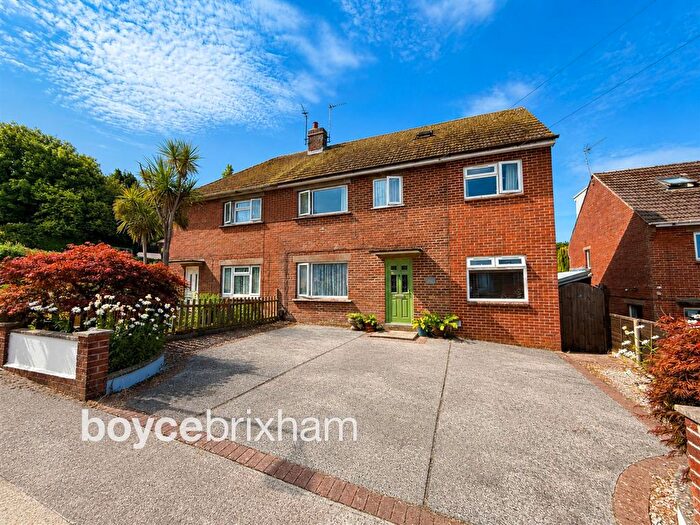
| Semi Detached House | £294,542.00 | 223 Semi Detached Houses |
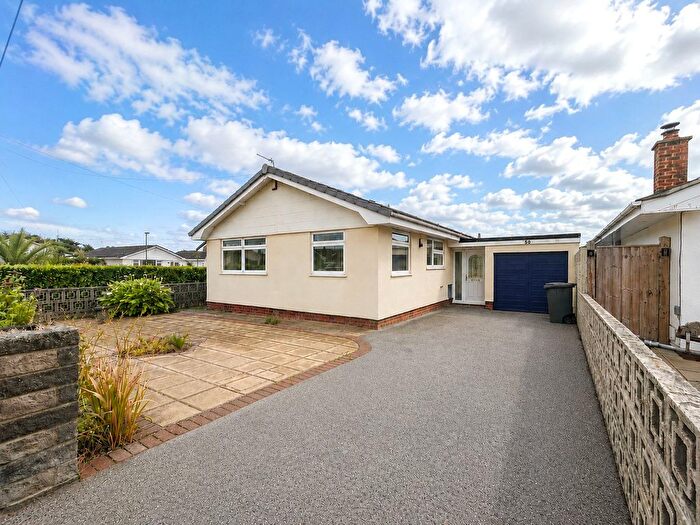
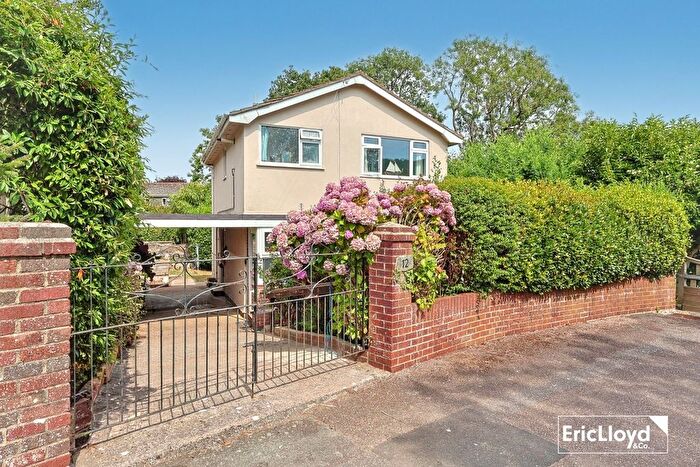
| Detached House | £488,578.00 | 274 Detached Houses |
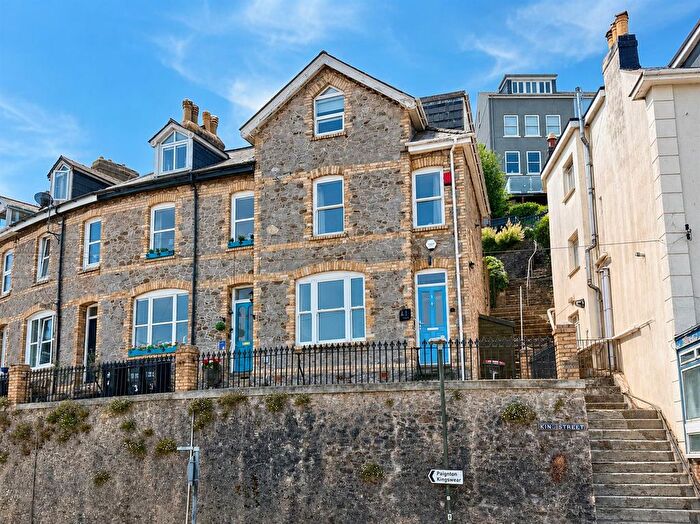
| Terraced House | £272,045.00 | 268 Terraced Houses |
| Flat | £185,057.00 | 128 Flats |
Transport near TQ5

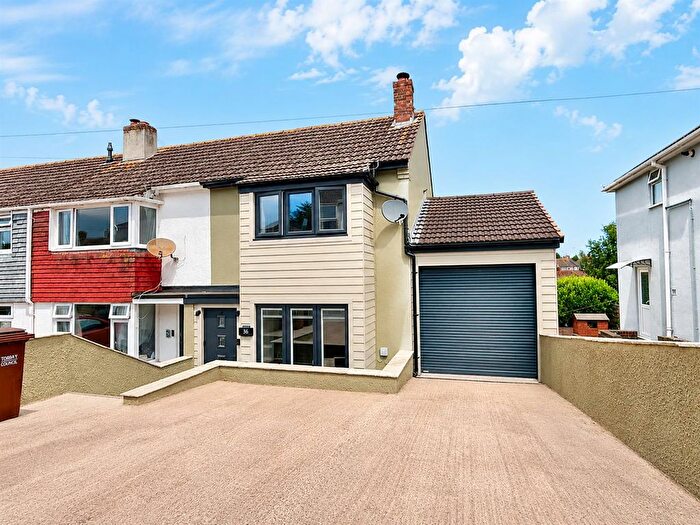
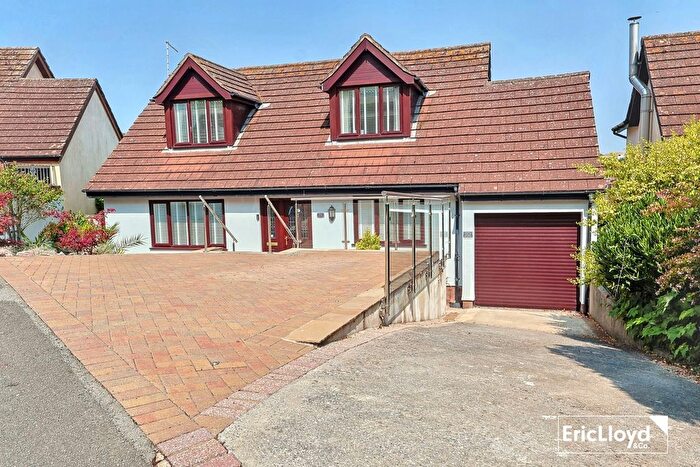
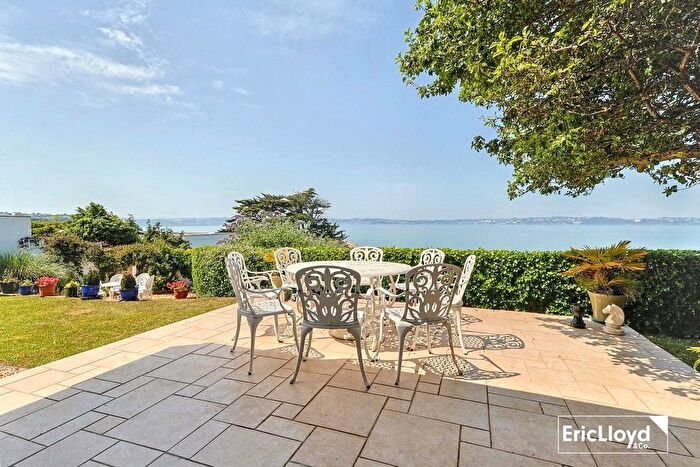
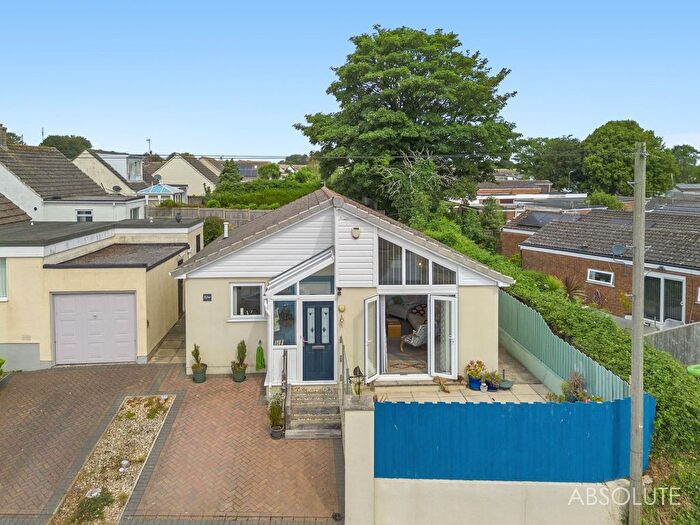
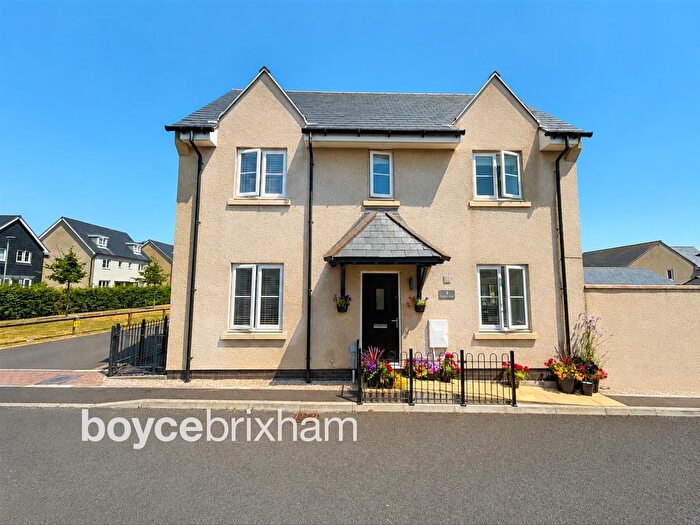
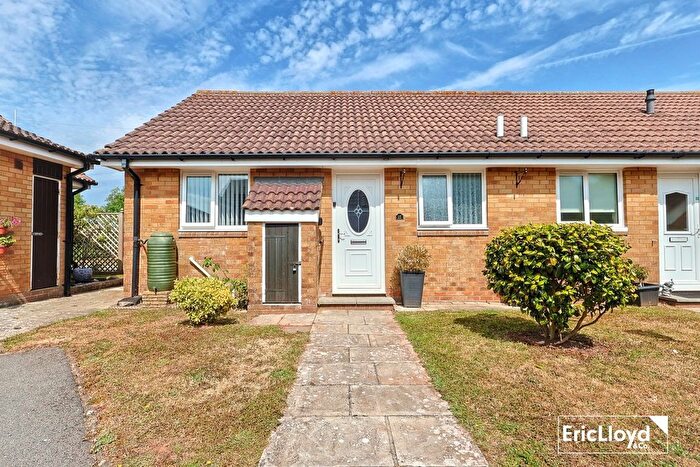
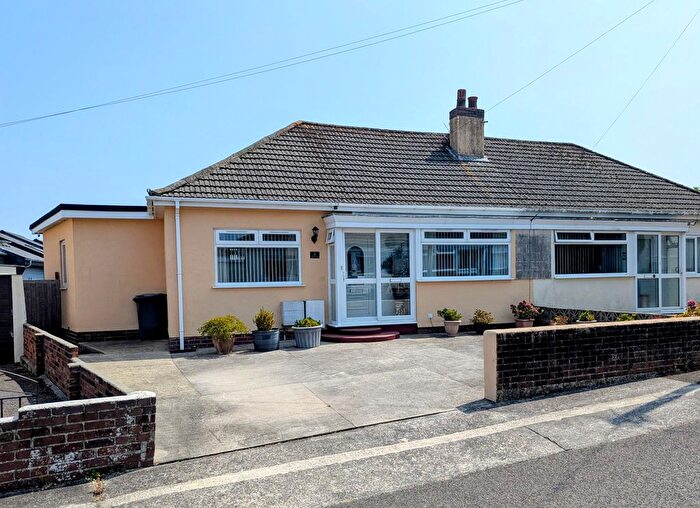
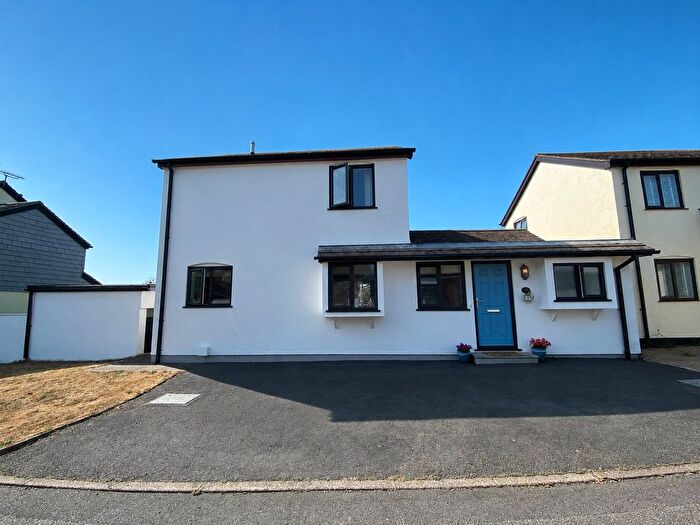
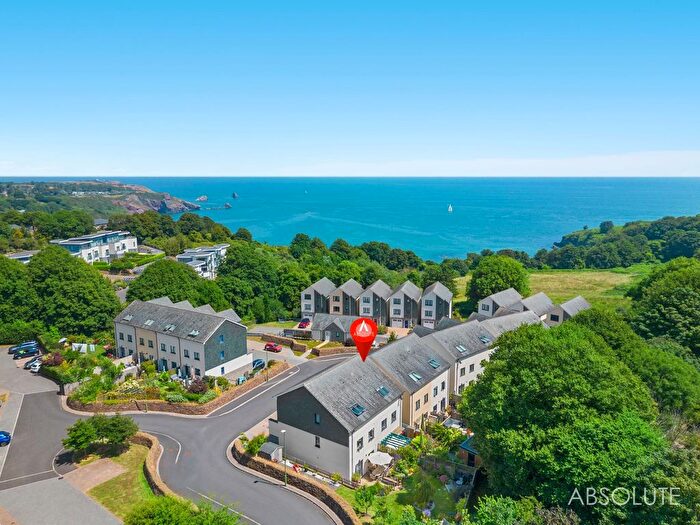
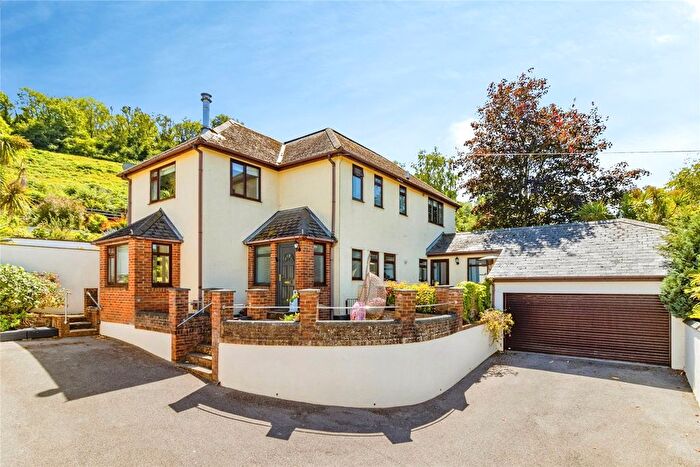
Houses and Flats for sale in TQ5, Brixham
There are 44 results. Property prices in TQ5 range from £125k to £850k with an average price of £345k.
![]()
If you are looking to sell your house, let it out, or receive a property valuation, an expert can help you.
Click the button below to get started.
Frequently Asked Questions about TQ5
What is the average price for a property for sale in TQ5?
The average price for a property for sale in TQ5 is £331,633. There are 44 property listings for sale in TQ5.
Which areas are included in the TQ5 postcode district?
The main area within TQ5 is Brixham.
What are the most common property types in TQ5?
The most common property types in TQ5 are Detached Houses, Terraced Houses, Semi Detached Houses and Flats.
What has been the average sold property price in TQ5 over the last three years?
Detached Houses in TQ5 have an average sold price of £488,578, while Terraced Houses have an average of £272,045. Semi Detached Houses have an average of £294,542 and Flats have an average of £185,057. The average sold property price in TQ5 over the last three years is approximately £320,657.