
Properties for sale in YO
York
- Info
- Price Paid By Year
- Property Type Price
House Prices in YO
Properties in YO have an average house price of £290,123 and had 32047 Property Transactions within the last 3 years.
The most expensive property was sold for £25,000,000.
Property Price Paid in YO by Year
The average sold property price by year was:
| Year | Average Sold Price | Sold Properties |
|---|---|---|
| 2025 | £286,886.00 | 4,252 Properties |
| 2024 | £292,381.00 | 8,712 Properties |
| 2023 | £292,061.00 | 8,532 Properties |
| 2022 | £287,997.00 | 10,551 Properties |
| 2021 | £274,532.00 | 13,066 Properties |
| 2020 | £252,787.00 | 10,258 Properties |
| 2019 | £233,679.00 | 11,626 Properties |
| 2018 | £232,105.00 | 11,528 Properties |
| 2017 | £224,603.00 | 12,054 Properties |
| 2016 | £214,987.00 | 11,492 Properties |
| 2015 | £206,772.00 | 11,246 Properties |
| 2014 | £198,617.00 | 11,069 Properties |
| 2013 | £192,092.00 | 9,437 Properties |
| 2012 | £191,136.00 | 7,687 Properties |
| 2011 | £191,692.00 | 7,760 Properties |
| 2010 | £192,471.00 | 7,469 Properties |
| 2009 | £183,618.00 | 7,572 Properties |
| 2008 | £193,546.00 | 7,185 Properties |
| 2007 | £196,536.00 | 13,525 Properties |
| 2006 | £184,285.00 | 14,453 Properties |
| 2005 | £175,499.00 | 11,370 Properties |
| 2004 | £164,840.00 | 13,178 Properties |
| 2003 | £136,429.00 | 13,758 Properties |
| 2002 | £115,201.00 | 14,807 Properties |
| 2001 | £91,710.00 | 14,034 Properties |
| 2000 | £81,322.00 | 13,137 Properties |
| 1999 | £73,170.00 | 13,380 Properties |
| 1998 | £68,800.00 | 10,860 Properties |
| 1997 | £67,458.00 | 11,596 Properties |
| 1996 | £63,496.00 | 9,886 Properties |
| 1995 | £62,018.00 | 8,741 Properties |
Property Price per Property Type in YO
Here you can find historic sold price data in order to help with your property search.
The average Property Paid Price for specific property types in the last three years are:
| Property Type | Average Sold Price | Sold Properties |
|---|---|---|
| Semi Detached House | £260,937.00 | 10,044 Semi Detached Houses |
| Terraced House | £245,379.00 | 8,392 Terraced Houses |
| Flat | £172,153.00 | 4,274 Flats |
| Detached House | £415,736.00 | 9,337 Detached Houses |
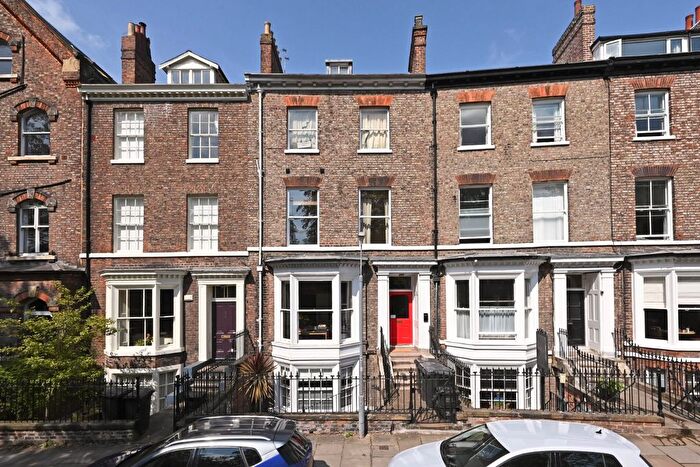
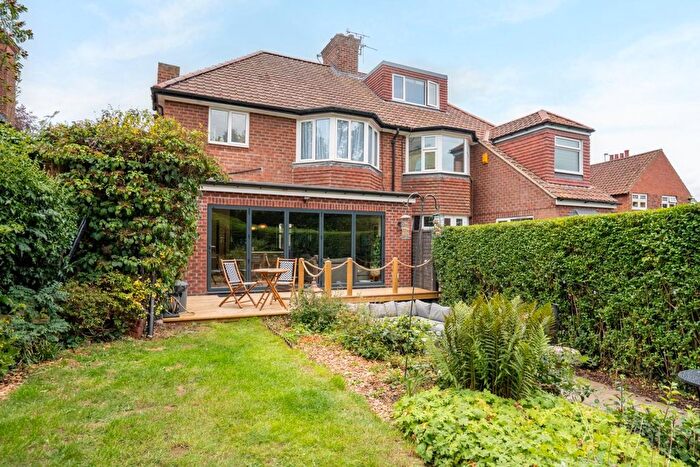
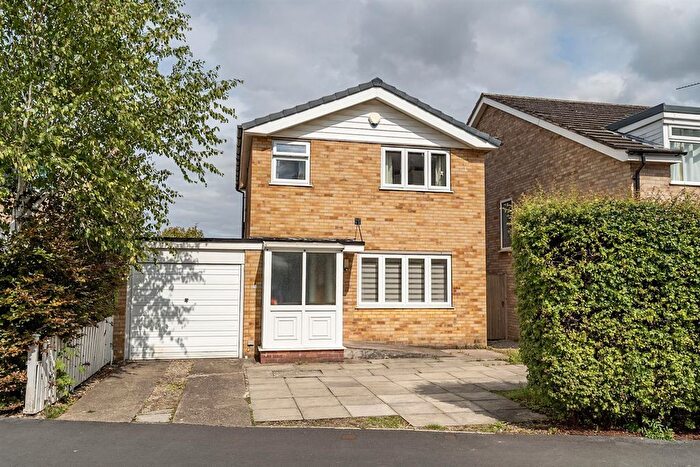
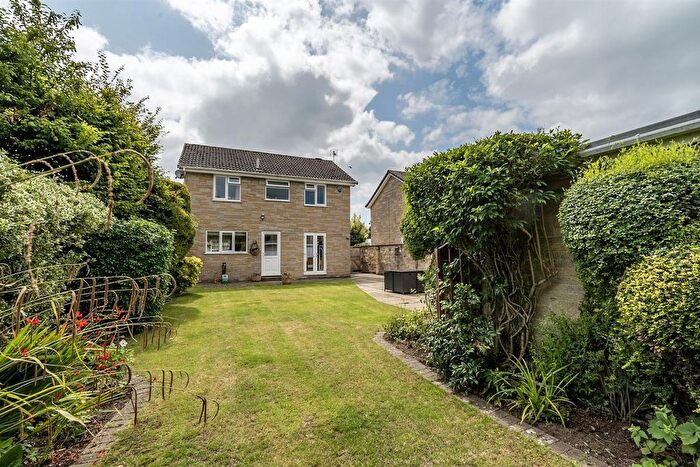
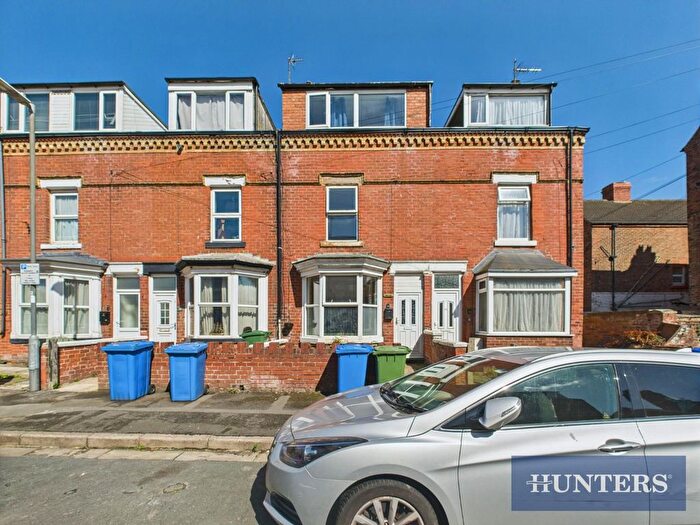
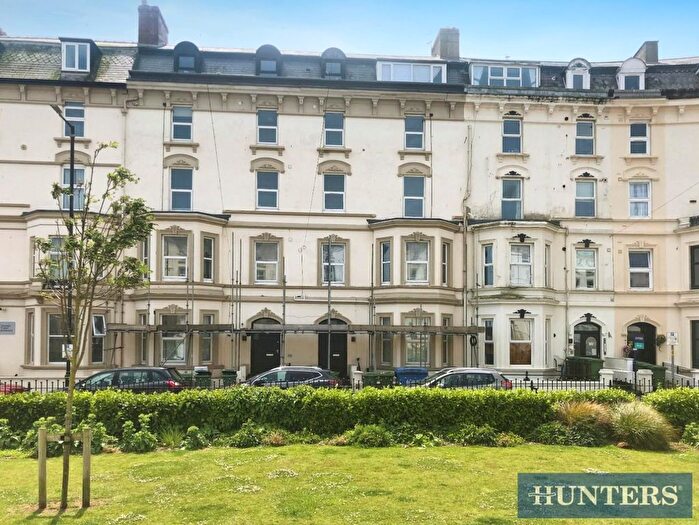
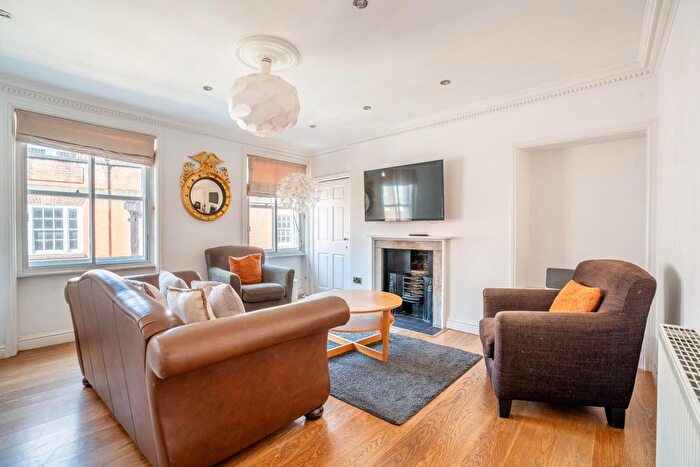
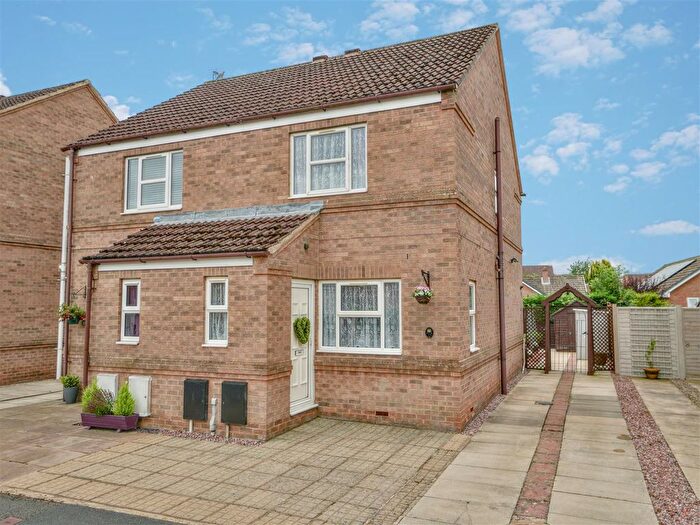
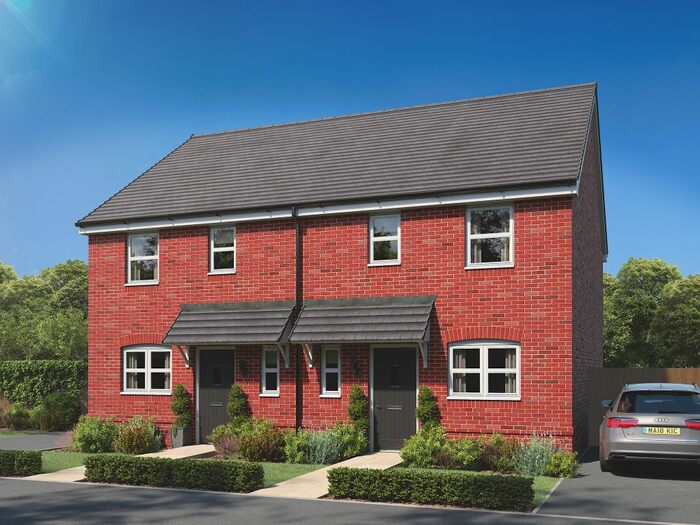
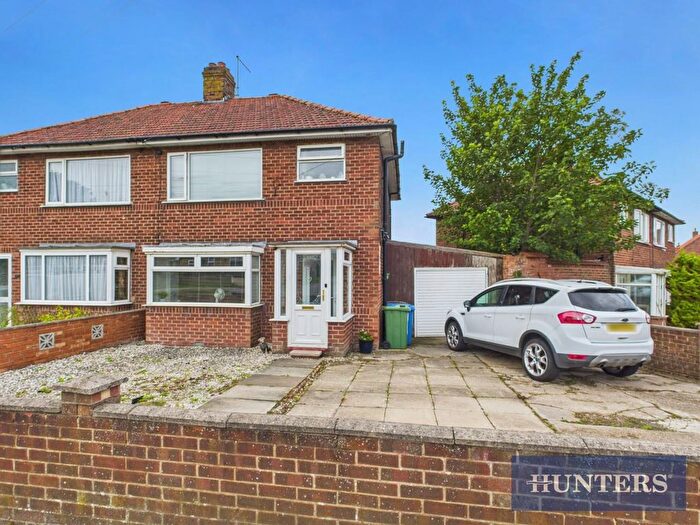
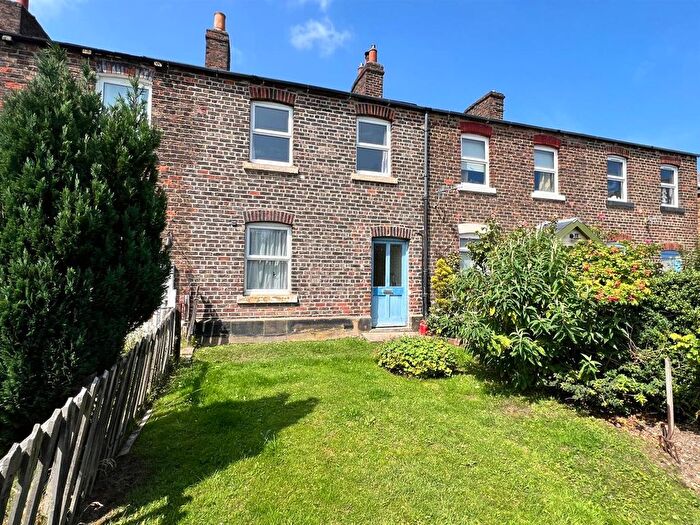
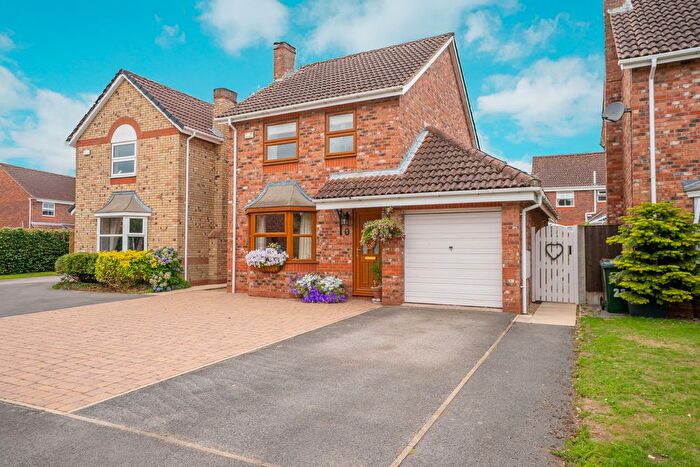
Houses and Flats for sale in YO, York
![]()
If you are looking to sell your house, let it out, or receive a property valuation, an expert can help you.
Click the button below to get started.
Postcode districts in YO, York
Navigate through our locations to find the location of your next house in YO, York, England for sale or to rent.
Transport in YO, York
Please see below transportation links in this area:

Frequently asked questions about YO
What is the average price for a property for sale in YO?
The average price for a property for sale in YO is £290,123. This amount is 20% lower than the average price in England. There are 1,983 property listings for sale in YO.
What locations have the most expensive properties for sale in YO?
The locations with the most expensive properties for sale in YO are YO60 at an average of £467,591, YO61 at an average of £455,085 and YO19 at an average of £399,485.
What locations have the most affordable properties for sale in YO?
The locations with the most affordable properties for sale in YO are YO11 at an average of £178,353, YO16 at an average of £179,787 and YO12 at an average of £196,413.
Which train stations are available in or near YO?
Some of the train stations available in or near YO are Malton, York and Poppleton.