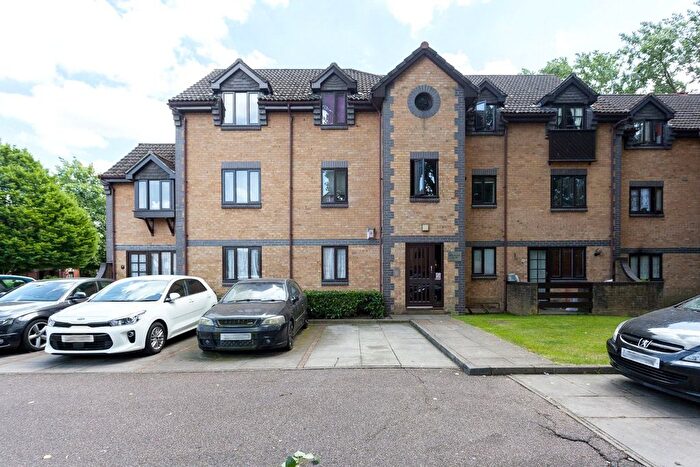
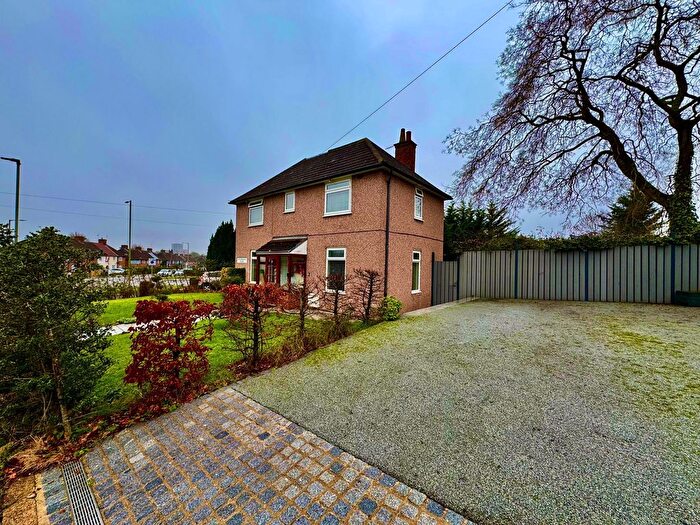
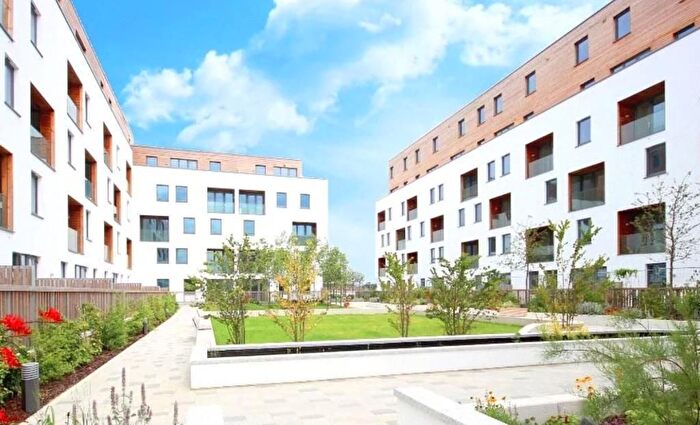
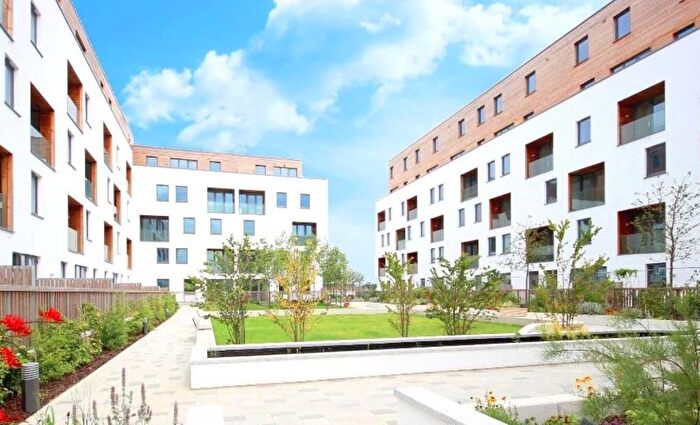
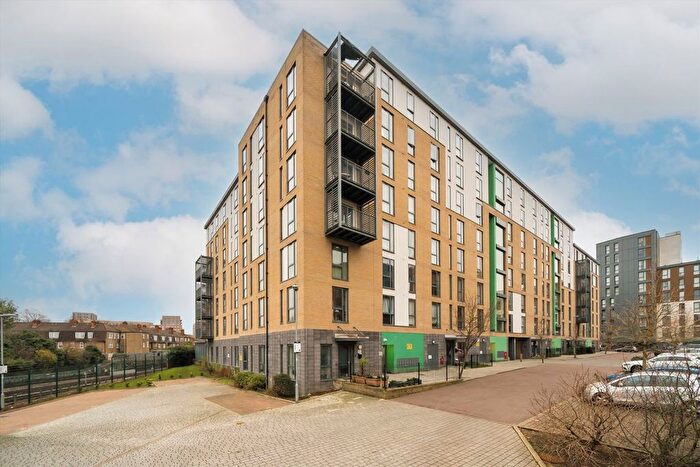
Houses for sale & to rent in Burnt Oak, London
House Prices in Burnt Oak
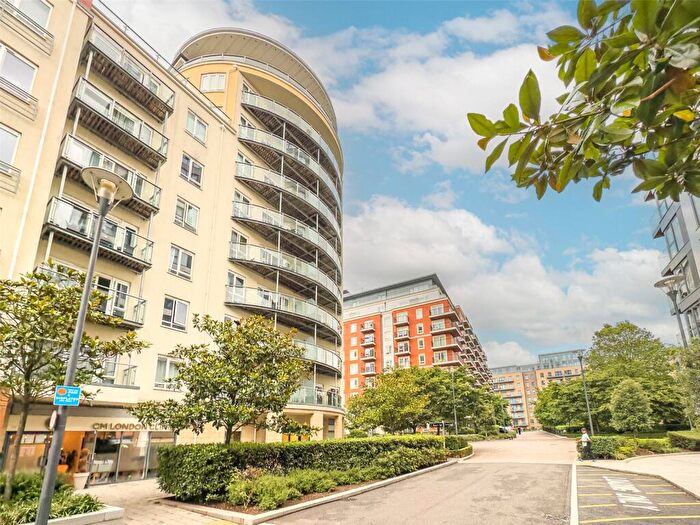
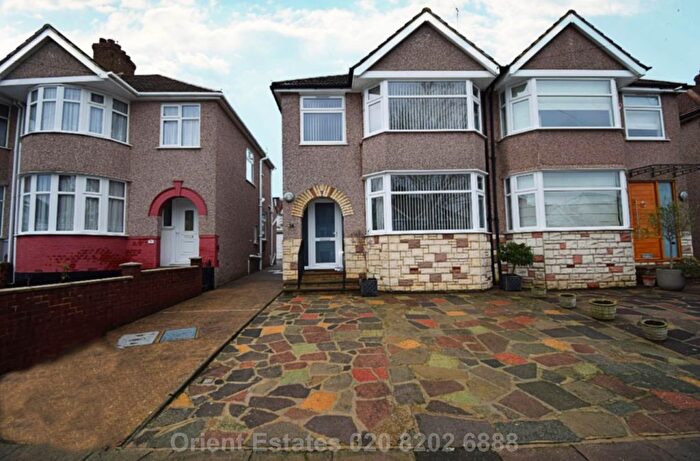
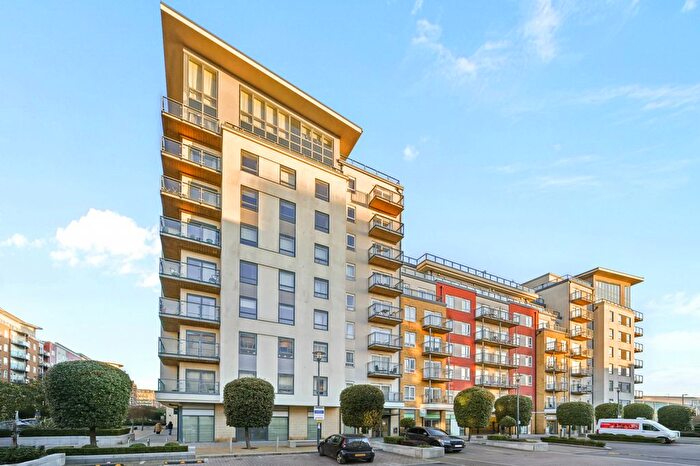
Properties in this part of Burnt Oak within London have an average house price of £451,730.00 and had 99 Property Transactions within the last 3 years¹. This area has 1,817 households² , where the most expensive property was sold for £1,067,500.00.
Properties for sale in Burnt Oak
Roads and Postcodes in Burnt Oak
Navigate through our locations to find the location of your next house in Burnt Oak, London for sale or to rent.
| Streets | Postcodes |
|---|---|
| Acklington Drive | NW9 5QQ NW9 5WL |
| Aeroville | NW9 5JT |
| Angus Gardens | NW9 5LE NW9 5LG |
| Booth Road | NW9 5JS NW9 5JU NW9 5JX NW9 5JY NW9 5JZ NW9 5LD |
| Boscombe Circus | NW9 5EJ |
| Bovingdon Lane | NW9 5WJ |
| Braemar Gardens | NW9 5LA NW9 5LB |
| Coningsby Avenue | NW9 5BL |
| Cranfield Drive | NW9 5WH |
| Debden Close | NW9 5EA |
| Dishforth Lane | NW9 5WG |
| Elvington Lane | NW9 5WB |
| European Design Centre | NW9 5AE |
| Eversfield Gardens | NW7 2AE |
| Falcon Way | NW9 5DT |
| Filton Close | NW9 5AQ |
| Folkingham Lane | NW9 5LR |
| Fulbeck Drive | NW9 5LH |
| Gaydon Lane | NW9 5WA |
| Greenway Close | NW9 5AZ |
| Greenway Gardens | NW9 5AX NW9 5AY |
| Hazel Close | NW9 5GD |
| Hemswell Drive | NW9 5WN |
| Heybourne Crescent | NW9 5UW |
| Heywood Avenue | NW9 5LN NW9 5LP |
| Holbeach Close | NW9 5BB |
| Kenley Avenue | NW9 5WP |
| Kent Court | NW9 5GF |
| Kestrel Close | NW9 5DJ |
| Lanacre Avenue | NW9 5FE NW9 5FN NW9 5AN |
| Martlesham Walk | NW9 5BF |
| North Acre | NW9 5GQ NW9 5UG NW9 5UU |
| Pageant Avenue | NW9 5LQ NW9 5LZ NW9 5NF |
| Pocklington Close | NW9 5WS NW9 5ER |
| Portman Gardens | NW9 5AS |
| Shawbury Close | NW9 5AW |
| Shellduck Close | NW9 5DW |
| Southbourne Avenue | NW9 5BT NW9 5BU |
| Southbourne Court | NW9 5BP |
| Swan Drive | NW9 5DE NW9 5DG |
| Tangmere Way | NW9 5WW |
| The Greenway | NW9 5AP NW9 5AR NW9 5AT NW9 5AU NW9 5BX NW9 5BY NW9 5DA |
| The Hyde | NW9 5BS NW9 5AL NW9 5NG NW9 5NP |
| Trenchard Close | NW9 5NQ |
| Wagtail Close | NW9 5DN |
| Warmwell Avenue | NW9 5DB |
Transport near Burnt Oak
-
Colindale Station
-
Burnt Oak Station
-
Mill Hill Broadway Station
-
Edgware Station
-
Queensbury Station
-
Kingsbury Station
-
Hendon Station
-
Hendon Central Station
-
Canons Park Station
-
Mill Hill East Station
- FAQ
- Price Paid By Year
- Property Type Price
Frequently asked questions about Burnt Oak
What is the average price for a property for sale in Burnt Oak?
The average price for a property for sale in Burnt Oak is £451,730. This amount is 44% lower than the average price in London. There are 4,091 property listings for sale in Burnt Oak.
What streets have the most expensive properties for sale in Burnt Oak?
The streets with the most expensive properties for sale in Burnt Oak are Eversfield Gardens at an average of £640,000, Braemar Gardens at an average of £634,500 and Southbourne Avenue at an average of £589,583.
What streets have the most affordable properties for sale in Burnt Oak?
The streets with the most affordable properties for sale in Burnt Oak are Lanacre Avenue at an average of £246,562, Aeroville at an average of £255,000 and The Hyde at an average of £255,000.
Which train stations are available in or near Burnt Oak?
Some of the train stations available in or near Burnt Oak are Mill Hill Broadway and Hendon.
Which tube stations are available in or near Burnt Oak?
Some of the tube stations available in or near Burnt Oak are Colindale, Burnt Oak and Edgware.
Property Price Paid in Burnt Oak by Year
The average sold property price by year was:
| Year | Average Sold Price | Price Change |
Sold Properties
|
|---|---|---|---|
| 2025 | £414,000 | -11% |
17 Properties |
| 2024 | £461,532 | -7% |
31 Properties |
| 2023 | £492,552 | 11% |
19 Properties |
| 2022 | £438,041 | 11% |
32 Properties |
| 2021 | £391,757 | 13% |
33 Properties |
| 2020 | £339,329 | -5% |
55 Properties |
| 2019 | £355,896 | -1% |
34 Properties |
| 2018 | £359,959 | -3% |
38 Properties |
| 2017 | £371,722 | 5% |
40 Properties |
| 2016 | £354,147 | 6% |
53 Properties |
| 2015 | £331,132 | 14% |
51 Properties |
| 2014 | £285,624 | 10% |
44 Properties |
| 2013 | £258,216 | 6% |
53 Properties |
| 2012 | £243,161 | 2% |
40 Properties |
| 2011 | £237,546 | 2% |
32 Properties |
| 2010 | £232,919 | 12% |
23 Properties |
| 2009 | £204,012 | -0,2% |
20 Properties |
| 2008 | £204,326 | -21% |
35 Properties |
| 2007 | £246,875 | 11% |
77 Properties |
| 2006 | £220,425 | 7% |
70 Properties |
| 2005 | £205,811 | 9% |
115 Properties |
| 2004 | £187,904 | 8% |
161 Properties |
| 2003 | £172,246 | 16% |
97 Properties |
| 2002 | £143,993 | 9% |
71 Properties |
| 2001 | £130,534 | 17% |
76 Properties |
| 2000 | £108,130 | 4% |
64 Properties |
| 1999 | £103,912 | 18% |
74 Properties |
| 1998 | £85,198 | 12% |
79 Properties |
| 1997 | £75,174 | 16% |
78 Properties |
| 1996 | £63,028 | -3% |
78 Properties |
| 1995 | £64,763 | - |
57 Properties |
Property Price per Property Type in Burnt Oak
Here you can find historic sold price data in order to help with your property search.
The average Property Paid Price for specific property types in the last three years are:
| Property Type | Average Sold Price | Sold Properties |
|---|---|---|
| Semi Detached House | £577,064.00 | 35 Semi Detached Houses |
| Detached House | £402,500.00 | 2 Detached Houses |
| Terraced House | £485,456.00 | 30 Terraced Houses |
| Flat | £286,105.00 | 32 Flats |

