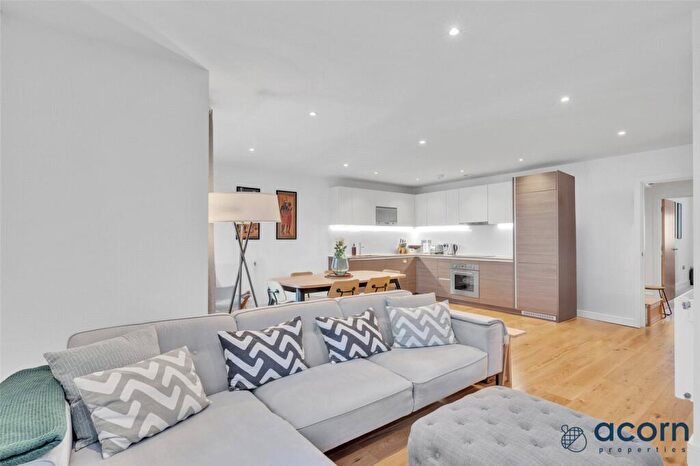
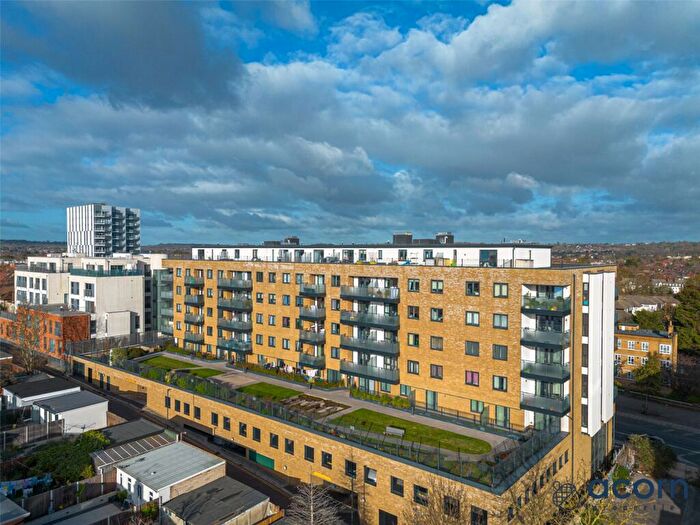
Houses for sale & to rent in Queensbury, London
House Prices in Queensbury
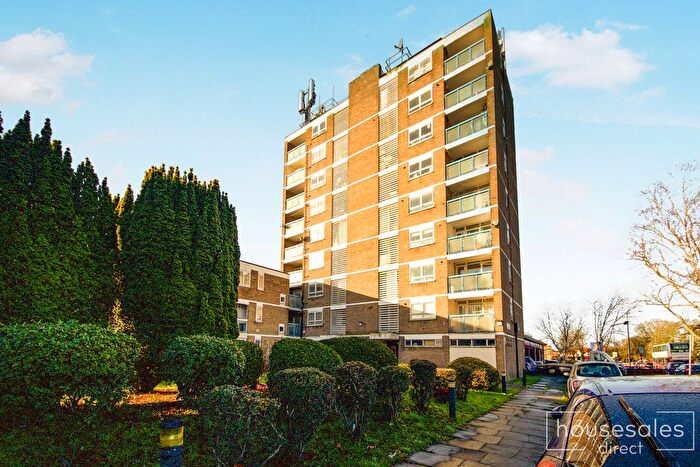
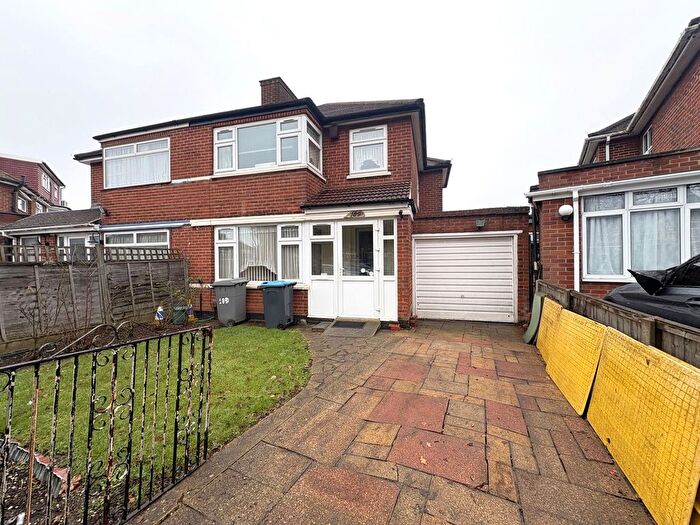
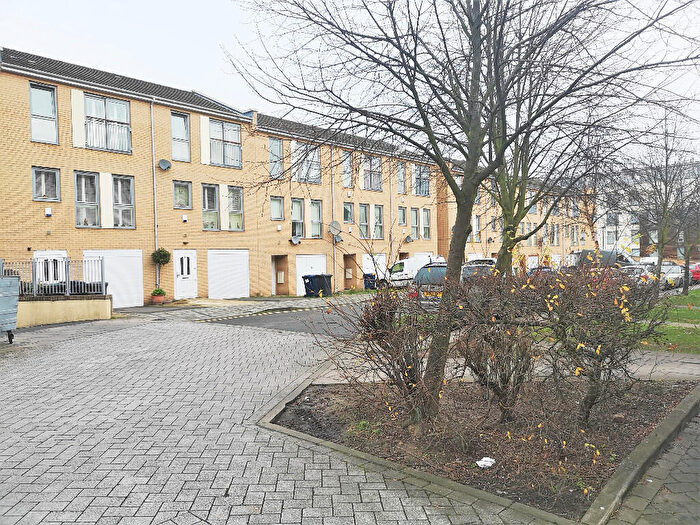
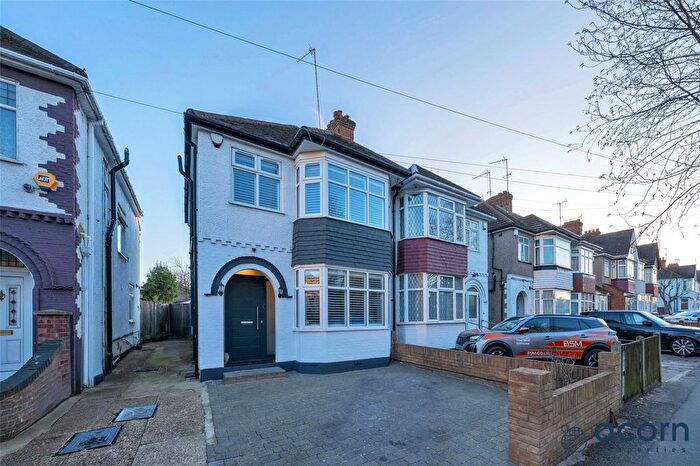
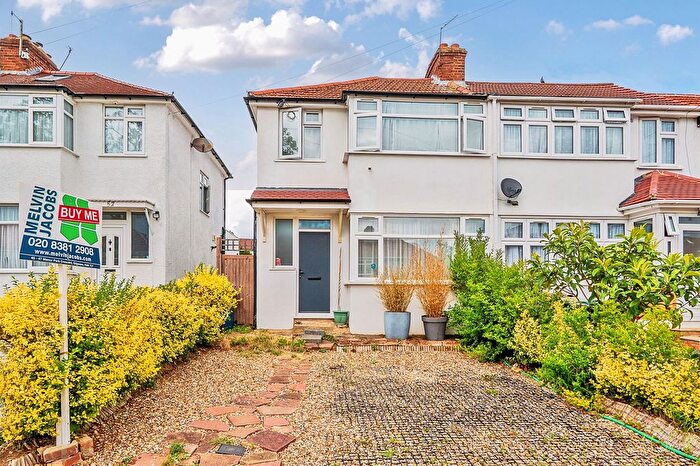
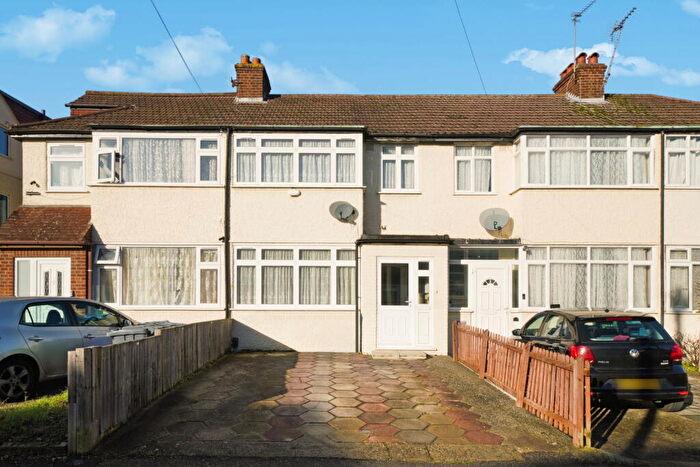
Properties in this part of Queensbury within London have an average house price of £493,509.00 and had 274 Property Transactions within the last 3 years¹. This area has 3,276 households² , where the most expensive property was sold for £950,000.00.
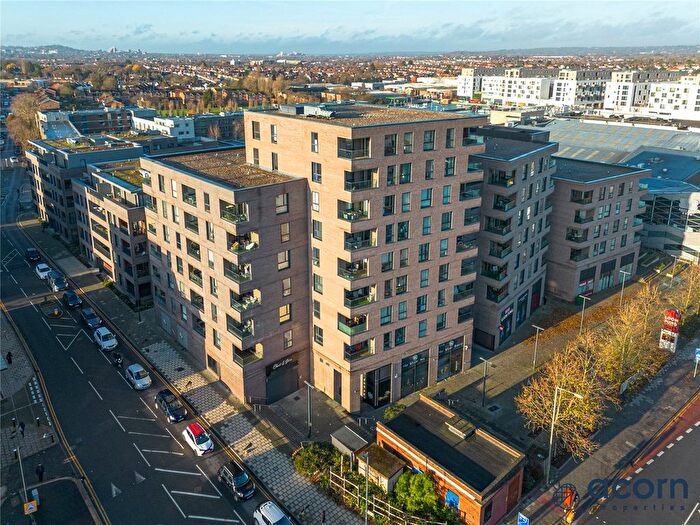
Properties for sale in Queensbury
Roads and Postcodes in Queensbury
Navigate through our locations to find the location of your next house in Queensbury, London for sale or to rent.
Transport near Queensbury
-
Kingsbury Station
-
Queensbury Station
-
Burnt Oak Station
-
Colindale Station
-
Canons Park Station
-
Edgware Station
-
Hendon Station
-
Preston Road Station
-
Mill Hill Broadway Station
-
Wembley Park Station
- FAQ
- Price Paid By Year
- Property Type Price
Frequently asked questions about Queensbury
What is the average price for a property for sale in Queensbury?
The average price for a property for sale in Queensbury is £493,509. This amount is 30% lower than the average price in London. There are 2,009 property listings for sale in Queensbury.
What streets have the most expensive properties for sale in Queensbury?
The streets with the most expensive properties for sale in Queensbury are Carlisle Road at an average of £950,000, Tennyson Avenue at an average of £789,950 and Oriental Square at an average of £711,666.
What streets have the most affordable properties for sale in Queensbury?
The streets with the most affordable properties for sale in Queensbury are Kingsbury Road at an average of £301,833, Capitol Way at an average of £385,739 and Rose Bates Drive at an average of £440,250.
Which train stations are available in or near Queensbury?
Some of the train stations available in or near Queensbury are Hendon and Mill Hill Broadway.
Which tube stations are available in or near Queensbury?
Some of the tube stations available in or near Queensbury are Kingsbury, Queensbury and Burnt Oak.
Property Price Paid in Queensbury by Year
The average sold property price by year was:
| Year | Average Sold Price | Price Change |
Sold Properties
|
|---|---|---|---|
| 2025 | £510,754 | 5% |
47 Properties |
| 2024 | £484,739 | -3% |
92 Properties |
| 2023 | £498,885 | 2% |
62 Properties |
| 2022 | £488,893 | 4% |
73 Properties |
| 2021 | £467,992 | -5% |
181 Properties |
| 2020 | £492,569 | 6% |
126 Properties |
| 2019 | £462,420 | -11% |
75 Properties |
| 2018 | £513,535 | 8% |
106 Properties |
| 2017 | £470,631 | 28% |
58 Properties |
| 2016 | £338,526 | -17% |
234 Properties |
| 2015 | £394,959 | 9% |
188 Properties |
| 2014 | £360,822 | 13% |
72 Properties |
| 2013 | £315,573 | 4% |
54 Properties |
| 2012 | £301,517 | 2% |
39 Properties |
| 2011 | £295,359 | 2% |
68 Properties |
| 2010 | £289,534 | 11% |
51 Properties |
| 2009 | £257,425 | -3% |
27 Properties |
| 2008 | £266,130 | -9% |
73 Properties |
| 2007 | £289,228 | 11% |
102 Properties |
| 2006 | £256,467 | 3% |
98 Properties |
| 2005 | £249,156 | 0,4% |
79 Properties |
| 2004 | £248,069 | 6% |
121 Properties |
| 2003 | £232,590 | 5% |
155 Properties |
| 2002 | £221,176 | 24% |
152 Properties |
| 2001 | £167,418 | 10% |
114 Properties |
| 2000 | £150,728 | 20% |
123 Properties |
| 1999 | £120,470 | 6% |
134 Properties |
| 1998 | £113,648 | 19% |
118 Properties |
| 1997 | £91,582 | 10% |
98 Properties |
| 1996 | £82,602 | 5% |
117 Properties |
| 1995 | £78,433 | - |
99 Properties |
Property Price per Property Type in Queensbury
Here you can find historic sold price data in order to help with your property search.
The average Property Paid Price for specific property types in the last three years are:
| Property Type | Average Sold Price | Sold Properties |
|---|---|---|
| Flat | £389,954.00 | 122 Flats |
| Semi Detached House | £599,391.00 | 65 Semi Detached Houses |
| Detached House | £731,750.00 | 4 Detached Houses |
| Terraced House | £551,321.00 | 83 Terraced Houses |

