
Houses for sale & to rent in Edgware, Edgware
House Prices in Edgware
Properties in this part of Edgware within Edgware have an average house price of £469k and had 221 Property Transactions within the last 3 years¹. This area has 3,709 households² , where the most expensive property was sold for £880k.
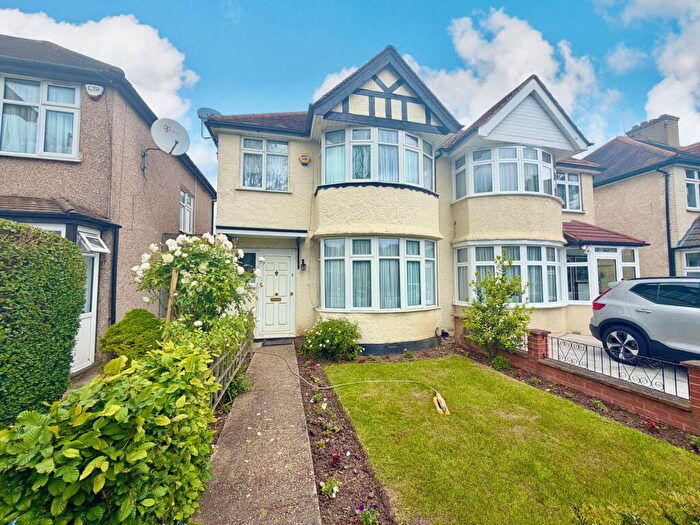
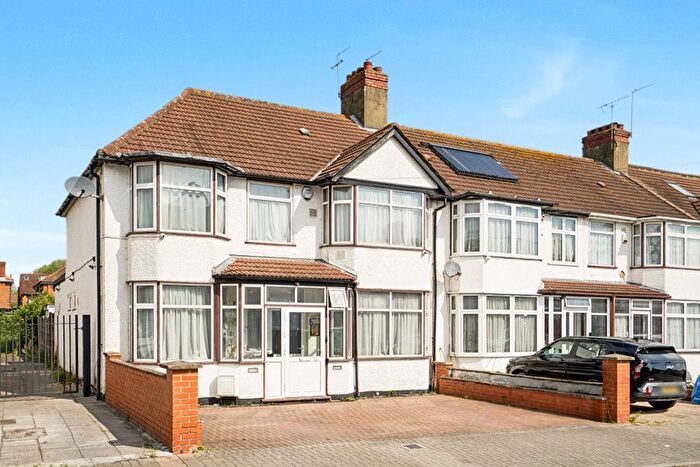
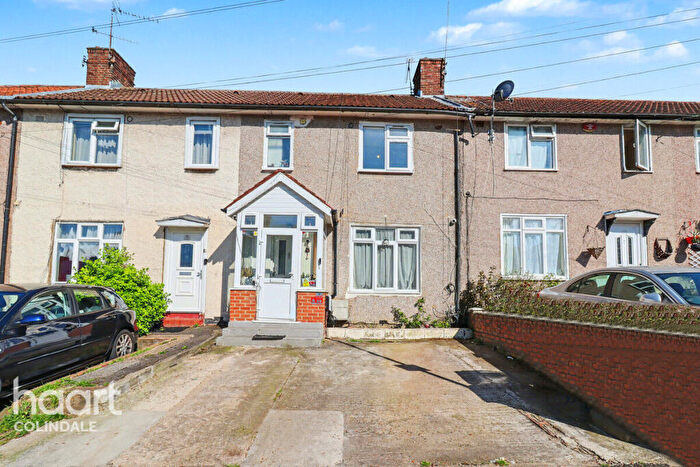
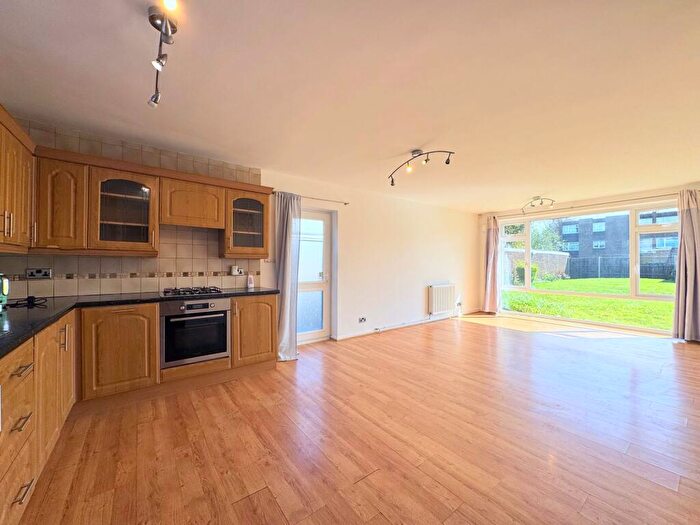
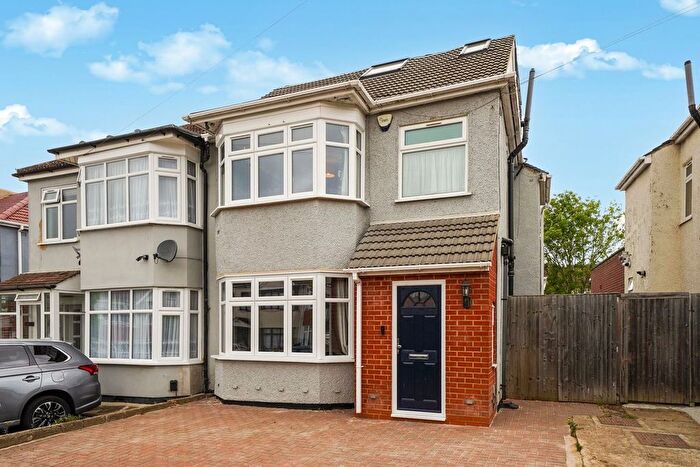
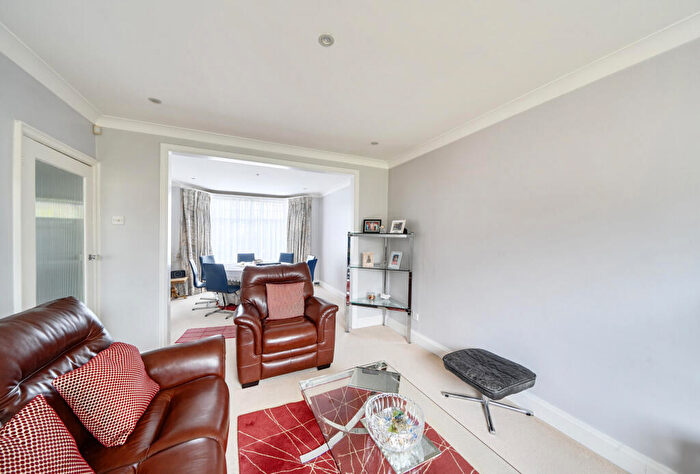
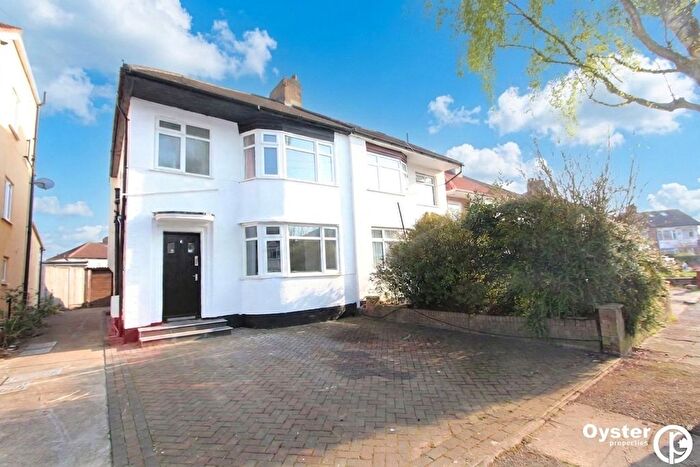
Properties for sale in Edgware
![]()
If you are looking to sell your house, let it out, or receive a property valuation, an expert can help you.
Click the button below to get started.


Roads and Postcodes in Edgware
Navigate through our locations to find the location of your next house in Edgware, Edgware for sale or to rent.
Transport near Edgware
-
 Burnt Oak Station
 -
Queensbury Station
-
Canons Park Station
-
Edgware Station
-
Kingsbury Station
-
Colindale Station
-
 Mill Hill Broadway Station
 -
Stanmore Station
-
 Kenton Station
 -
Preston Road Station
- FAQ
- Price Paid By Year
- Property Type Price
Frequently asked questions about Edgware
What is the average price for a property for sale in Edgware?
The average price for a property for sale in Edgware is £469,121. This amount is 11% lower than the average price in Edgware. There are 2,245 property listings for sale in Edgware.
What streets have the most expensive properties for sale in Edgware?
The streets with the most expensive properties for sale in Edgware are Greencourt Avenue at an average of £880,000, Bacon Lane at an average of £649,100 and Kenmore Gardens at an average of £622,500.
What streets have the most affordable properties for sale in Edgware?
The streets with the most affordable properties for sale in Edgware are South Parade at an average of £206,250, Selwyn Court at an average of £225,699 and Whitchurch Avenue at an average of £231,500.
Which train stations are available in or near Edgware?
Some of the train stations available in or near Edgware are Mill Hill Broadway and Kenton.
Which tube stations are available in or near Edgware?
Some of the tube stations available in or near Edgware are Burnt Oak, Queensbury and Canons Park.
Property Price Paid in Edgware by Year
The average sold property price by year was:
| Year | Average Sold Price | Price Change |
Sold Properties
|
|---|---|---|---|
| 2026 | £385,000 | -24% |
4 Properties |
| 2025 | £476,922 | 1% |
66 Properties |
| 2024 | £472,564 | 2% |
75 Properties |
| 2023 | £463,375 | -4% |
76 Properties |
| 2022 | £483,818 | 4% |
80 Properties |
| 2021 | £465,583 | 6% |
100 Properties |
| 2020 | £436,231 | 3% |
82 Properties |
| 2019 | £425,214 | -8% |
66 Properties |
| 2018 | £458,407 | 5% |
78 Properties |
| 2017 | £435,632 | 11% |
78 Properties |
| 2016 | £385,860 | 12% |
127 Properties |
| 2015 | £339,265 | -1% |
244 Properties |
| 2014 | £342,282 | 10% |
107 Properties |
| 2013 | £307,091 | 3% |
70 Properties |
| 2012 | £297,731 | 12% |
56 Properties |
| 2011 | £262,208 | -1% |
94 Properties |
| 2010 | £264,571 | 6% |
61 Properties |
| 2009 | £247,652 | -9% |
58 Properties |
| 2008 | £269,982 | 0,2% |
91 Properties |
| 2007 | £269,330 | 10% |
151 Properties |
| 2006 | £242,551 | 7% |
150 Properties |
| 2005 | £225,294 | -10% |
136 Properties |
| 2004 | £247,390 | 13% |
150 Properties |
| 2003 | £214,804 | 14% |
169 Properties |
| 2002 | £185,055 | 15% |
178 Properties |
| 2001 | £157,311 | 1% |
170 Properties |
| 2000 | £156,330 | 26% |
172 Properties |
| 1999 | £114,958 | 17% |
187 Properties |
| 1998 | £95,840 | 5% |
145 Properties |
| 1997 | £91,039 | 14% |
165 Properties |
| 1996 | £78,209 | 9% |
148 Properties |
| 1995 | £71,296 | - |
136 Properties |
Property Price per Property Type in Edgware
Here you can find historic sold price data in order to help with your property search.
The average Property Paid Price for specific property types in the last three years are:
| Property Type | Average Sold Price | Sold Properties |
|---|---|---|
| Flat | £289,515.00 | 61 Flats |
| Semi Detached House | £552,431.00 | 97 Semi Detached Houses |
| Detached House | £583,750.00 | 2 Detached Houses |
| Terraced House | £512,490.00 | 61 Terraced Houses |