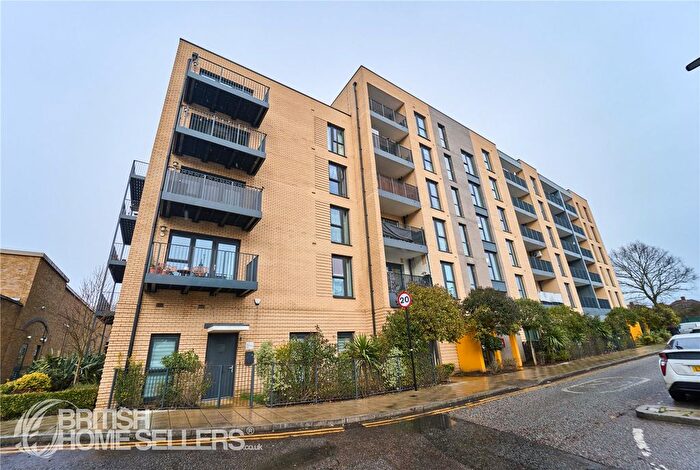
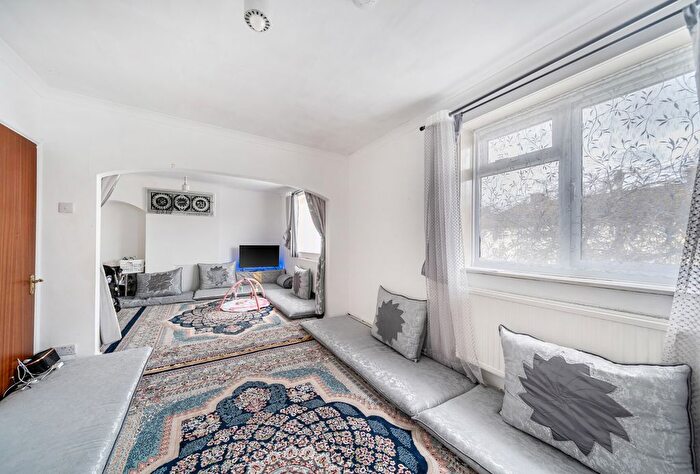
Houses for sale & to rent in Queensbury, Edgware
House Prices in Queensbury
Properties in this part of Queensbury within Edgware have an average house price of £523,666.00 and had 42 Property Transactions within the last 3 years¹. This area has 1,449 households² , where the most expensive property was sold for £890,000.00.
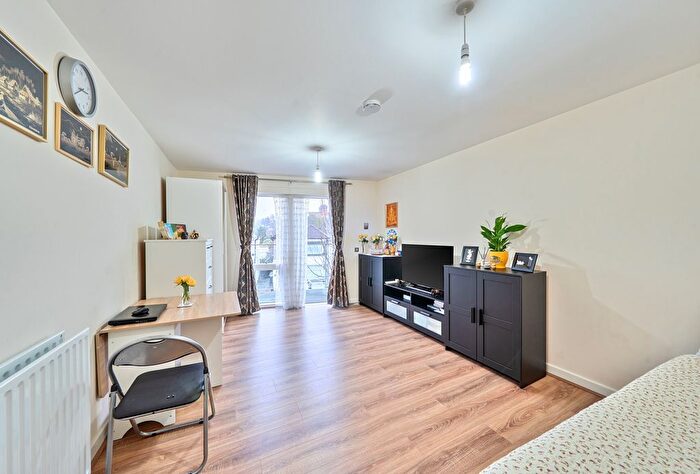
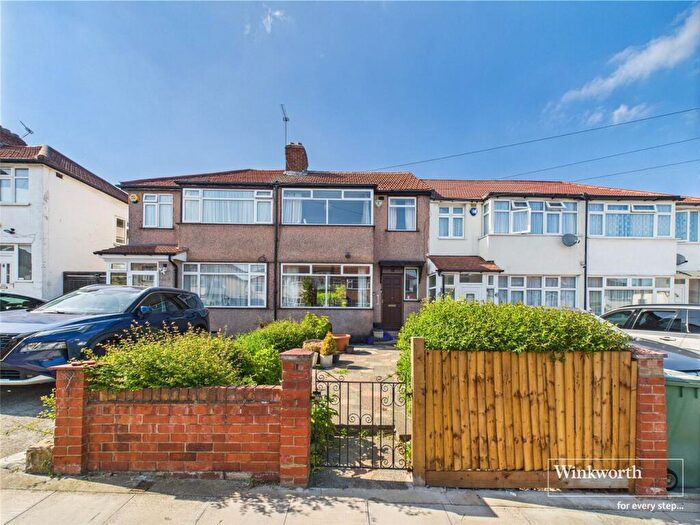
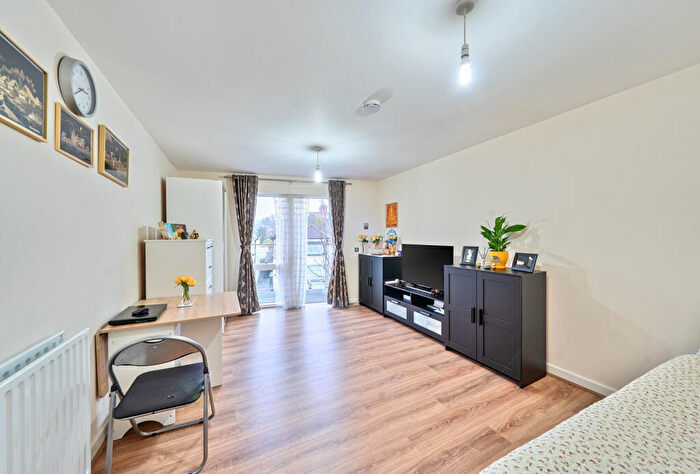
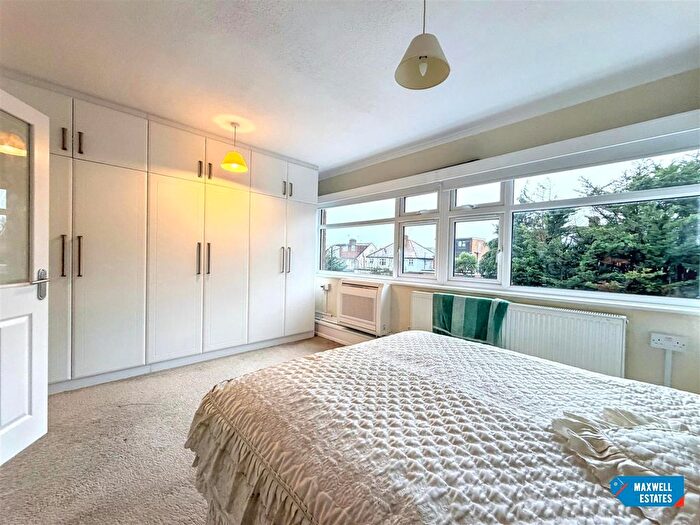
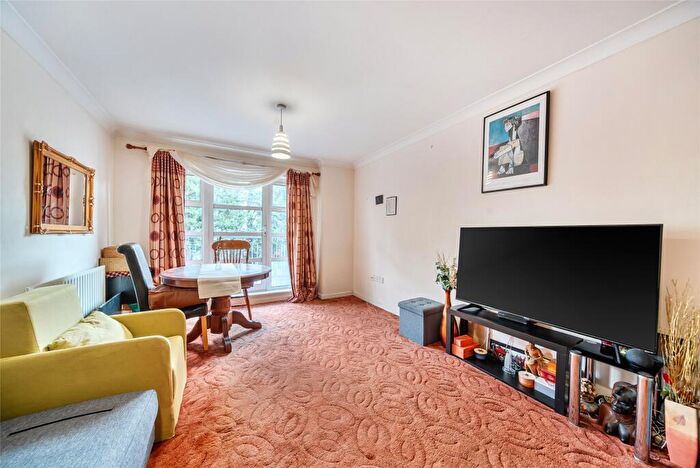
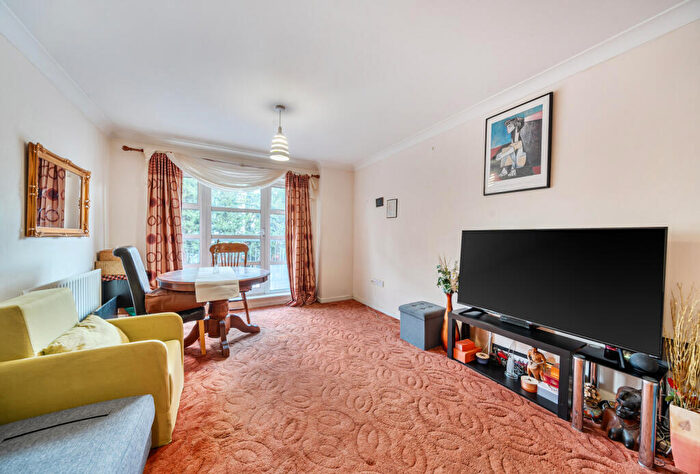
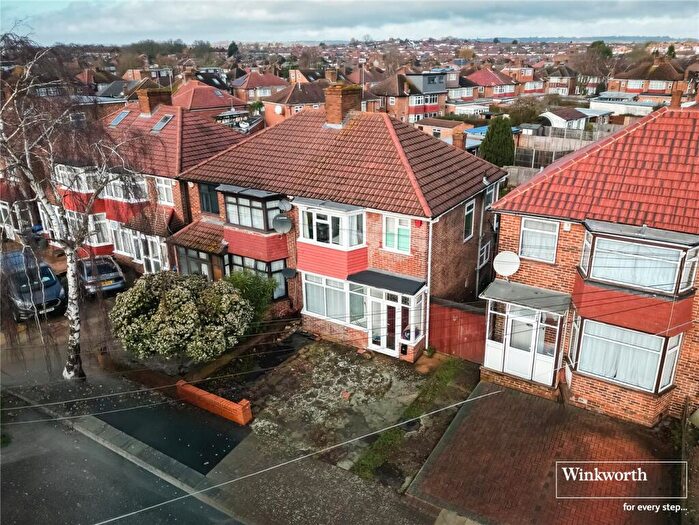
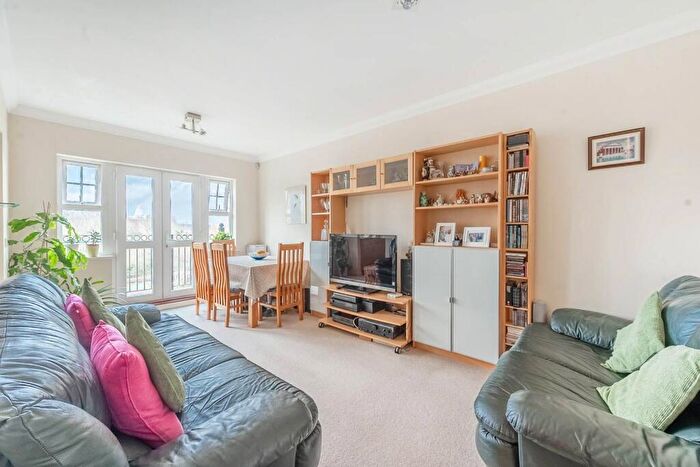
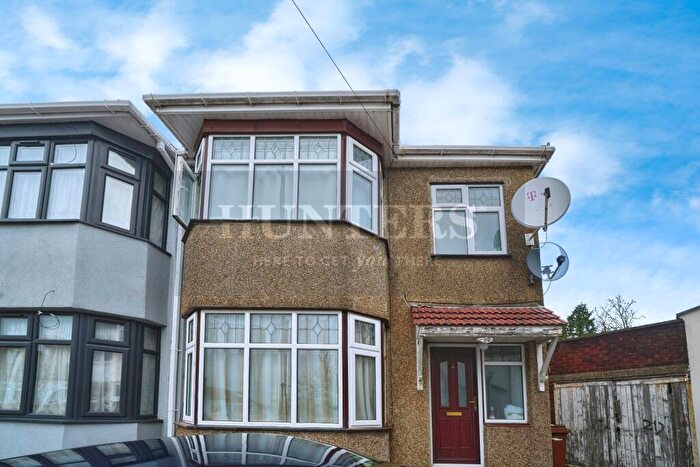
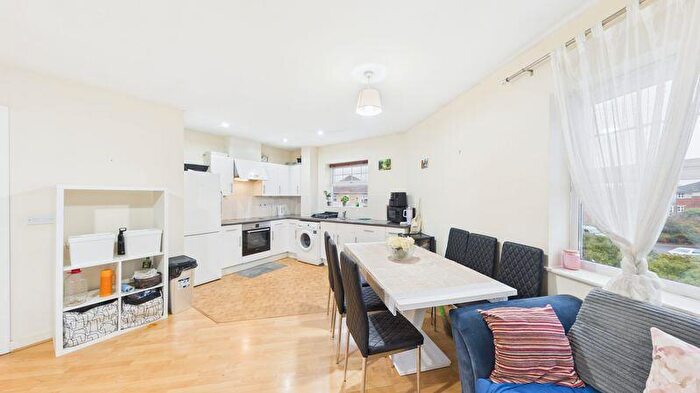
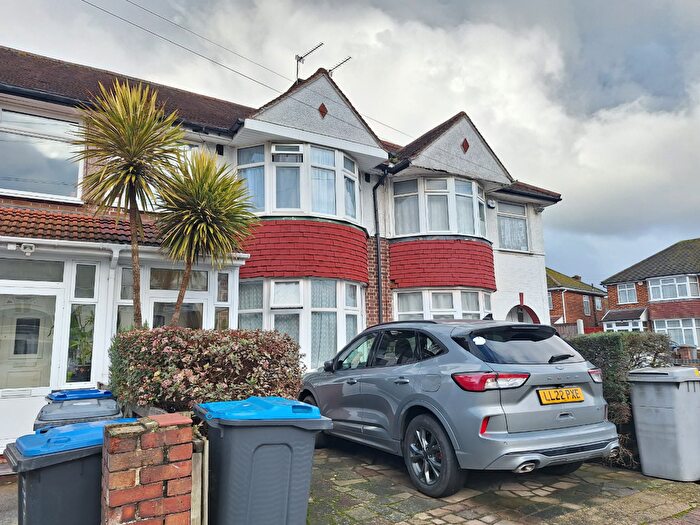
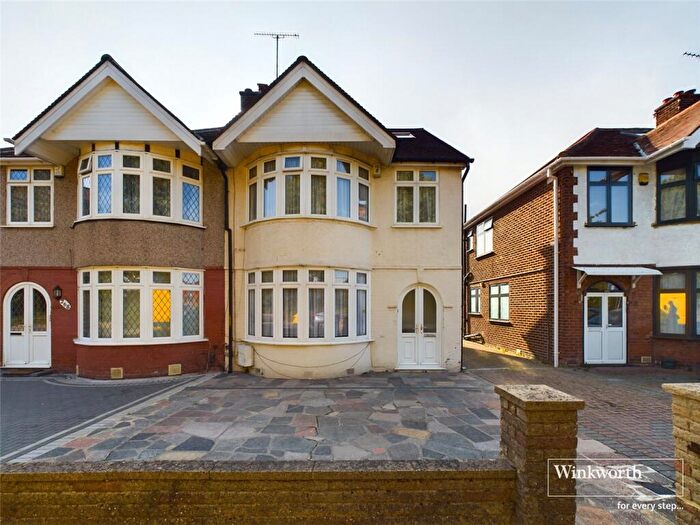
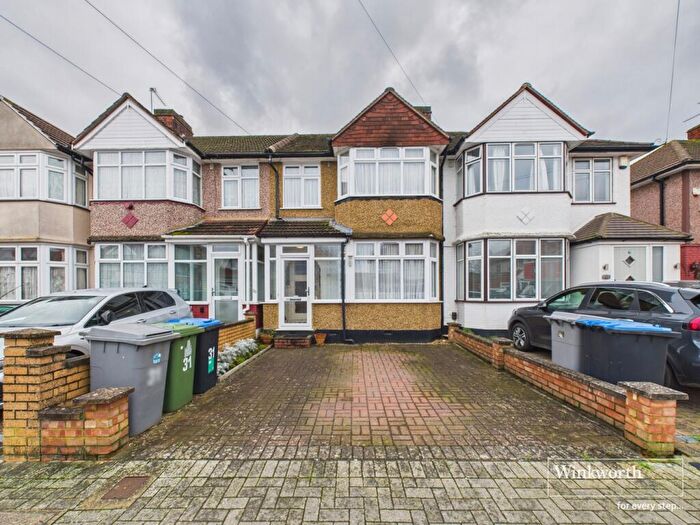
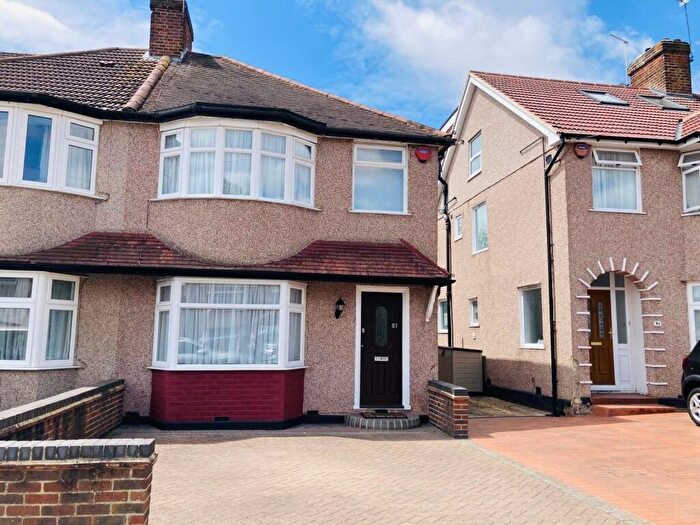
Properties for sale in Queensbury
Roads and Postcodes in Queensbury
Navigate through our locations to find the location of your next house in Queensbury, Edgware for sale or to rent.
| Streets | Postcodes |
|---|---|
| Beverley Drive | HA8 5NB HA8 5ND HA8 5NE HA8 5NF HA8 5NG HA8 5NH HA8 5NJ HA8 5NL HA8 5NQ |
| Birchwood Court | HA8 5JE |
| Brinkburn Close | HA8 5PW |
| Brinkburn Gardens | HA8 5PL HA8 5PN HA8 5PP |
| Burnt Oak Broadway | HA8 5JT HA8 5JZ HA8 5LD HA8 5FB |
| Butler Close | HA8 5QQ |
| Calder Gardens | HA8 5PR HA8 5PT |
| Cobham Close | HA8 5QG |
| Croxden Close | HA8 5PS |
| De Havilland Road | HA8 5QB HA8 5QD |
| Essoldo Way | HA8 5NU |
| Halford Close | HA8 5QF |
| Holmstall Avenue | HA8 5JG HA8 5JH HA8 5JJ HA8 5JQ |
| Holmstall Parade | HA8 5HX |
| Holyrood Gardens | HA8 5LR HA8 5LS |
| Limesdale Gardens | HA8 5HY HA8 5HZ HA8 5JA HA8 5JD HA8 5JF |
| Melrose Gardens | HA8 5LN |
| Oak Gardens | HA8 5LF |
| Oakleigh Court | HA8 5JB |
| Queensbury Station Parade | HA8 5NN HA8 5NR HA8 5NP |
| Redhill Drive | HA8 5JL HA8 5JN |
| Scott Road | HA8 5QR HA8 5RA |
| Stag Close | HA8 5LQ |
| Stag Lane | HA8 5LE HA8 5LG HA8 5LH HA8 5LJ HA8 5LL HA8 5LP HA8 5LW |
| Waltham Drive | HA8 5PH HA8 5PJ |
| Warren Way | HA8 5RB |
| HA8 5FQ |
Transport near Queensbury
-
Burnt Oak Station
-
Queensbury Station
-
Kingsbury Station
-
Colindale Station
-
Canons Park Station
-
Edgware Station
-
Mill Hill Broadway Station
-
Hendon Station
-
Preston Road Station
-
Stanmore Station
- FAQ
- Price Paid By Year
- Property Type Price
Frequently asked questions about Queensbury
What is the average price for a property for sale in Queensbury?
The average price for a property for sale in Queensbury is £523,666. There are 2,150 property listings for sale in Queensbury.
What streets have the most expensive properties for sale in Queensbury?
The streets with the most expensive properties for sale in Queensbury are Beverley Drive at an average of £704,714, Birchwood Court at an average of £625,000 and De Havilland Road at an average of £605,000.
What streets have the most affordable properties for sale in Queensbury?
The streets with the most affordable properties for sale in Queensbury are Croxden Close at an average of £230,000, Scott Road at an average of £278,333 and Butler Close at an average of £320,000.
Which train stations are available in or near Queensbury?
Some of the train stations available in or near Queensbury are Mill Hill Broadway and Hendon.
Which tube stations are available in or near Queensbury?
Some of the tube stations available in or near Queensbury are Burnt Oak, Queensbury and Kingsbury.
Property Price Paid in Queensbury by Year
The average sold property price by year was:
| Year | Average Sold Price | Price Change |
Sold Properties
|
|---|---|---|---|
| 2025 | £508,733 | -7% |
15 Properties |
| 2024 | £543,777 | 7% |
18 Properties |
| 2023 | £508,333 | 5% |
9 Properties |
| 2022 | £484,878 | -5% |
23 Properties |
| 2021 | £508,420 | 27% |
25 Properties |
| 2020 | £369,720 | -15% |
30 Properties |
| 2019 | £423,782 | -14% |
25 Properties |
| 2018 | £482,250 | 17% |
15 Properties |
| 2017 | £402,512 | -10% |
24 Properties |
| 2016 | £444,119 | 7% |
21 Properties |
| 2015 | £411,604 | 23% |
36 Properties |
| 2014 | £315,614 | -5% |
48 Properties |
| 2013 | £332,426 | 11% |
28 Properties |
| 2012 | £296,678 | -5% |
14 Properties |
| 2011 | £312,578 | 11% |
25 Properties |
| 2010 | £278,467 | - |
32 Properties |
| 2009 | £278,496 | -5% |
15 Properties |
| 2008 | £292,233 | 3% |
15 Properties |
| 2007 | £284,017 | 3% |
85 Properties |
| 2006 | £276,189 | 6% |
87 Properties |
| 2005 | £259,573 | 6% |
25 Properties |
| 2004 | £243,123 | 0,4% |
40 Properties |
| 2003 | £242,106 | 15% |
55 Properties |
| 2002 | £206,964 | 15% |
46 Properties |
| 2001 | £176,028 | 12% |
51 Properties |
| 2000 | £155,563 | 12% |
61 Properties |
| 1999 | £136,822 | 13% |
43 Properties |
| 1998 | £118,374 | 11% |
58 Properties |
| 1997 | £105,357 | 18% |
39 Properties |
| 1996 | £86,166 | 6% |
46 Properties |
| 1995 | £80,758 | - |
31 Properties |
Property Price per Property Type in Queensbury
Here you can find historic sold price data in order to help with your property search.
The average Property Paid Price for specific property types in the last three years are:
| Property Type | Average Sold Price | Sold Properties |
|---|---|---|
| Semi Detached House | £583,047.00 | 21 Semi Detached Houses |
| Detached House | £795,000.00 | 2 Detached Houses |
| Terraced House | £548,636.00 | 11 Terraced Houses |
| Flat | £265,625.00 | 8 Flats |

