
Houses for sale & to rent in N2 0TQ, Elm Gardens, East Finchley, London
House Prices in N2 0TQ, Elm Gardens, East Finchley
Properties in N2 0TQ have an average house price of £685,000.00 and had 1 Property Transaction within the last 3 years.¹ N2 0TQ is a postcode in Elm Gardens located in East Finchley, an area in London, Barnet London Borough, with 3 households², where the most expensive property was sold for £685,000.00.
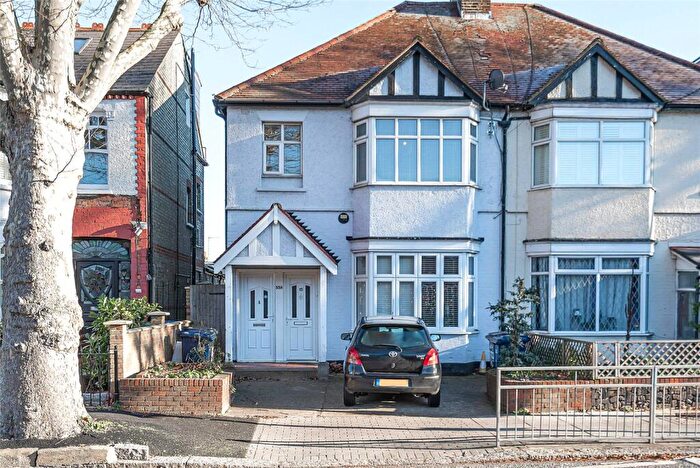
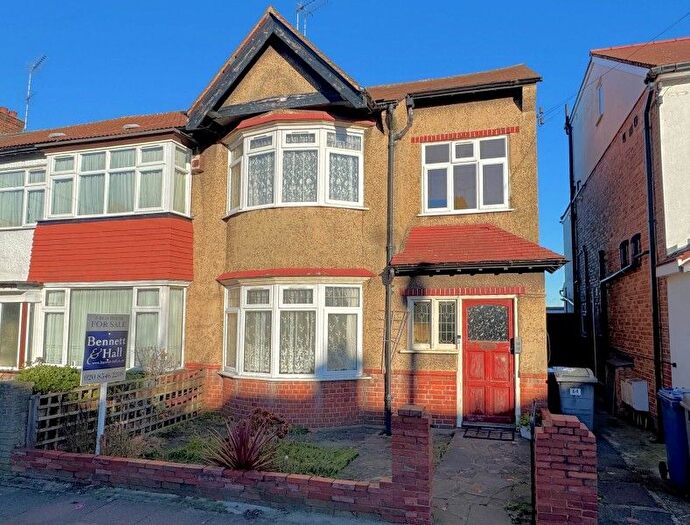
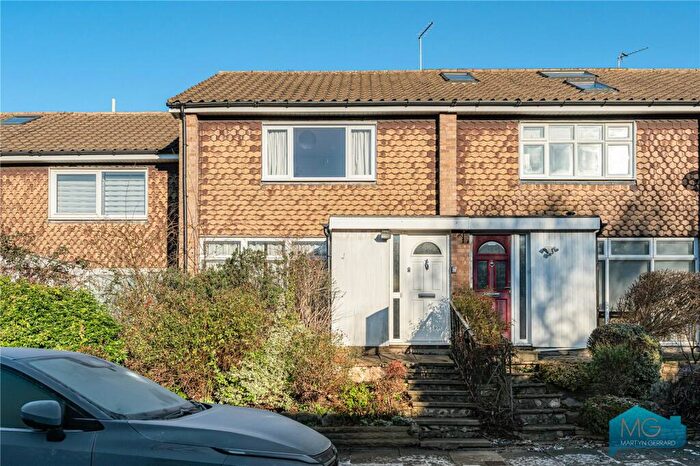
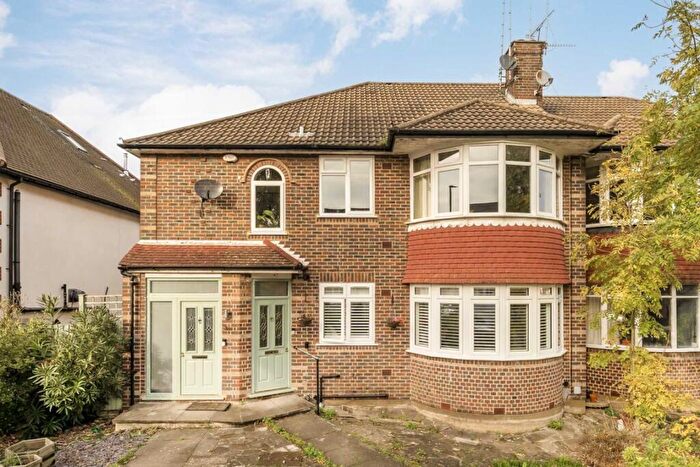
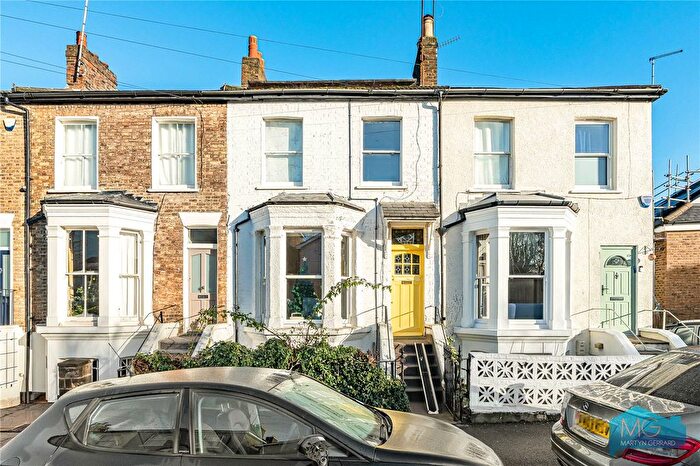
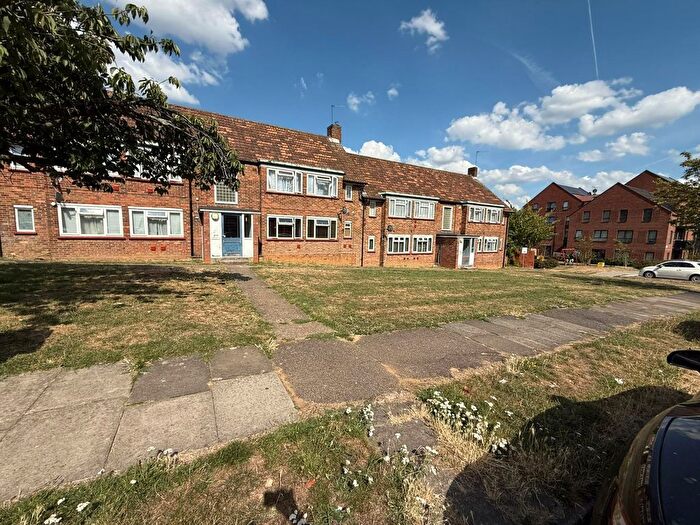
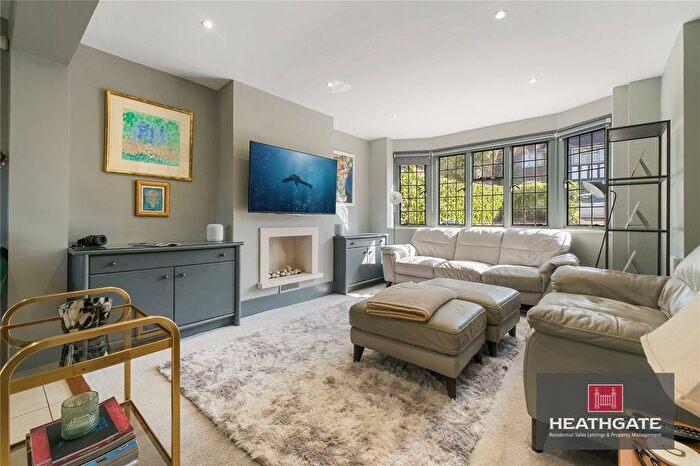
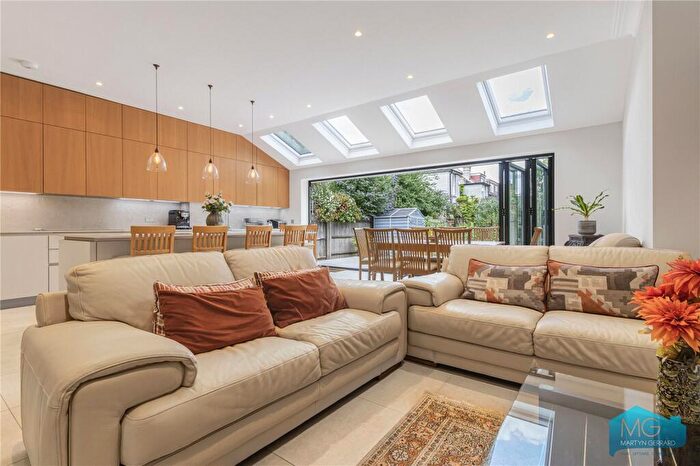
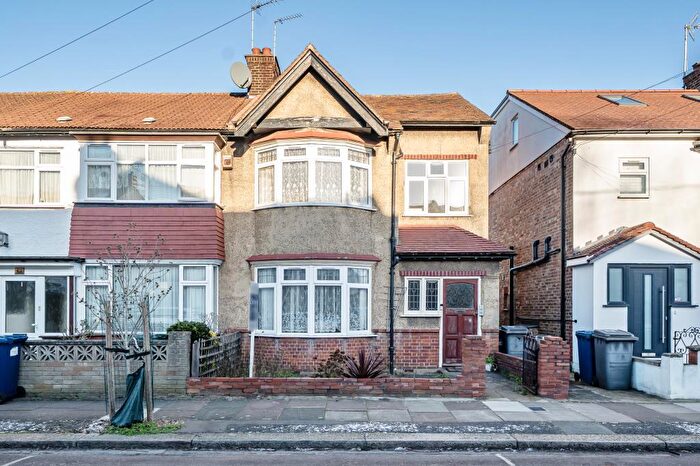
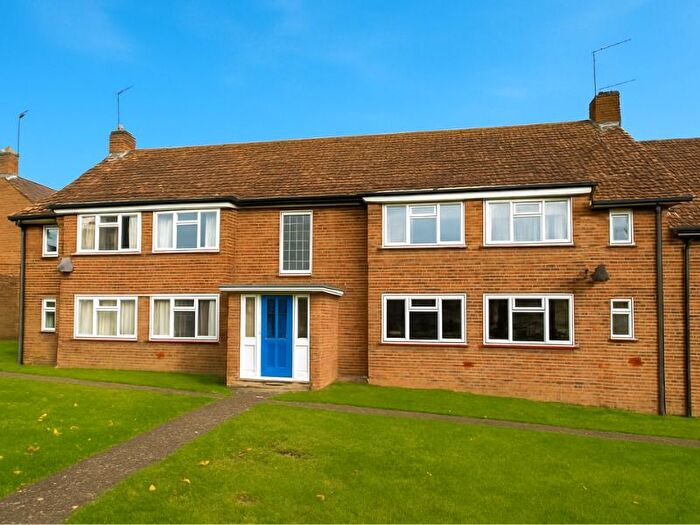
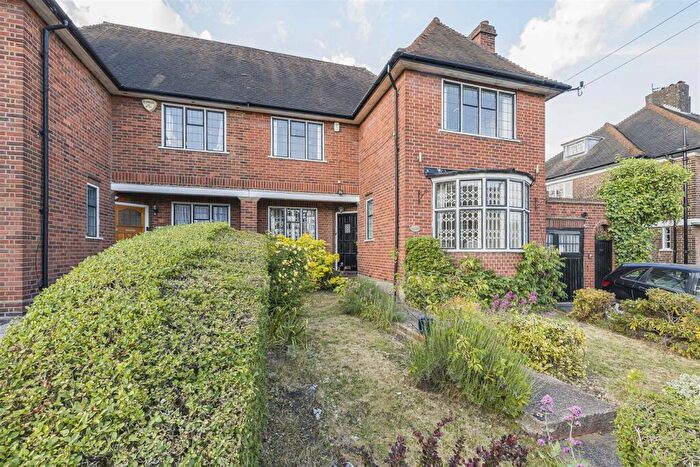
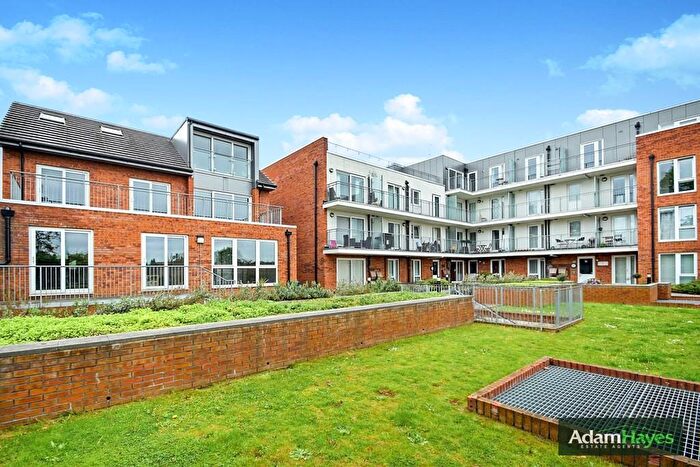
Properties for sale near N2 0TQ, Elm Gardens
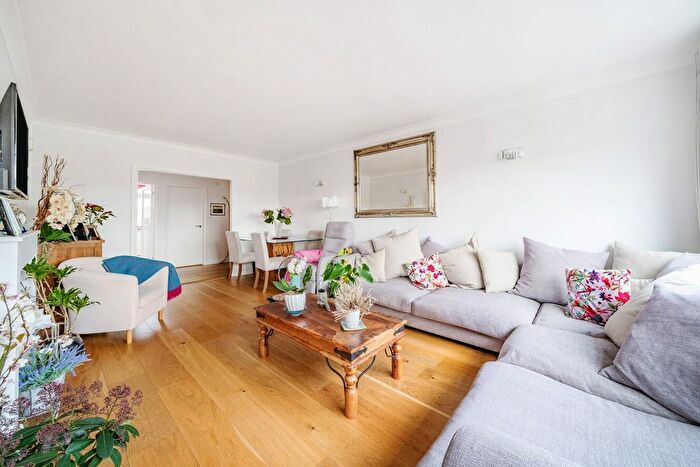


![]()
If you are looking to sell your house, let it out, or receive a property valuation, an expert can help you.
Click the button below to get started.

Price Paid in Elm Gardens, N2 0TQ, East Finchley
ELMWOOD COURT FLAT 2 Elm Gardens, N2 0TQ, East Finchley London
Property ELMWOOD COURT FLAT 2 has been sold 4 times. The last time it was sold was in 19/08/2025 and the sold price was £685,000.00.
This is a Flat which was sold as a leasehold in 19/08/2025
| Date | Price | Property Type | Tenure | Classification |
|---|---|---|---|---|
| 19/08/2025 | £685,000.00 | Flat | leasehold | Established Building |
| 26/03/2021 | £600,000.00 | Flat | leasehold | Established Building |
| 10/03/2006 | £249,999.00 | Flat | leasehold | Established Building |
| 23/07/1999 | £108,000.00 | Flat | leasehold | Established Building |
ELMWOOD COURT FLAT 1 Elm Gardens, N2 0TQ, East Finchley London
Property ELMWOOD COURT FLAT 1 has been sold 1 time. The last time it was sold was in 22/05/2014 and the sold price was £391,230.00.
This is a Flat which was sold as a leasehold in 22/05/2014
| Date | Price | Property Type | Tenure | Classification |
|---|---|---|---|---|
| 22/05/2014 | £391,230.00 | Flat | leasehold | Established Building |
Postcodes in Elm Gardens, East Finchley
Navigate through other locations in Elm Gardens, East Finchley, London to see more property listings for sale or to rent.
Transport near N2 0TQ, Elm Gardens
-
 East Finchley Station
 -
Finchley Central Station
-
West Finchley Station
-
Golders Green Station
-
Highgate Station
-
Woodside Park Station
-
Mill Hill East Station
-
Brent Cross Station
-
 New Southgate Station
 -
Hendon Central Station
House price paid reports for N2 0TQ, Elm Gardens
Click on the buttons below to see price paid reports by year or property price:
- Price Paid By Year
- Property Type Price
Property Price Paid in N2 0TQ, Elm Gardens by Year
The average sold property price by year was:
| Year | Average Sold Price | Price Change |
Sold Properties
|
|---|---|---|---|
| 2025 | £685,000 | 12% |
1 Property |
| 2021 | £600,000 | 35% |
1 Property |
| 2014 | £391,230 | 36% |
1 Property |
| 2006 | £249,999 | 57% |
1 Property |
| 1999 | £108,000 | - |
1 Property |
Property Price per Property Type in N2 0TQ, Elm Gardens
Here you can find historic sold price data in order to help with your property search.
The average Property Paid Price for specific property types in the last three years are:
| Property Type | Average Sold Price | Sold Properties |
|---|---|---|
| Flat | £685,000.00 | 1 Flat |