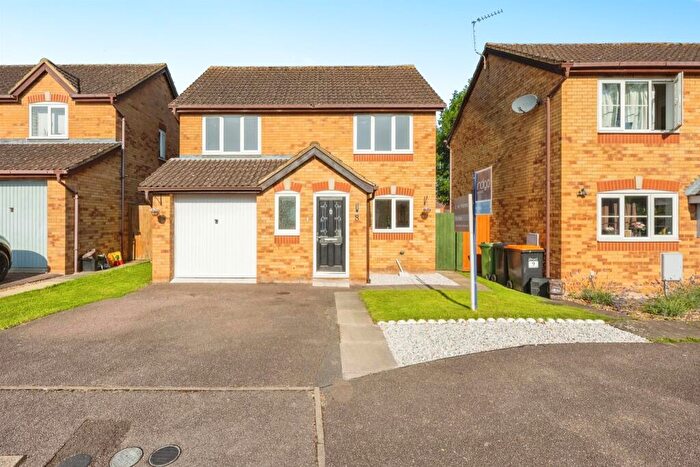
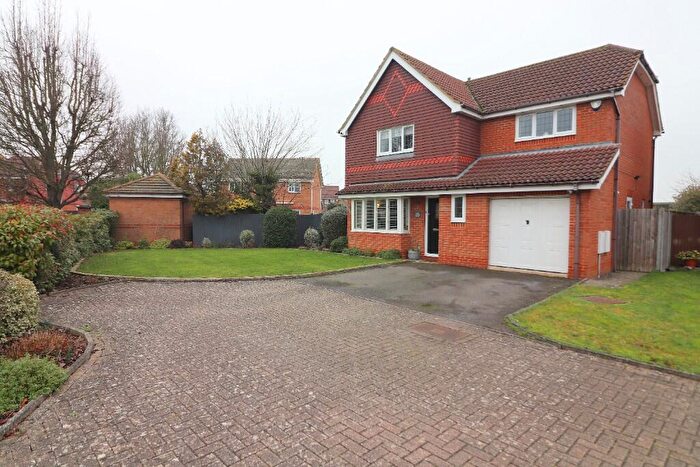
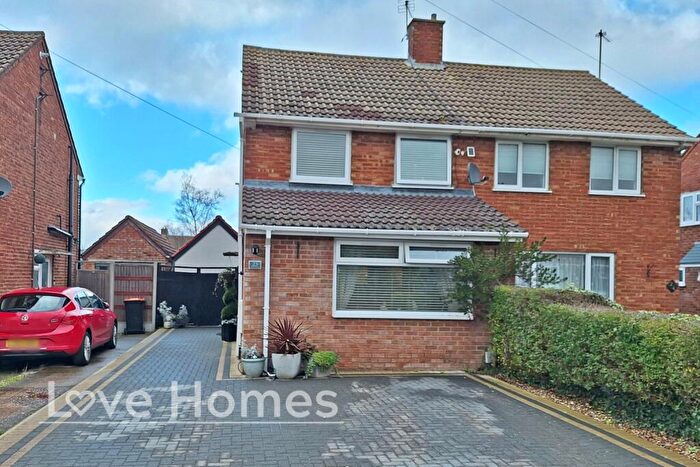
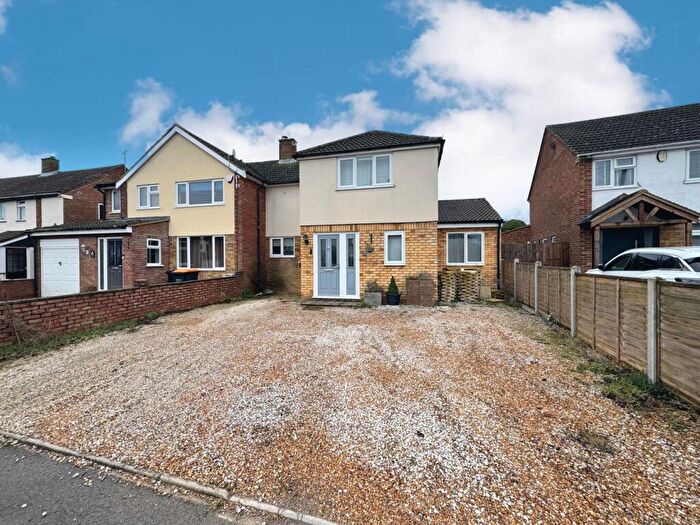
Houses for sale & to rent in Barton-le-clay, Bedford
House Prices in Barton-le-clay
Properties in Barton-le-clay have an average house price of £404,472.00 and had 174 Property Transactions within the last 3 years¹.
Barton-le-clay is an area in Bedford, Bedfordshire with 2,022 households², where the most expensive property was sold for £920,000.00.
Properties for sale in Barton-le-clay
Roads and Postcodes in Barton-le-clay
Navigate through our locations to find the location of your next house in Barton-le-clay, Bedford for sale or to rent.
| Streets | Postcodes |
|---|---|
| Appleglebe | MK45 4PJ |
| Arnold Close | MK45 4PD |
| Ashby Drive | MK45 4SA |
| Barton Hill Road | LU2 8NE LU2 8NF |
| Barton Industrial Estate | MK45 4RJ MK45 4RP |
| Bedford Road | MK45 4JU MK45 4JX MK45 4LL MK45 4LP MK45 4LR MK45 4PP |
| Blakelands | MK45 4NW |
| Bradshaws Close | MK45 4JS |
| Brazier Close | MK45 4RW |
| Brookend Drive | MK45 4SQ |
| Burr Close | MK45 4RZ |
| Chiltern Road | MK45 4PB |
| Church Road | MK45 4LA |
| Churchill Road | MK45 4NH |
| Clarkes Pightle | MK45 4JW |
| Clipstone Mews | MK45 4FN |
| Cromwell Road | MK45 4PU |
| Dane Road | MK45 4QL |
| Dunstall Road | MK45 4NX |
| Faldo Road | MK45 4RF |
| Fisher Close | MK45 4NF |
| Franklin Avenue | MK45 4HF |
| Gale Court | MK45 4LH |
| Grange Farm Close | MK45 4RS |
| Grange Road | MK45 4RE |
| Grays Close | MK45 4PH |
| Hanover Place | MK45 4LU |
| Harold Road | MK45 4QH MK45 4QQ |
| Harris Court | MK45 4RY |
| Hastings Road | MK45 4NJ |
| Hexton Road | MK45 4JY MK45 4JZ MK45 4JT MK45 4TA |
| Higham Gobion Road | MK45 4LT |
| Horsler Close | MK45 4LW |
| Ivel Close | MK45 4NT |
| Jeremiah Close | MK45 4PG |
| King William Close | MK45 4QE |
| Lancaster Close | MK45 4PY |
| Lime Close | MK45 4PR |
| Longcroft Drive | MK45 4SF |
| Luton Road | MK45 4LG MK45 4LQ |
| Manor Farm Close | MK45 4TB |
| Manor Road | MK45 4NP MK45 4NR MK45 4NS MK45 4NU |
| Meadhook Drive | MK45 4RH |
| Mill Lane | MK45 4LN |
| Nicholls Close | MK45 4JN |
| Norman Road | MK45 4PS MK45 4PT MK45 4PX MK45 4QA MK45 4QD MK45 4QG |
| Old Road | MK45 4LB |
| Old School Gardens | MK45 4LS |
| Orchard Close | MK45 4LD |
| Osborn Road | MK45 4NY MK45 4NZ MK45 4PA |
| Park Meadow Close | MK45 4SB |
| Peck Court | MK45 4RN |
| Portobello Close | MK45 4SN |
| Private Road | MK45 4LE |
| Ramsey Road | MK45 4PE |
| Ravensburgh Close | MK45 4RG |
| Roman Road | MK45 4QJ |
| Royal Houses | MK45 4NE |
| Saxon Crescent | MK45 4LY |
| Sharpenhoe Road | MK45 4SD MK45 4SE |
| Shortcroft Court | MK45 4FB |
| Simpkins Drive | MK45 4RX |
| Smithcombe Close | MK45 4PL |
| Stanbridge View | MK45 4HN |
| Stuart Road | MK45 4NB MK45 4ND MK45 4NG |
| Taylor Close | MK45 4GD |
| Viking Close | MK45 4JQ |
| Washbrook Close | MK45 4LF |
| Whitehill Road | MK45 4PF |
| Wiffen Close | MK45 4FR |
| Windsor Parade | MK45 4NA |
| Windsor Road | MK45 4LX MK45 4LZ |
| York Close | MK45 4QB |
Transport near Barton-le-clay
- FAQ
- Price Paid By Year
- Property Type Price
Frequently asked questions about Barton-le-clay
What is the average price for a property for sale in Barton-le-clay?
The average price for a property for sale in Barton-le-clay is £404,472. This amount is 9% higher than the average price in Bedford. There are 439 property listings for sale in Barton-le-clay.
What streets have the most expensive properties for sale in Barton-le-clay?
The streets with the most expensive properties for sale in Barton-le-clay are Private Road at an average of £920,000, Old Road at an average of £847,000 and Manor Farm Close at an average of £839,500.
What streets have the most affordable properties for sale in Barton-le-clay?
The streets with the most affordable properties for sale in Barton-le-clay are Clipstone Mews at an average of £295,000, Ravensburgh Close at an average of £295,000 and Simpkins Drive at an average of £296,000.
Which train stations are available in or near Barton-le-clay?
Some of the train stations available in or near Barton-le-clay are Harlington, Flitwick and Leagrave.
Property Price Paid in Barton-le-clay by Year
The average sold property price by year was:
| Year | Average Sold Price | Price Change |
Sold Properties
|
|---|---|---|---|
| 2025 | £425,319 | 1% |
70 Properties |
| 2024 | £422,218 | 15% |
52 Properties |
| 2023 | £358,663 | -25% |
52 Properties |
| 2022 | £448,458 | 13% |
69 Properties |
| 2021 | £391,436 | 8% |
99 Properties |
| 2020 | £359,806 | 4% |
70 Properties |
| 2019 | £344,087 | 3% |
62 Properties |
| 2018 | £332,330 | 2% |
74 Properties |
| 2017 | £325,963 | -12% |
76 Properties |
| 2016 | £364,713 | 21% |
91 Properties |
| 2015 | £289,404 | 16% |
97 Properties |
| 2014 | £243,147 | 3% |
78 Properties |
| 2013 | £235,297 | -1% |
68 Properties |
| 2012 | £236,790 | -0,2% |
58 Properties |
| 2011 | £237,156 | 4% |
79 Properties |
| 2010 | £226,541 | 10% |
77 Properties |
| 2009 | £202,858 | -32% |
49 Properties |
| 2008 | £268,532 | 10% |
66 Properties |
| 2007 | £240,641 | 2% |
116 Properties |
| 2006 | £236,382 | 6% |
137 Properties |
| 2005 | £221,255 | 6% |
112 Properties |
| 2004 | £207,752 | 8% |
119 Properties |
| 2003 | £191,787 | 17% |
109 Properties |
| 2002 | £158,940 | 7% |
170 Properties |
| 2001 | £147,681 | 6% |
133 Properties |
| 2000 | £139,083 | 17% |
176 Properties |
| 1999 | £115,022 | 15% |
236 Properties |
| 1998 | £97,684 | -1% |
188 Properties |
| 1997 | £98,237 | 12% |
136 Properties |
| 1996 | £86,429 | -3% |
171 Properties |
| 1995 | £88,917 | - |
95 Properties |
Property Price per Property Type in Barton-le-clay
Here you can find historic sold price data in order to help with your property search.
The average Property Paid Price for specific property types in the last three years are:
| Property Type | Average Sold Price | Sold Properties |
|---|---|---|
| Semi Detached House | £379,726.00 | 96 Semi Detached Houses |
| Detached House | £552,279.00 | 41 Detached Houses |
| Terraced House | £317,636.00 | 33 Terraced Houses |
| Flat | £199,750.00 | 4 Flats |

