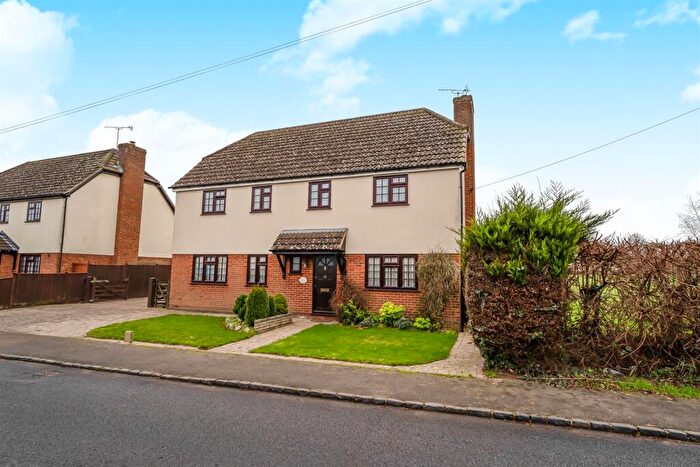
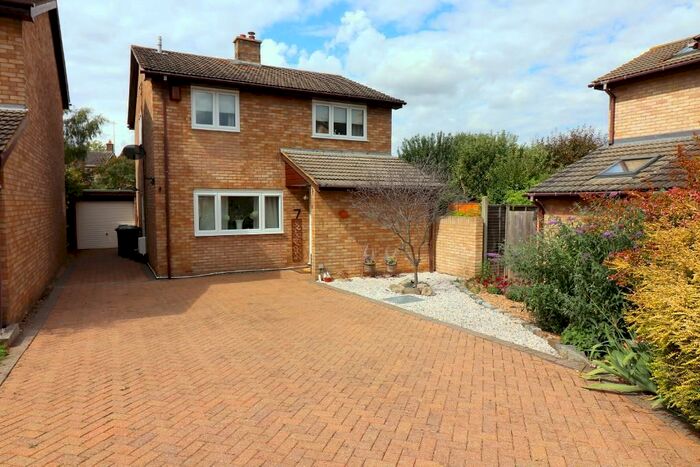
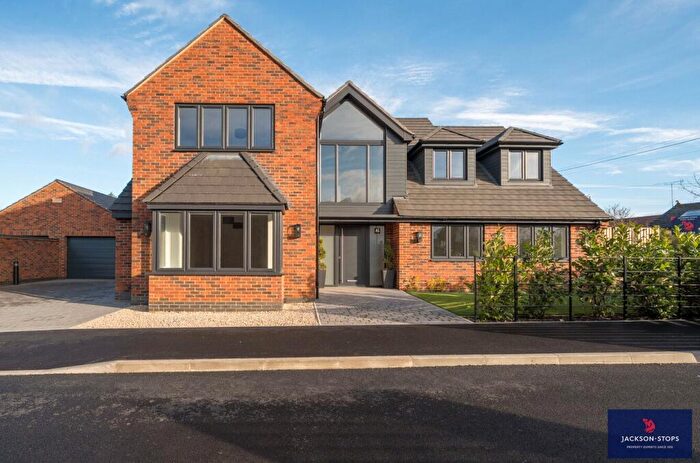
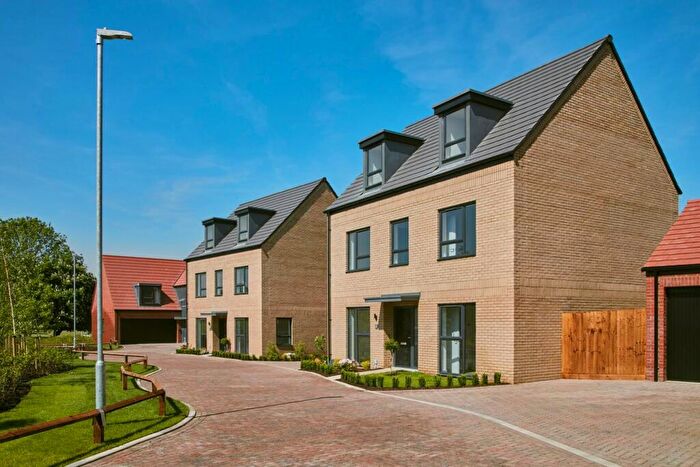
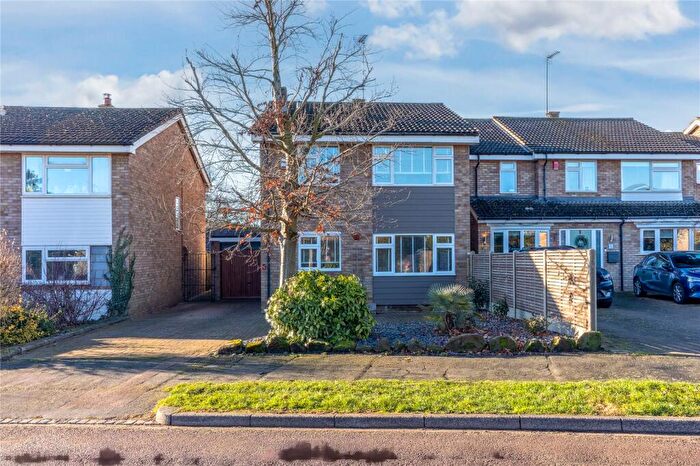
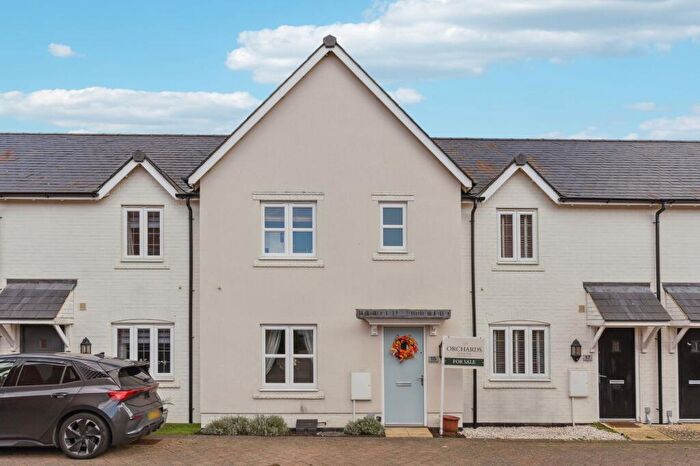
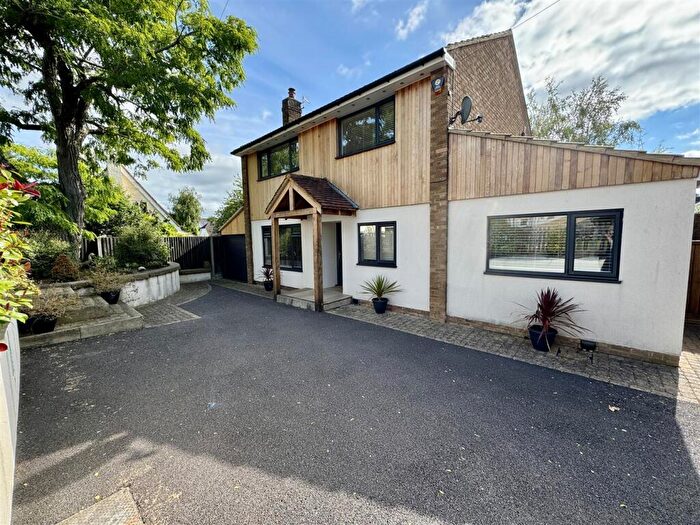
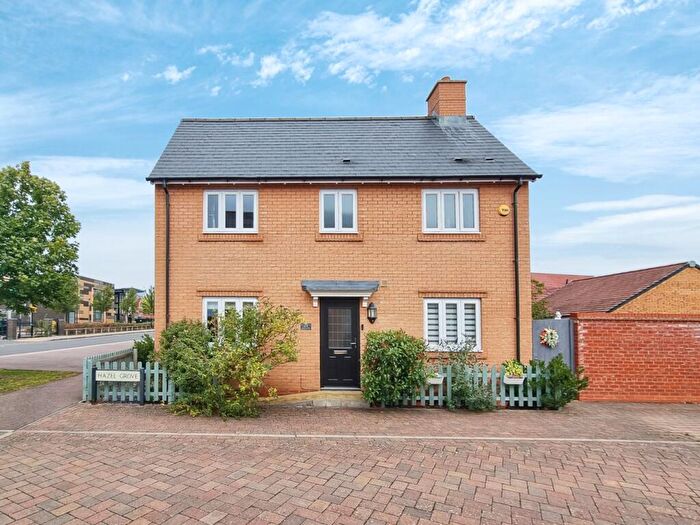
Houses for sale & to rent in Silsoe And Shillington, Bedford
House Prices in Silsoe And Shillington
Properties in Silsoe And Shillington have an average house price of £446,577.00 and had 173 Property Transactions within the last 3 years¹.
Silsoe And Shillington is an area in Bedford, Bedfordshire with 963 households², where the most expensive property was sold for £1,301,000.00.
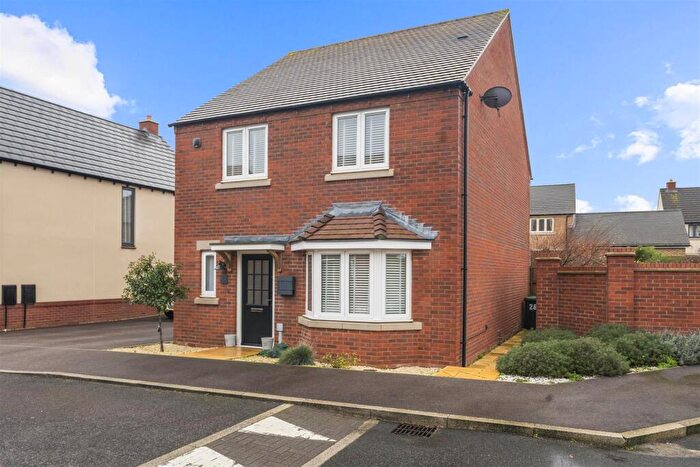
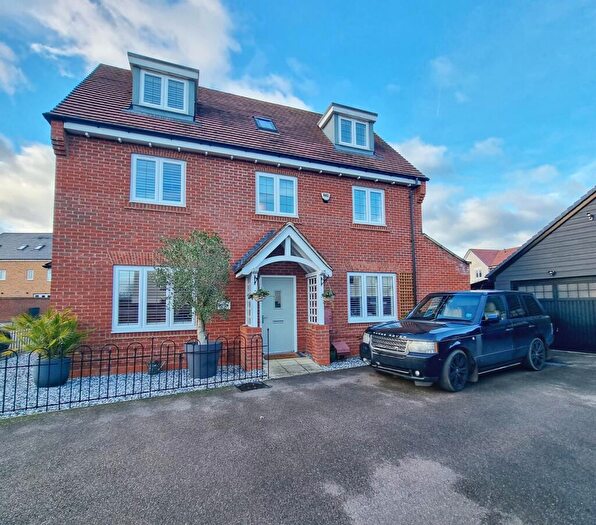
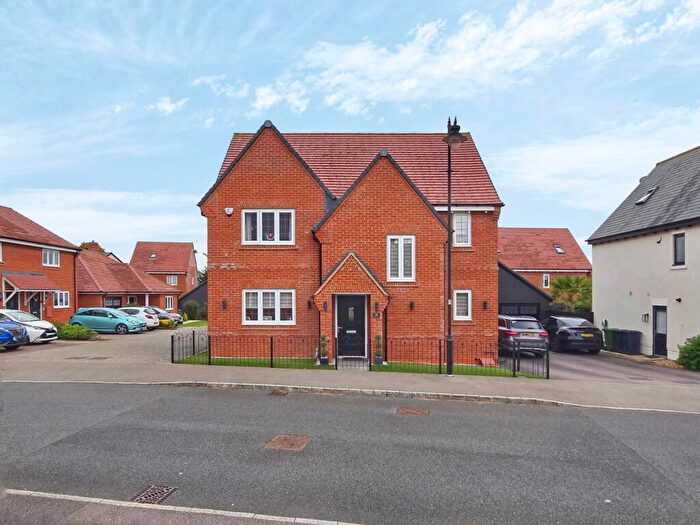
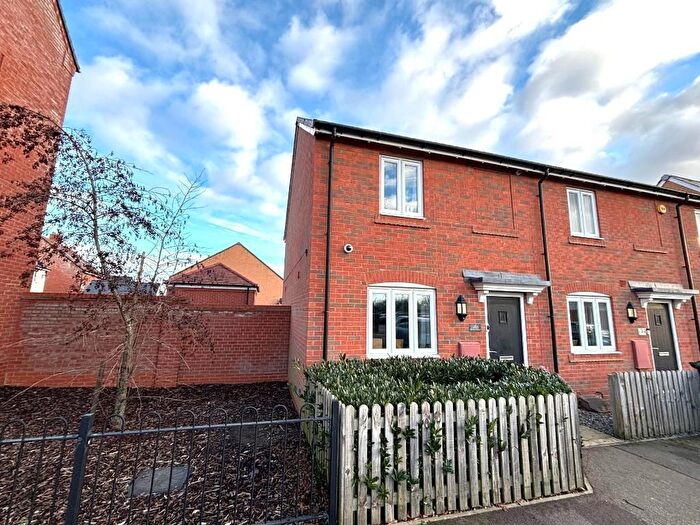
Properties for sale in Silsoe And Shillington
Roads and Postcodes in Silsoe And Shillington
Navigate through our locations to find the location of your next house in Silsoe And Shillington, Bedford for sale or to rent.
| Streets | Postcodes |
|---|---|
| Alder Wynd | MK45 4GQ |
| Ampthill Road | MK45 4DX MK45 4HB |
| Apple Tree Close | MK45 4SR |
| Ashtree Covert | MK45 4GN |
| Aspen Way | MK45 4GF |
| Barton Road | MK45 4DS MK45 4JL MK45 4JP MK45 4QP MK45 4QR |
| Bedford Avenue | MK45 4ER |
| Bedford Road | MK45 4AP |
| Birch Grove | MK45 4FQ |
| Blackthorn Place | MK45 4PZ |
| Cainhoe | MK45 4AU |
| Campton Road | MK45 4JB |
| Cherry Blossom Close | MK45 4FL |
| Chestnut Avenue | MK45 4GP |
| Church Road | MK45 4EH |
| Clophill Road | MK45 4HA MK45 4JH |
| College Chase | MK45 4GE |
| Elm Drive | MK45 4EU |
| Fielden Court | MK45 4NL |
| Firtree Road | MK45 4EA |
| Fishers Close | MK45 4LJ |
| Forest Path | MK45 4FY |
| Gravenhurst Road | MK45 4QS |
| Greensand Walk | MK45 4GY |
| Hawthorn Way | MK45 4DE MK45 4DF |
| Hazel Grove | MK45 4GJ |
| High Street | MK45 4DR MK45 4EP MK45 4ES MK45 4HY MK45 4HZ MK45 4EW |
| Higham Gobion Road | MK45 4RB |
| Holly Walk | MK45 4EB |
| Hornbeam Close | MK45 4GL |
| Juniper Close | MK45 4EG |
| Larch Rise | MK45 4FP |
| Leigh Woods Place | MK45 4QF |
| Lime Grove | MK45 4GB |
| Lower Gravenhurst | MK45 4HL MK45 4JR MK45 4HH MK45 4HJ |
| Mander Farm Road | MK45 4FJ MK45 4FW |
| Mulberry End | MK45 4FT |
| Newbury Close | MK45 4EZ |
| Newbury Lane | MK45 4ET MK45 4EX |
| Obelisk Way | MK45 4GH |
| Orchard Close | MK45 4JF |
| Osier Walk | MK45 4GR |
| Parkside | MK45 4JJ |
| Pine Walk | MK45 4FZ |
| Plantation View | MK45 4GG |
| Poplar Close | MK45 4EE |
| Recreation Rise | MK45 4JG |
| School House Mews | MK45 4DY |
| Shillington Road | MK45 4JE |
| Silbury Court | MK45 4RU |
| Spruce Edge | MK45 4GX |
| The Beeches | MK45 4FD |
| The Conifers | MK45 4FS |
| The Coppice | MK45 4GU |
| The Glebe | MK45 4JA |
| The Grove | MK45 4EY |
| The Laurels | MK45 4PQ |
| The Maples | MK45 4DL |
| The Oaks | MK45 4EL |
| The Orchards | MK45 4EJ |
| The Pyghtle | MK45 4JD |
| The Rowans | MK45 4DG |
| The Spinney | MK45 4GS |
| The Sycamores | MK45 4HE |
| The Vineyards | MK45 4FX |
| Vicarage Road | MK45 4ED MK45 4EF |
| Walnut Walk | MK45 4GT |
| West End Lane | MK45 4GA |
| West End Road | MK45 4DU |
| Whitebeam Close | MK45 4PW |
| Willow Close | MK45 4EN |
| Wrest Park | MK45 4HT MK45 4DP MK45 4HP MK45 4HR MK45 4HS |
| Yew Tree Close | MK45 4EQ |
Transport near Silsoe And Shillington
-
Flitwick Station
-
Harlington Station
-
Millbrook (Bedfordshire) Station
-
Stewartby Station
-
Lidlington Station
-
Arlesey Station
-
Kempston Hardwick Station
-
Leagrave Station
-
Ridgmont Station
-
Hitchin Station
- FAQ
- Price Paid By Year
- Property Type Price
Frequently asked questions about Silsoe And Shillington
What is the average price for a property for sale in Silsoe And Shillington?
The average price for a property for sale in Silsoe And Shillington is £446,577. This amount is 20% higher than the average price in Bedford. There are 1,111 property listings for sale in Silsoe And Shillington.
What streets have the most expensive properties for sale in Silsoe And Shillington?
The streets with the most expensive properties for sale in Silsoe And Shillington are The Rowans at an average of £776,666, Silbury Court at an average of £630,000 and Lower Gravenhurst at an average of £625,000.
What streets have the most affordable properties for sale in Silsoe And Shillington?
The streets with the most affordable properties for sale in Silsoe And Shillington are Cherry Blossom Close at an average of £82,500, Fishers Close at an average of £156,600 and Ashtree Covert at an average of £239,500.
Which train stations are available in or near Silsoe And Shillington?
Some of the train stations available in or near Silsoe And Shillington are Flitwick, Harlington and Millbrook (Bedfordshire).
Property Price Paid in Silsoe And Shillington by Year
The average sold property price by year was:
| Year | Average Sold Price | Price Change |
Sold Properties
|
|---|---|---|---|
| 2025 | £440,870 | 3% |
34 Properties |
| 2024 | £426,785 | 13% |
53 Properties |
| 2023 | £369,382 | -37% |
29 Properties |
| 2022 | £507,657 | 10% |
57 Properties |
| 2021 | £456,544 | 16% |
100 Properties |
| 2020 | £384,123 | 0,3% |
108 Properties |
| 2019 | £382,959 | 0,3% |
61 Properties |
| 2018 | £381,701 | -5% |
52 Properties |
| 2017 | £402,610 | -4% |
62 Properties |
| 2016 | £419,758 | 1% |
104 Properties |
| 2015 | £415,545 | 17% |
88 Properties |
| 2014 | £343,455 | 20% |
156 Properties |
| 2013 | £275,776 | - |
133 Properties |
| 2012 | £275,782 | -1% |
61 Properties |
| 2011 | £279,758 | -8% |
51 Properties |
| 2010 | £302,845 | -10% |
32 Properties |
| 2009 | £333,893 | 14% |
38 Properties |
| 2008 | £287,676 | -11% |
13 Properties |
| 2007 | £319,556 | -1% |
40 Properties |
| 2006 | £322,683 | 11% |
60 Properties |
| 2005 | £287,068 | -1% |
34 Properties |
| 2004 | £290,694 | 18% |
50 Properties |
| 2003 | £237,116 | 7% |
53 Properties |
| 2002 | £219,337 | 3% |
50 Properties |
| 2001 | £212,322 | 16% |
42 Properties |
| 2000 | £178,532 | 11% |
50 Properties |
| 1999 | £158,393 | 8% |
85 Properties |
| 1998 | £146,423 | 7% |
40 Properties |
| 1997 | £136,022 | 29% |
35 Properties |
| 1996 | £96,427 | -13% |
44 Properties |
| 1995 | £109,137 | - |
40 Properties |
Property Price per Property Type in Silsoe And Shillington
Here you can find historic sold price data in order to help with your property search.
The average Property Paid Price for specific property types in the last three years are:
| Property Type | Average Sold Price | Sold Properties |
|---|---|---|
| Semi Detached House | £402,858.00 | 43 Semi Detached Houses |
| Detached House | £636,761.00 | 65 Detached Houses |
| Terraced House | £301,385.00 | 45 Terraced Houses |
| Flat | £249,154.00 | 20 Flats |

