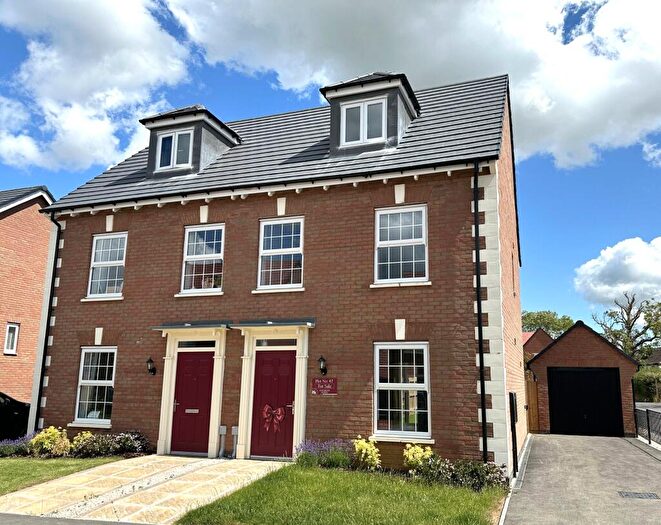
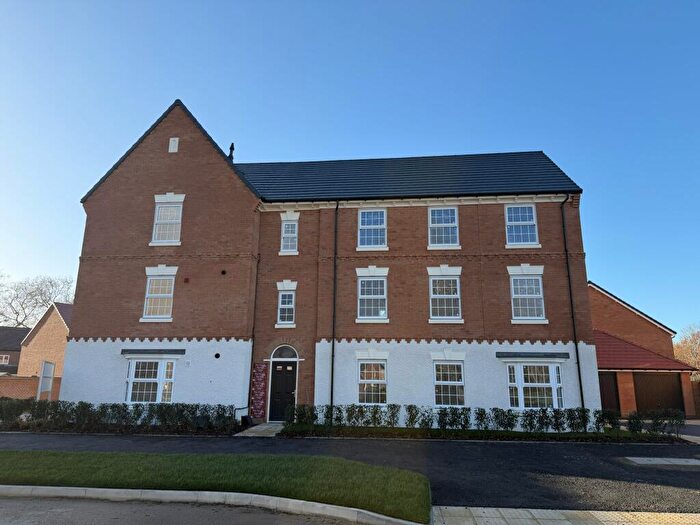
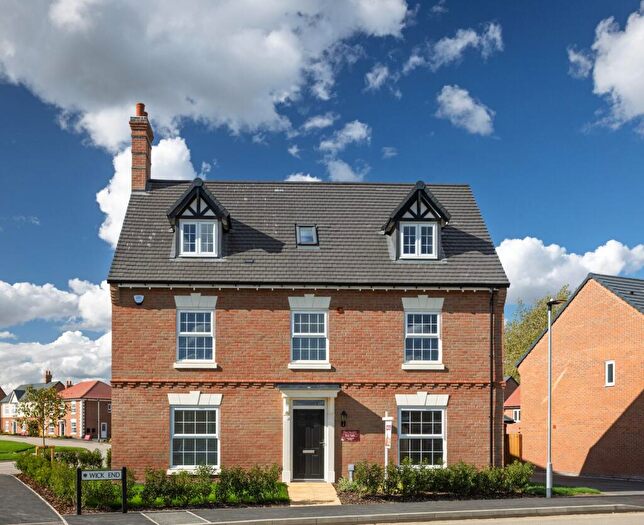
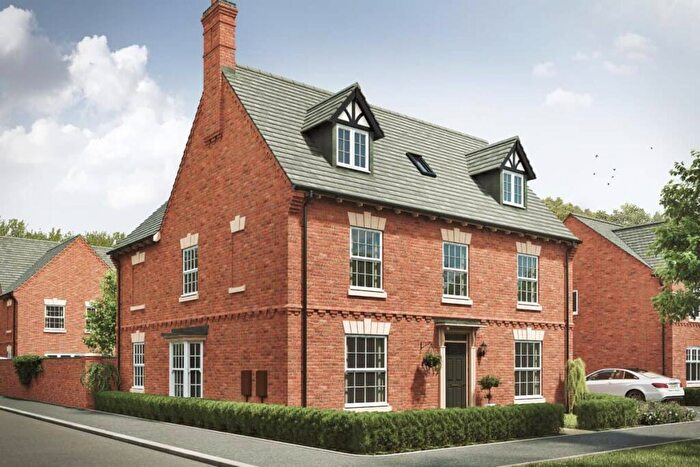
Houses for sale & to rent in Clapham, Bedford
House Prices in Clapham
Properties in Clapham have an average house price of £335,993.00 and had 184 Property Transactions within the last 3 years¹.
Clapham is an area in Bedford, Bedfordshire with 1,862 households², where the most expensive property was sold for £1,040,000.00.
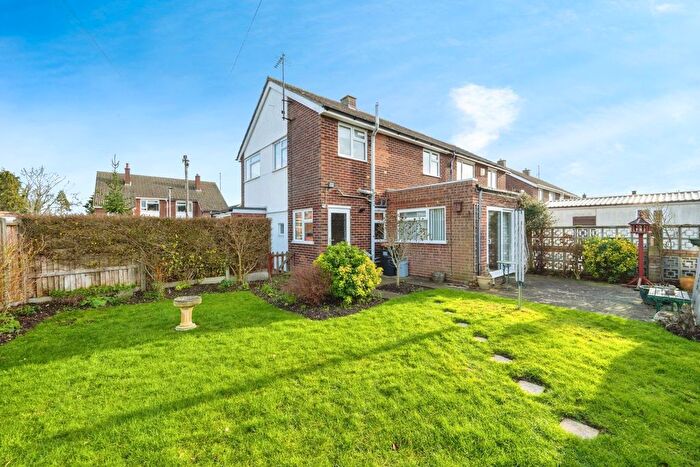
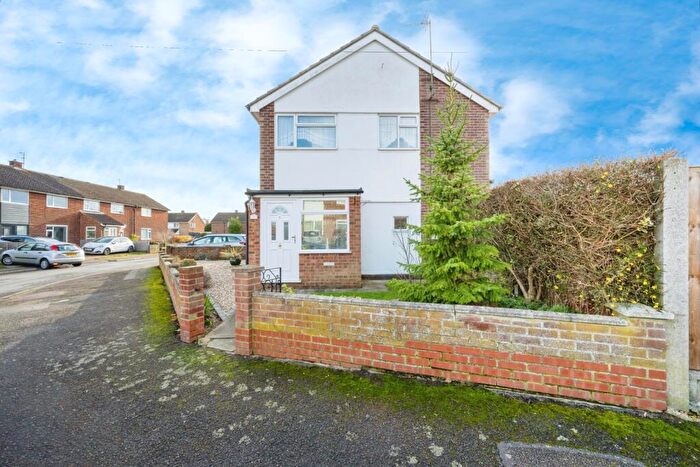
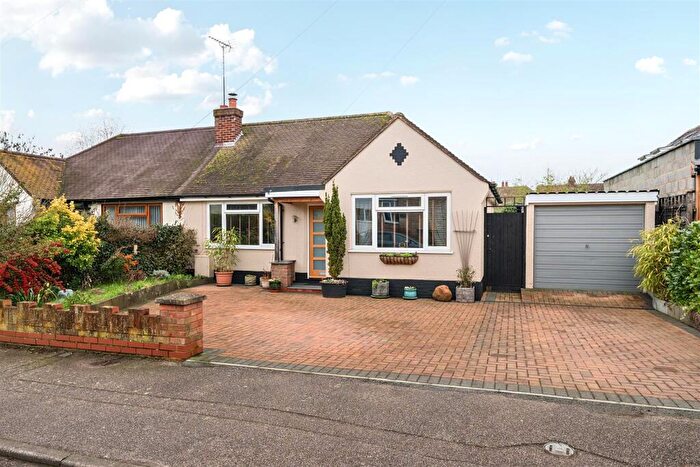
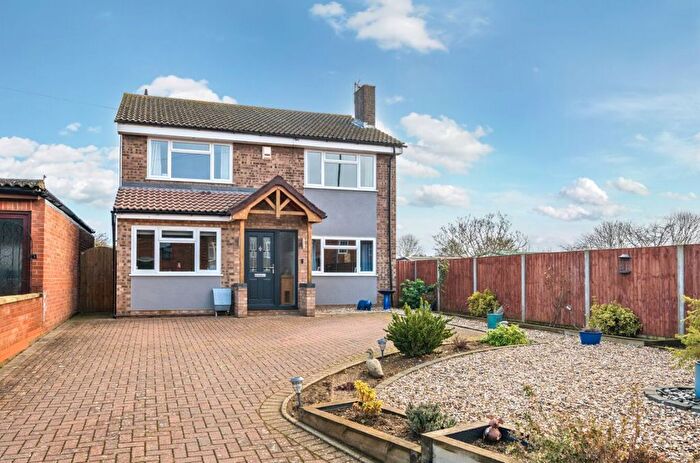
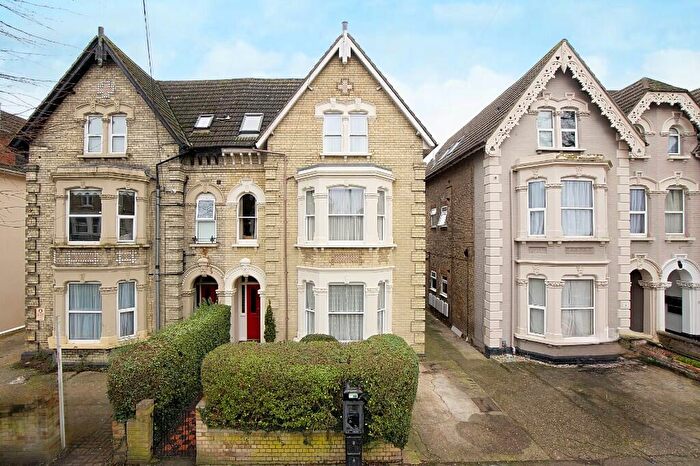
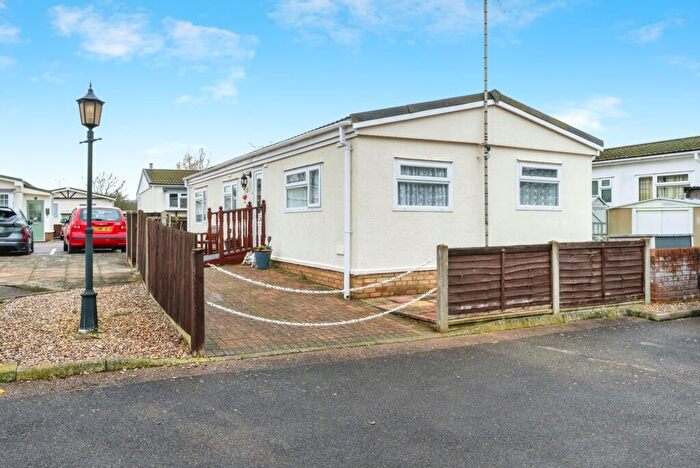
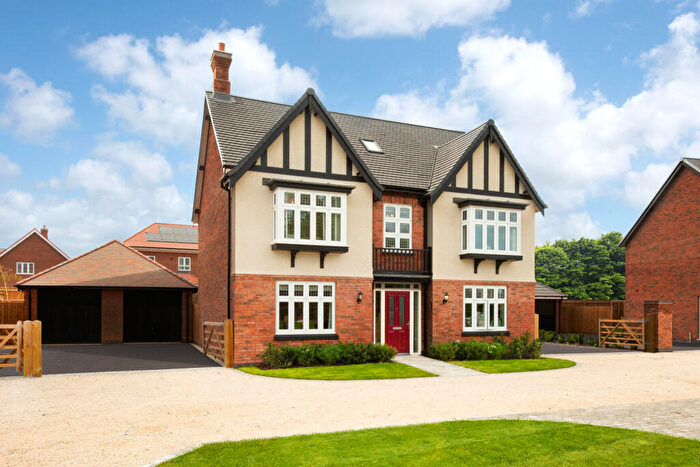
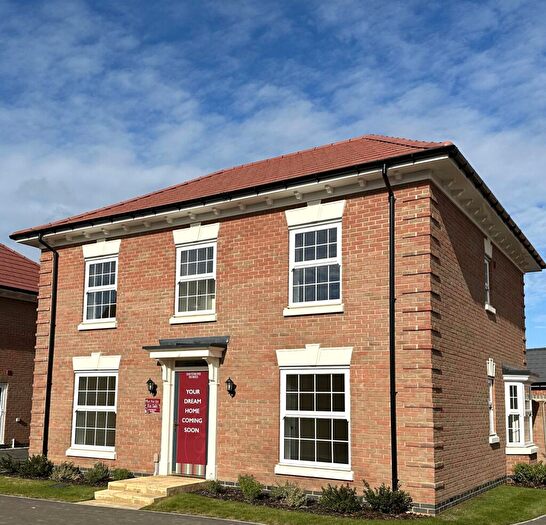
Properties for sale in Clapham
Roads and Postcodes in Clapham
Navigate through our locations to find the location of your next house in Clapham, Bedford for sale or to rent.
| Streets | Postcodes |
|---|---|
| Bedford Road | MK41 6EJ |
| Bents Close | MK41 6DY MK41 6DZ |
| Birbeck Close | MK41 6GJ |
| Bridle Drive | MK41 6BB MK41 6BE |
| Carriage Drive | MK41 6EX |
| Church View | MK41 6ES |
| Clapham Chase | MK41 6FA |
| Clapham Park | MK41 6EY |
| Clapham Road | MK41 6EL MK41 6EN |
| Cody Road | MK41 6EA MK41 6ED |
| Dennis Close | MK41 6GG |
| Duke Drive | MK41 6DE MK41 6DD MK41 6FE |
| Fetlock Close | MK41 6BG |
| Folly Park | MK41 6AF MK41 6AL |
| Fox Close | MK41 6GF |
| George Street | MK41 6AZ MK41 6BA MK41 6BX |
| Graze Hill Lane | MK44 2SA |
| Green Lane | MK41 6EP MK41 6ER MK41 6ET MK41 6EU |
| High Street | MK41 6AG MK41 6AH MK41 6AJ MK41 6AQ MK41 6AY MK41 6BP MK41 6BS MK41 6BW MK41 6DN MK41 6EG MK41 6EQ |
| Highbury Grove | MK41 6DS MK41 6DT MK41 6DU MK41 6DX |
| Hulme Close | MK41 6GH |
| Hunters Close | MK41 6FG |
| King Street | MK41 6BY |
| Knights Avenue | MK41 6DF MK41 6DG |
| Lanchester Close | MK41 6EB |
| Loak Close | MK41 6GQ |
| Mckennan Close | MK41 6GR |
| Miller Close | MK41 6GN |
| Milton Road | MK41 6AP MK41 6AR MK41 6AS MK41 6AU MK41 6AX MK41 6AT |
| Mount Pleasant Road | MK41 6BT MK41 6BU |
| Oakley Road | MK41 6AN MK41 6AW |
| Paddock Close | MK41 6BD |
| Park Farm Court | MK41 6EF |
| Peppercorn Park | MK41 6HB MK41 6HD |
| Preservine Walk | MK41 6BN |
| Princess Street | MK41 6BZ |
| Prior Close | MK41 6GP |
| Queens Crescent | MK41 6DA MK41 6DB |
| Saddle Close | MK41 6BQ |
| Shire Road | MK41 6HH |
| Spriggs Close | MK41 6GD |
| Summers Close | MK41 6GE |
| The Baulk | MK41 6AA MK41 6HA MK41 6HE |
| The Close | MK41 6DP |
| The Ford | MK41 6EH |
| The Glebe | MK41 6GA MK41 6GB MK41 6GL |
| The Slade | MK41 6DR |
| The Warren | MK41 6DW |
| Tinsley Close | MK41 6HJ |
| Tranquada Close | MK41 6DL |
| Twinwood | MK41 6AD |
| Twinwood Road | MK41 6HG MK41 6HL MK41 6HP |
| Ursula Taylor Walk | MK41 6EE |
| Woodlands | MK41 6FS |
| MK41 6BL |
Transport near Clapham
-
Bedford Midland Station
-
Bedford St.Johns Station
-
Kempston Hardwick Station
-
Stewartby Station
-
Millbrook (Bedfordshire) Station
-
Lidlington Station
-
Sandy Station
- FAQ
- Price Paid By Year
- Property Type Price
Frequently asked questions about Clapham
What is the average price for a property for sale in Clapham?
The average price for a property for sale in Clapham is £335,993. This amount is 10% lower than the average price in Bedford. There are 1,304 property listings for sale in Clapham.
What streets have the most expensive properties for sale in Clapham?
The streets with the most expensive properties for sale in Clapham are Oakley Road at an average of £671,500, Hunters Close at an average of £599,000 and The Baulk at an average of £563,000.
What streets have the most affordable properties for sale in Clapham?
The streets with the most affordable properties for sale in Clapham are Tinsley Close at an average of £202,500, Twinwood Road at an average of £217,000 and Preservine Walk at an average of £239,750.
Which train stations are available in or near Clapham?
Some of the train stations available in or near Clapham are Bedford Midland, Bedford St.Johns and Kempston Hardwick.
Property Price Paid in Clapham by Year
The average sold property price by year was:
| Year | Average Sold Price | Price Change |
Sold Properties
|
|---|---|---|---|
| 2025 | £307,818 | -12% |
66 Properties |
| 2024 | £343,724 | -5% |
66 Properties |
| 2023 | £361,942 | 4% |
52 Properties |
| 2022 | £349,001 | 20% |
57 Properties |
| 2021 | £279,519 | -7% |
95 Properties |
| 2020 | £298,306 | 5% |
53 Properties |
| 2019 | £283,792 | 7% |
77 Properties |
| 2018 | £263,254 | 0,3% |
66 Properties |
| 2017 | £262,417 | 14% |
70 Properties |
| 2016 | £226,377 | -3% |
70 Properties |
| 2015 | £233,011 | 11% |
80 Properties |
| 2014 | £208,308 | 9% |
71 Properties |
| 2013 | £189,161 | -6% |
97 Properties |
| 2012 | £200,367 | 3% |
71 Properties |
| 2011 | £194,232 | -3% |
56 Properties |
| 2010 | £200,858 | 1% |
44 Properties |
| 2009 | £198,076 | 13% |
62 Properties |
| 2008 | £171,645 | -12% |
43 Properties |
| 2007 | £192,944 | 3% |
101 Properties |
| 2006 | £186,882 | 1% |
147 Properties |
| 2005 | £185,088 | -3% |
139 Properties |
| 2004 | £189,904 | 8% |
130 Properties |
| 2003 | £175,366 | 15% |
137 Properties |
| 2002 | £149,604 | 31% |
152 Properties |
| 2001 | £102,777 | 12% |
92 Properties |
| 2000 | £89,934 | 16% |
74 Properties |
| 1999 | £75,927 | -25% |
75 Properties |
| 1998 | £94,545 | 13% |
96 Properties |
| 1997 | £82,160 | 34% |
111 Properties |
| 1996 | £54,282 | 8% |
71 Properties |
| 1995 | £50,005 | - |
56 Properties |
Property Price per Property Type in Clapham
Here you can find historic sold price data in order to help with your property search.
The average Property Paid Price for specific property types in the last three years are:
| Property Type | Average Sold Price | Sold Properties |
|---|---|---|
| Semi Detached House | £297,939.00 | 85 Semi Detached Houses |
| Detached House | £529,219.00 | 41 Detached Houses |
| Terraced House | £271,897.00 | 49 Terraced Houses |
| Flat | £164,111.00 | 9 Flats |

