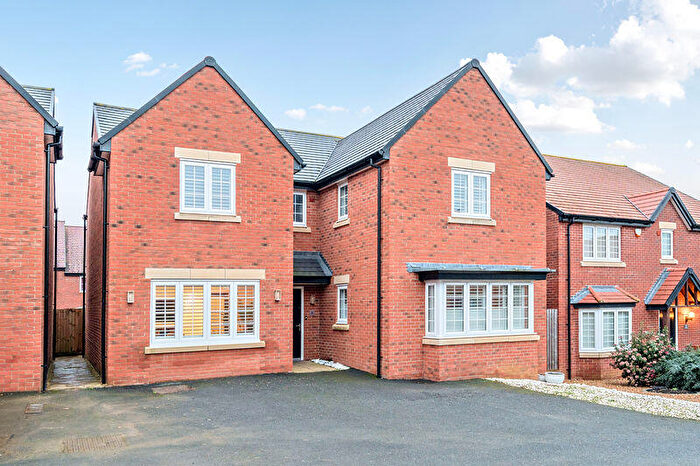
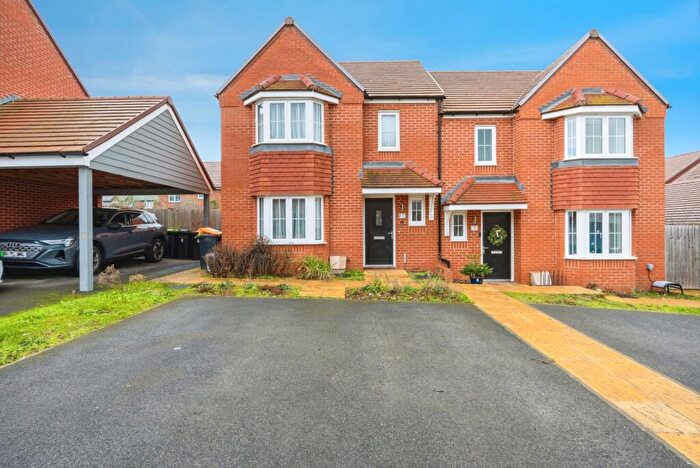
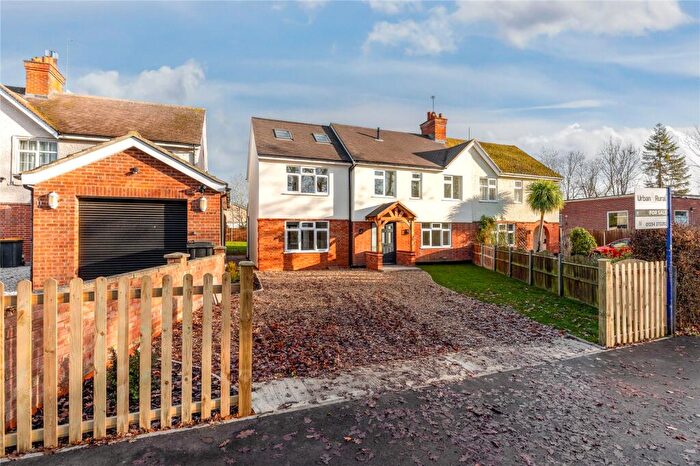
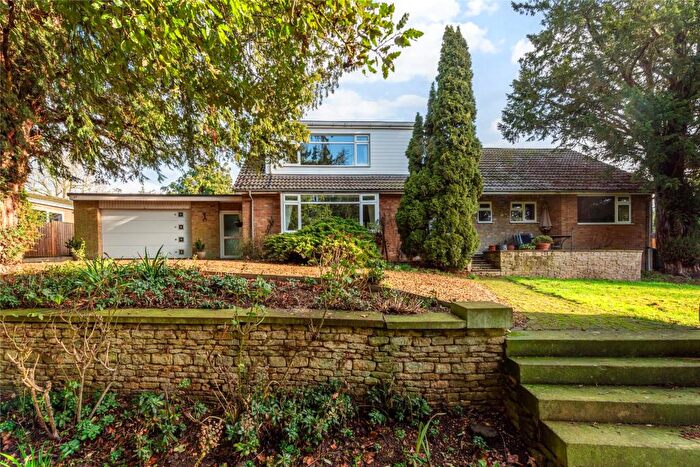
Houses for sale & to rent in Oakley, Bedford
House Prices in Oakley
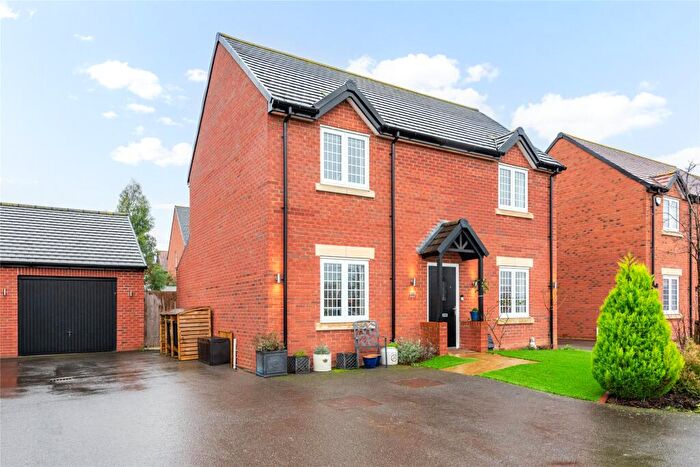
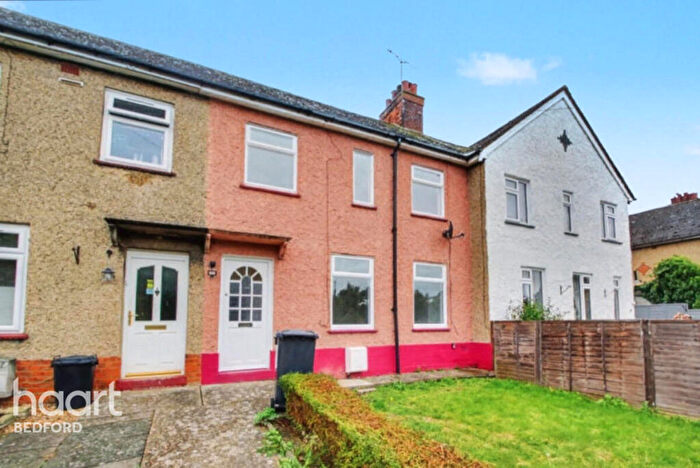
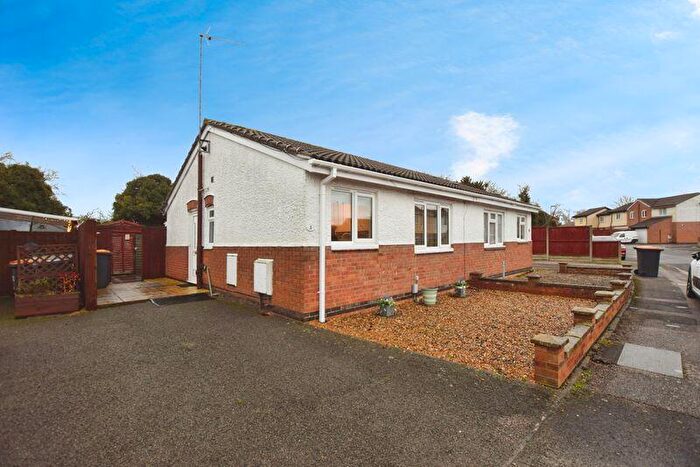
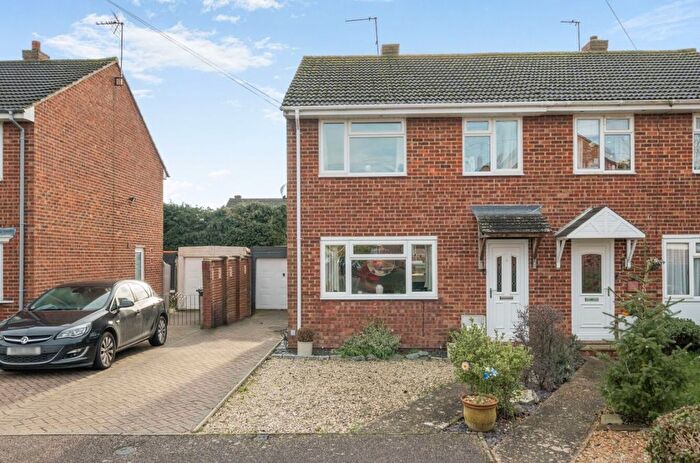
Properties in Oakley have an average house price of £473,143.00 and had 101 Property Transactions within the last 3 years¹.
Oakley is an area in Bedford, Bedfordshire with 1,529 households², where the most expensive property was sold for £1,250,000.00.
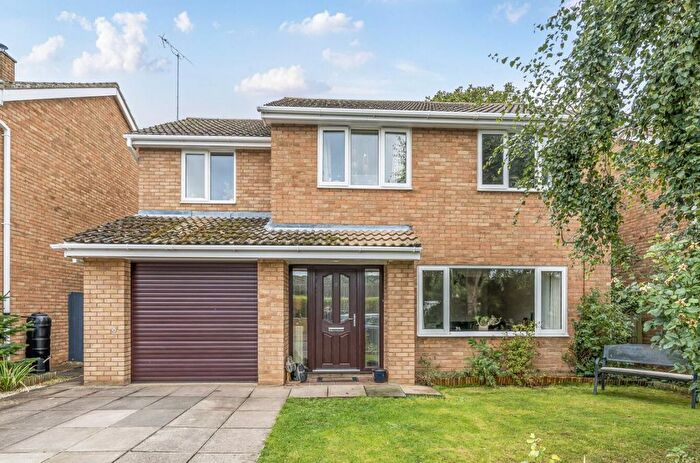
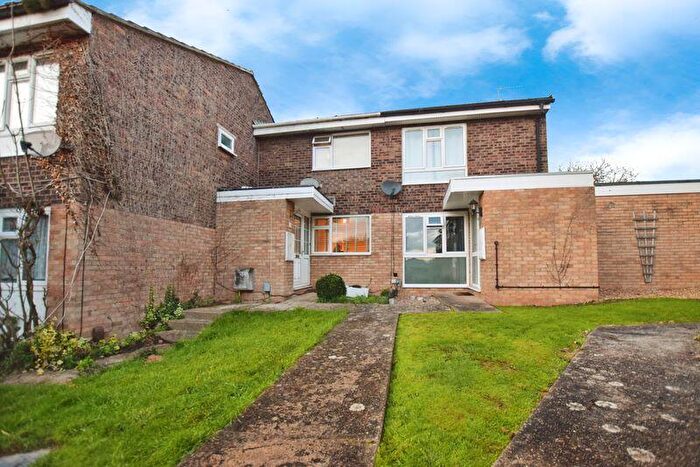
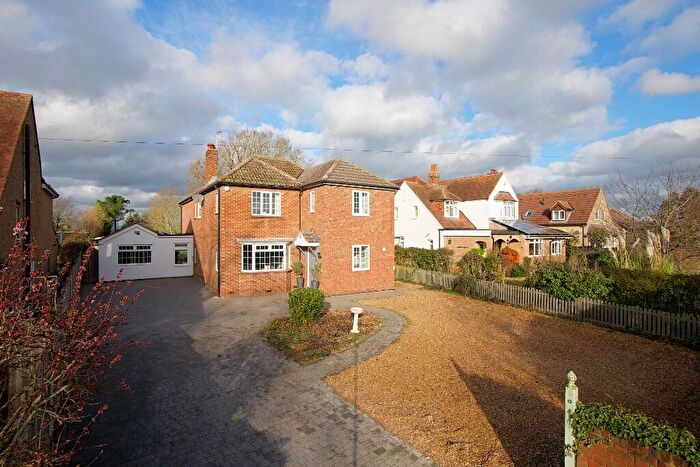
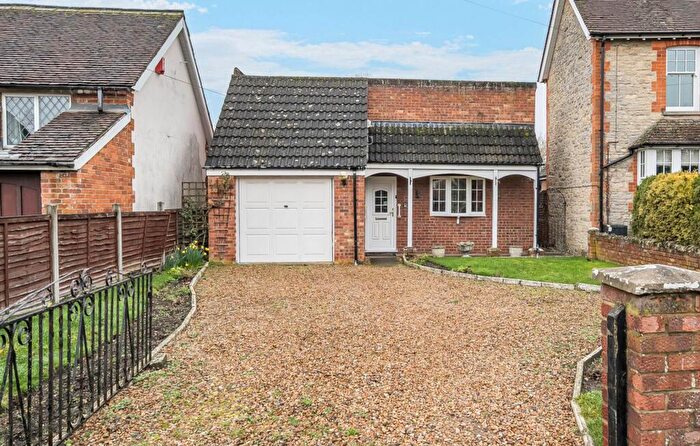
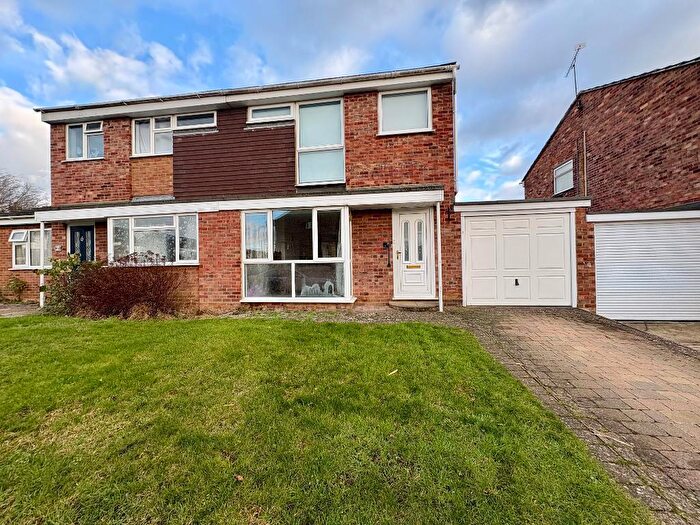
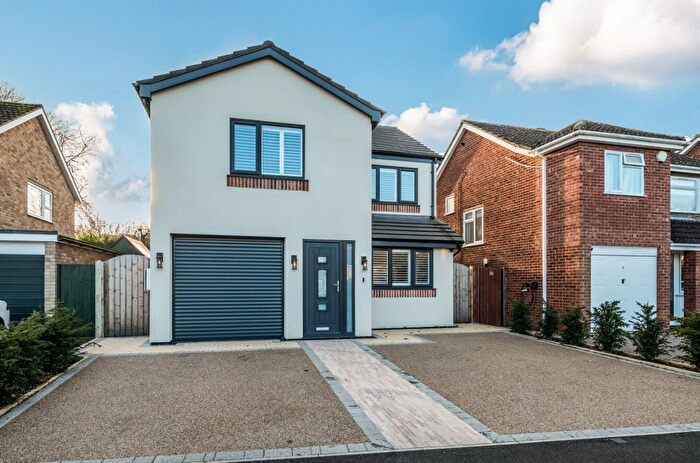
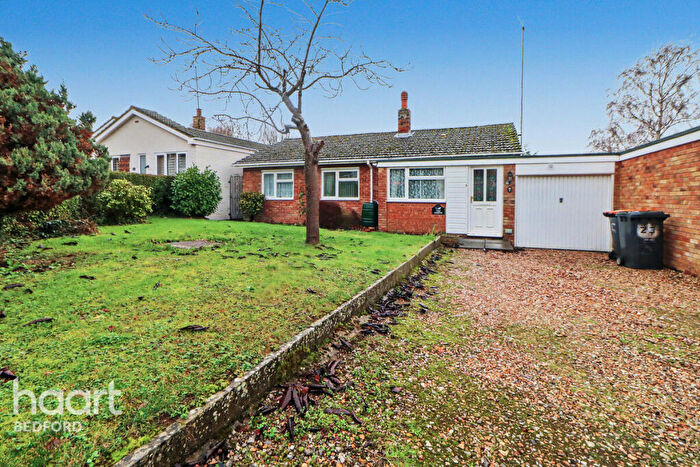
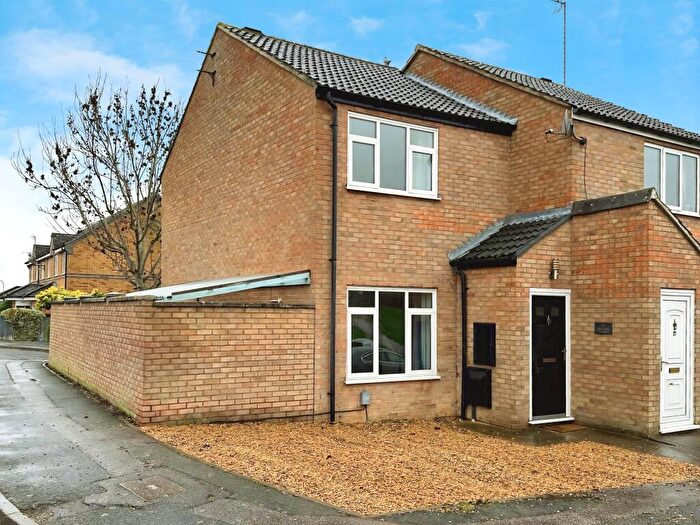
Properties for sale in Oakley
Roads and Postcodes in Oakley
Navigate through our locations to find the location of your next house in Oakley, Bedford for sale or to rent.
| Streets | Postcodes |
|---|---|
| Bedford Road | MK43 7PH MK43 7PS MK43 7JN |
| Bevery Close | MK43 7SH |
| Brockwell | MK43 7TD |
| Brookfields | MK43 7QA |
| Burleigh Place | MK43 7SG |
| Burridges Close | MK43 7QE |
| Chapel Pound | MK43 7RQ |
| Church Lane | MK43 7PT MK43 7RJ MK43 7RP MK43 7RU MK43 7PU |
| Church Road | MK43 7QB |
| Close Road | MK43 7PP |
| Copthorne Close | MK43 7SQ |
| Court Lane | MK43 7QS MK43 7QT |
| Derwent Cottages | MK43 7NT |
| Dewlands | MK43 7RL MK43 7RN MK43 7RW |
| East End | MK43 7PR |
| Farley Way | MK43 7QL |
| Farrows Close | MK43 7TF |
| Farsands | MK43 7SJ |
| Flax Close | MK43 7PW |
| Foxbrook | MK43 7QY |
| Grange Close | MK43 7TE |
| Grenidge Way | MK43 7SE MK43 7SF |
| High Street | MK43 7NJ MK43 7NP MK43 7NU MK43 7NX MK43 7PD MK43 7PE MK43 7RG MK43 7RH MK43 7PF |
| Highfield Road | MK43 7TA |
| Hunts Path | MK43 7SR |
| Lincroft | MK43 7SP MK43 7SS |
| Long Row | MK43 7NR |
| Lovell Homes | MK43 7RY |
| Lovell Road | MK43 7RX MK43 7RZ |
| Midway Park | MK43 7PJ |
| Mill Lane | MK43 7NL |
| Monks Row | MK43 7NS |
| Orchard Close | MK43 7AN |
| Park Road | MK43 7QD MK43 7QG MK43 7QF |
| Parrott Close | MK43 7AQ |
| Parsonage Close | MK43 7TG |
| Pavenham Road | MK43 7SY MK43 7QX |
| Plaiters Close | MK43 7NW |
| Queens Close | MK43 7TB |
| Railway Cottages | MK43 7RF |
| Reynes Drive | MK43 7SA MK43 7SB MK43 7SD MK43 7SL MK43 7SN |
| River Row | MK43 7NN |
| Riverview Park | MK43 7PN |
| Rose Crescent Park | MK43 7PL |
| Ruffs Furze | MK43 7RR MK43 7RS MK43 7RT |
| Silver Street | MK43 7QN MK43 7QP MK43 7QW |
| Station Road | MK43 7RB MK43 7RE |
| Tandys Close | MK43 7PZ |
| The Bakery | MK43 7QH |
| The Bury | MK43 7PX MK43 7PY |
| The Drive | MK43 7ST |
| The Furlong | MK43 7RD |
| The Green | MK43 7PQ |
| The Spinney | MK43 7TH |
| Town Farm Court | MK43 7SW |
| Twinwood | MK41 6AB |
| Walnut Close | MK43 7NZ |
| Weavers Lane | MK43 7NH |
| West End | MK43 7QU |
| Westfield Road | MK43 7SU MK43 7SX |
| Willow Vale Cottages | MK43 7SZ |
| Windmill Lane | MK43 7QZ |
| MK43 7QR |
Transport near Oakley
-
Bedford Midland Station
-
Bedford St.Johns Station
-
Kempston Hardwick Station
-
Stewartby Station
-
Millbrook (Bedfordshire) Station
-
Lidlington Station
- FAQ
- Price Paid By Year
- Property Type Price
Frequently asked questions about Oakley
What is the average price for a property for sale in Oakley?
The average price for a property for sale in Oakley is £473,143. This amount is 27% higher than the average price in Bedford. There are 1,127 property listings for sale in Oakley.
What streets have the most expensive properties for sale in Oakley?
The streets with the most expensive properties for sale in Oakley are Westfield Road at an average of £1,080,000, The Drive at an average of £975,000 and Parsonage Close at an average of £900,000.
What streets have the most affordable properties for sale in Oakley?
The streets with the most affordable properties for sale in Oakley are Foxbrook at an average of £200,000, The Furlong at an average of £256,875 and Church Road at an average of £265,000.
Which train stations are available in or near Oakley?
Some of the train stations available in or near Oakley are Bedford Midland, Bedford St.Johns and Kempston Hardwick.
Property Price Paid in Oakley by Year
The average sold property price by year was:
| Year | Average Sold Price | Price Change |
Sold Properties
|
|---|---|---|---|
| 2025 | £462,485 | -5% |
35 Properties |
| 2024 | £484,840 | 4% |
44 Properties |
| 2023 | £466,704 | -4% |
22 Properties |
| 2022 | £485,440 | 2% |
58 Properties |
| 2021 | £475,668 | 21% |
66 Properties |
| 2020 | £374,840 | -6% |
50 Properties |
| 2019 | £399,069 | 9% |
51 Properties |
| 2018 | £361,501 | -17% |
50 Properties |
| 2017 | £421,223 | 21% |
60 Properties |
| 2016 | £331,631 | -3% |
56 Properties |
| 2015 | £342,530 | 1% |
50 Properties |
| 2014 | £340,431 | 8% |
47 Properties |
| 2013 | £312,108 | 12% |
56 Properties |
| 2012 | £273,151 | -5% |
43 Properties |
| 2011 | £288,114 | -1% |
48 Properties |
| 2010 | £291,671 | 3% |
52 Properties |
| 2009 | £282,604 | -13% |
50 Properties |
| 2008 | £320,085 | 23% |
38 Properties |
| 2007 | £247,787 | -2% |
84 Properties |
| 2006 | £253,015 | 5% |
83 Properties |
| 2005 | £240,055 | 15% |
50 Properties |
| 2004 | £204,685 | -9% |
70 Properties |
| 2003 | £222,754 | 22% |
46 Properties |
| 2002 | £174,024 | 19% |
65 Properties |
| 2001 | £140,694 | -1% |
74 Properties |
| 2000 | £142,550 | -2% |
61 Properties |
| 1999 | £145,147 | 32% |
51 Properties |
| 1998 | £98,597 | 4% |
78 Properties |
| 1997 | £95,016 | 9% |
72 Properties |
| 1996 | £86,135 | 3% |
79 Properties |
| 1995 | £83,499 | - |
72 Properties |
Property Price per Property Type in Oakley
Here you can find historic sold price data in order to help with your property search.
The average Property Paid Price for specific property types in the last three years are:
| Property Type | Average Sold Price | Sold Properties |
|---|---|---|
| Semi Detached House | £349,597.00 | 36 Semi Detached Houses |
| Detached House | £659,551.00 | 39 Detached Houses |
| Terraced House | £383,021.00 | 23 Terraced Houses |
| Flat | £223,333.00 | 3 Flats |

