Houses for sale & to rent in Riseley, Bedford
House Prices in Riseley
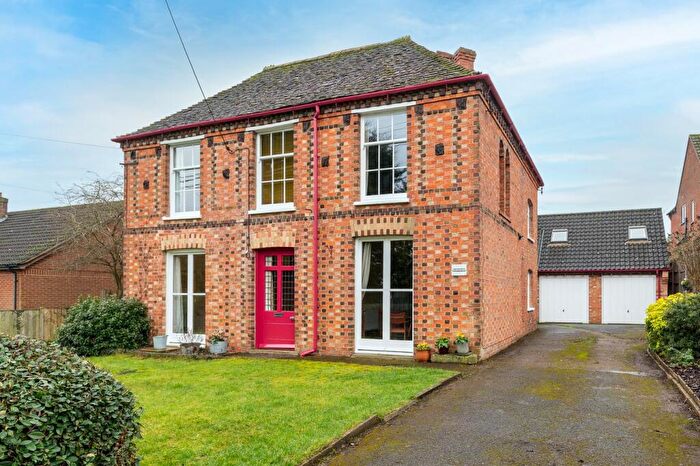
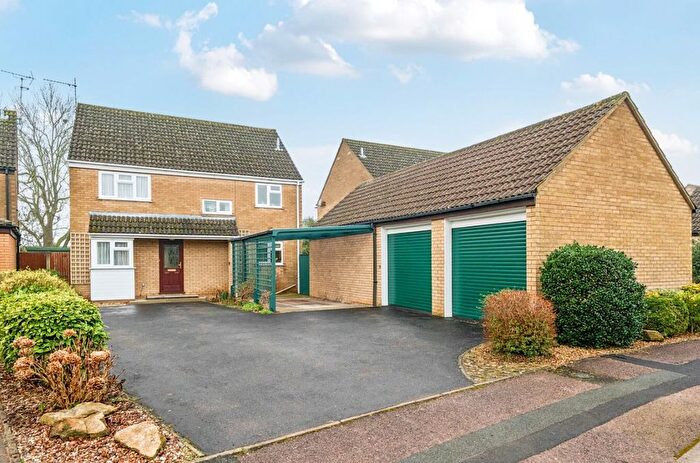
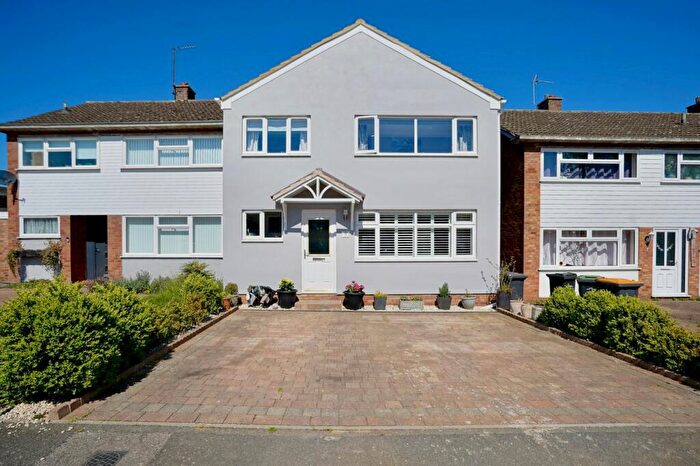
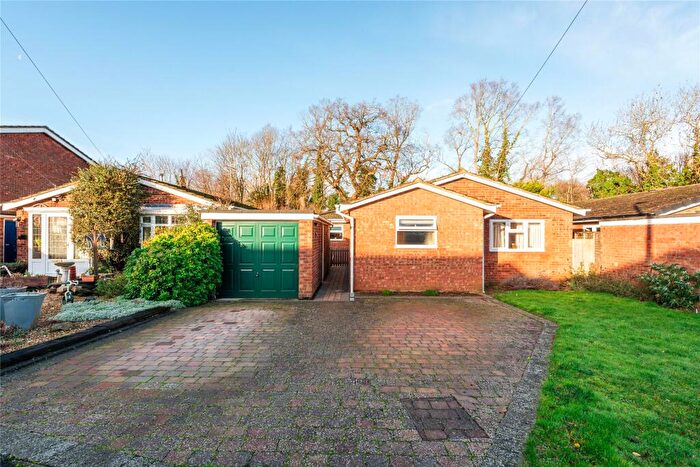
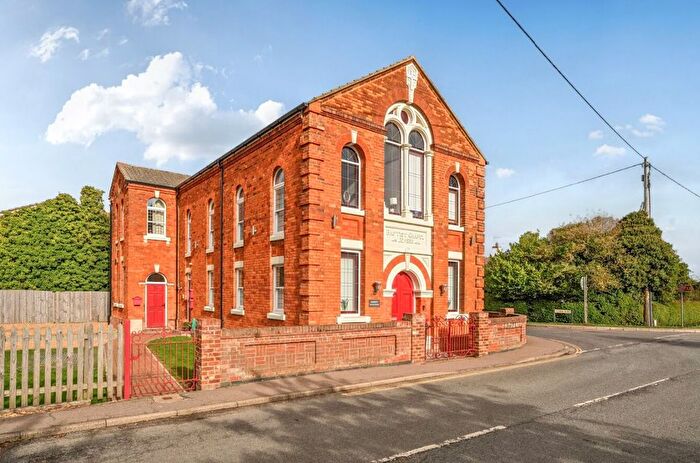
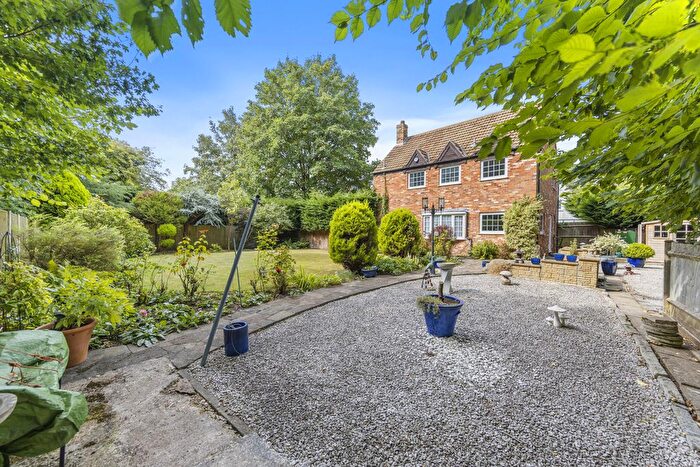
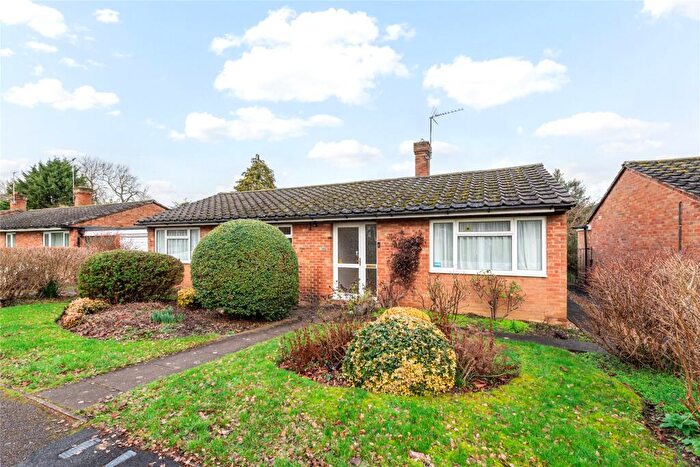
Properties in Riseley have an average house price of £461,657.00 and had 116 Property Transactions within the last 3 years¹.
Riseley is an area in Bedford, Bedfordshire with 1,211 households², where the most expensive property was sold for £1,000,000.00.
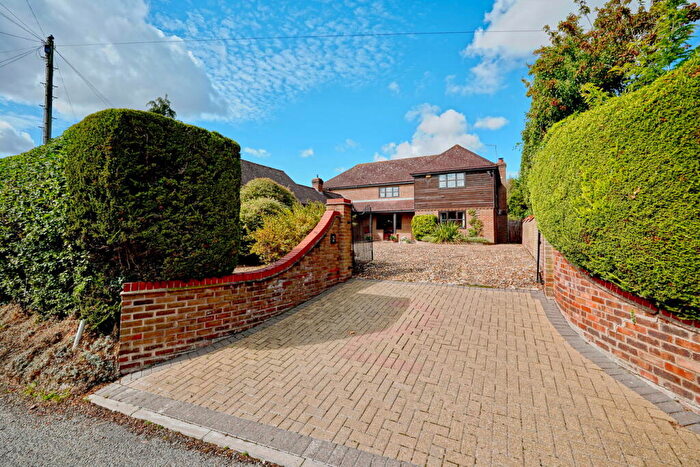
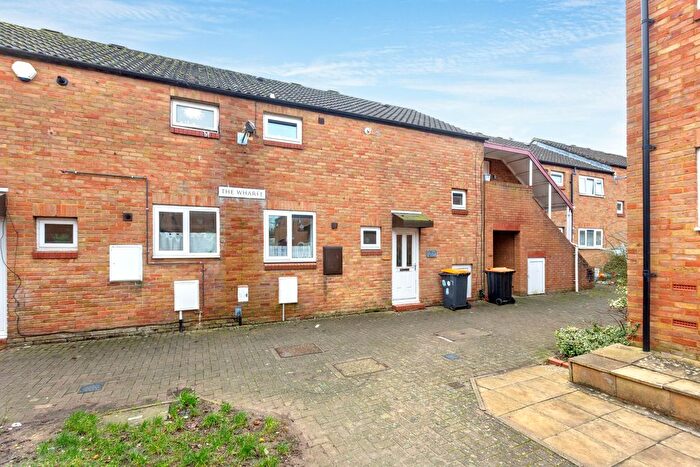
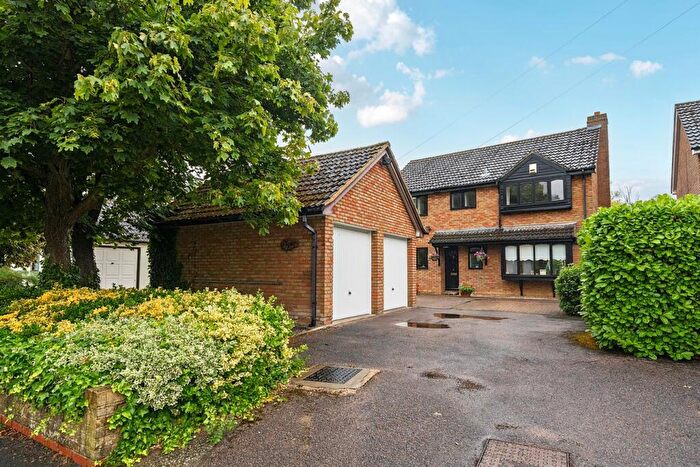
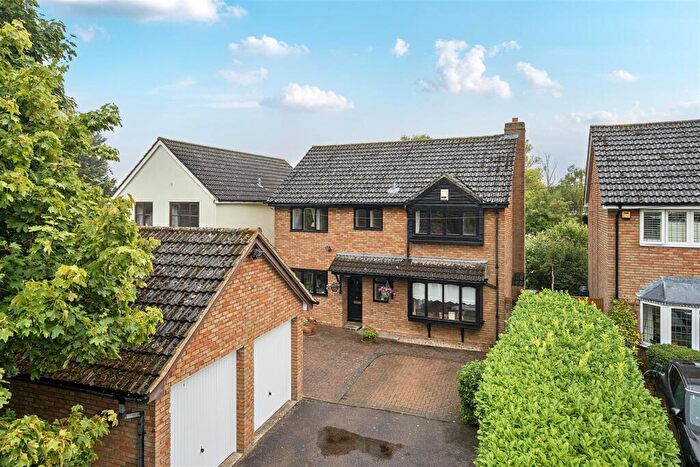
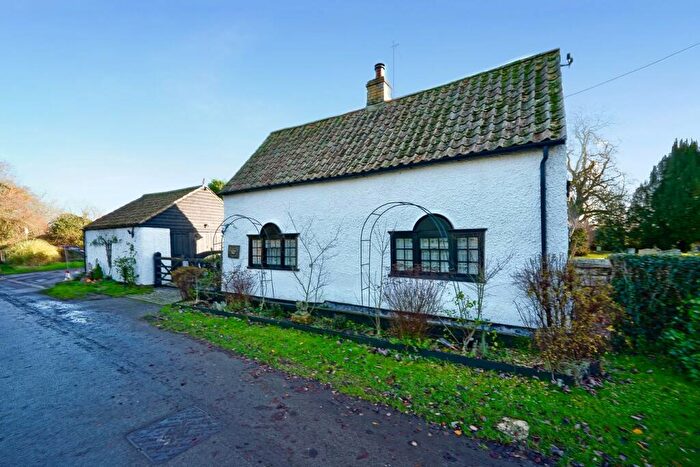
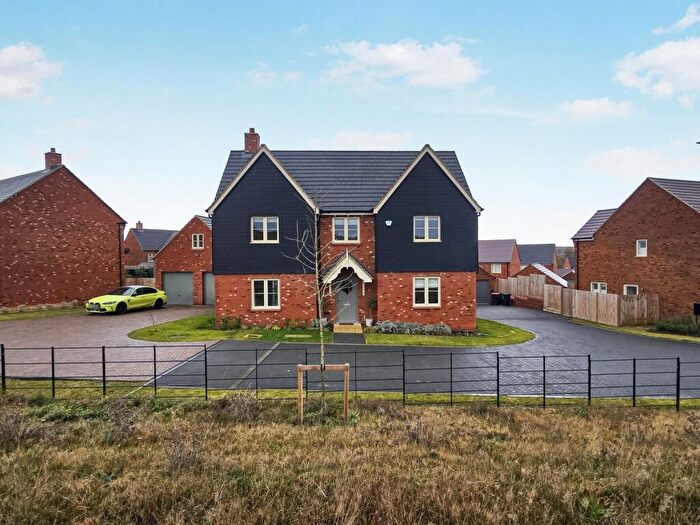
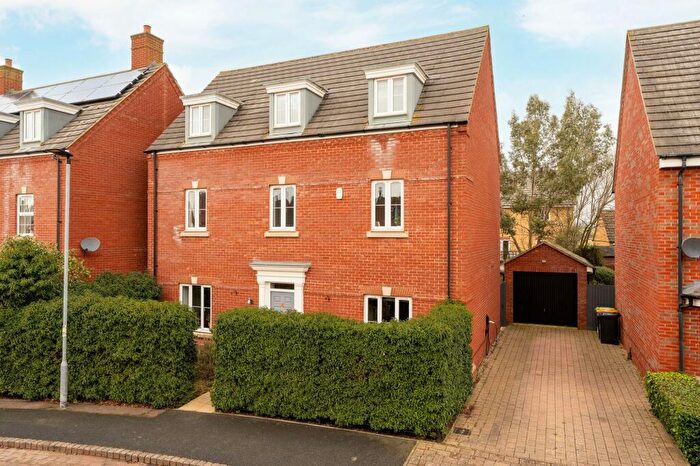
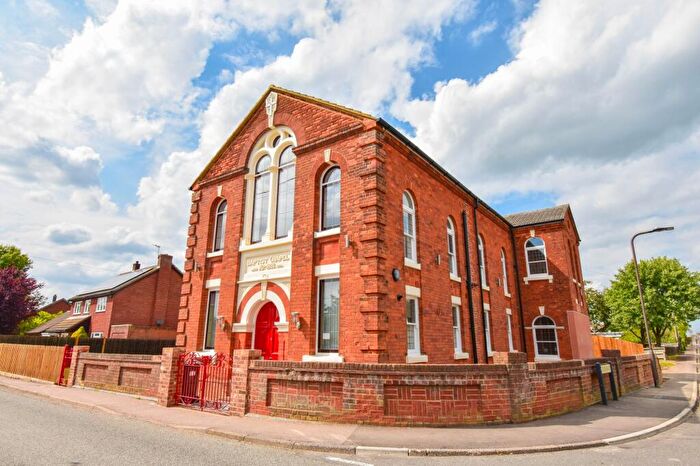
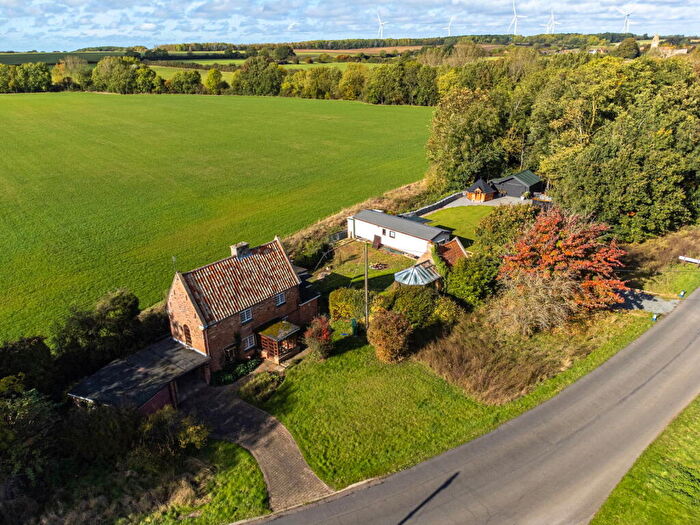
Properties for sale in Riseley
Roads and Postcodes in Riseley
Navigate through our locations to find the location of your next house in Riseley, Bedford for sale or to rent.
| Streets | Postcodes |
|---|---|
| Beanfield Close | MK44 1ES |
| Bedford Road | MK44 1EF MK44 2AY MK44 2AZ |
| Bedford Technology Park | MK44 2YA |
| Bennetts Close | MK44 1QX |
| Bourne End | MK44 1QS MK44 1QR |
| Bourne End Lane | MK44 1QP |
| Bourne Road | MK44 1EA |
| Bowers Close | MK44 1DP |
| Bowers Lane | MK44 1DL |
| Brooklands Road | MK44 1EE |
| Captains Close | MK44 1ED |
| Castle Barns | MK44 1TL |
| Chadwell End | MK44 2AU |
| Chapel Yard | MK44 2AN |
| Chapelfields | MK44 2EH |
| Chettles Close | MK44 1NH |
| Church End | MK44 2DA |
| Church Lane | MK44 1AU MK44 1EL MK44 1ER |
| College Drive | MK44 1DZ |
| Coplowe Lane | MK44 1QE MK44 2DQ |
| Cross End | MK44 2EE |
| Cross End Lane | MK44 2ED |
| Dag Lane | MK44 1EH |
| Davies Gardens | MK44 1FB |
| Dodds Close | MK44 1DH |
| Forge Gardens | MK44 1BA |
| Glebe Close | MK44 2FD |
| Gold Street | MK44 1EG MK44 1EQ |
| Grahams Gardens | MK44 1EW |
| Great Staughton Road | MK44 2BA |
| Green End | MK44 2AX MK44 2BB |
| Green Lane | MK44 2AF |
| High Barns Farm | MK44 1BZ |
| High Street | MK44 1AN MK44 1AS MK44 1AW MK44 1DD MK44 1DF MK44 1DJ MK44 1DR MK44 1DT MK44 1DU MK44 1DX MK44 2AA MK44 2DB MK44 2DS MK44 2DX MK44 1AR |
| High Top Barns | MK44 1BP |
| Hunters Yard | MK44 1EN |
| Keysoe Road | MK44 1DE MK44 2DY MK44 2DZ MK44 2EB MK44 2EA MK44 2HQ |
| Kimbolton Road | MK44 2BD MK44 2BE MK44 2SP |
| Kings Close | MK44 1EP |
| Knotting Lane | MK44 1BX |
| Knotting Road | MK44 1BE MK44 1BQ MK44 1AG MK44 1BG MK44 1BN |
| Litchfields | MK44 1DN |
| Little Staughton Road | MK44 2AW |
| Lowsdon Lane | MK44 1SN |
| Maple Gardens | MK44 1DQ |
| Melchbourne Park | MK44 1BD |
| Melchbourne Road | MK44 1BY MK44 2AH |
| Memorial Lane | MK44 1QJ |
| Mill Road | MK44 2DL MK44 2DP |
| Milton Road | MK44 2DF |
| North End | MK44 1QT |
| Old Milton Road | MK44 2DH MK44 2DJ |
| Old Way | MK44 1QG |
| Park Road | MK44 1BB |
| Paulsons Close | MK44 1DG |
| Pertenhall Road | MK44 2SU MK44 2AB MK44 2AD |
| Phillips Meadows | MK44 1AP |
| Riseley Road | MK44 1QU |
| Robins Folly | MK44 2EQ |
| Rotten Row | MK44 1EJ |
| Rushden Road | MK44 1QN MK44 1QW |
| Sandy Lane | MK44 2AE |
| Sharnbrook Road | MK44 1DA |
| Spring Holme | MK44 1BF |
| Spring Lane | MK44 1AT |
| St Marys Close | MK44 1QB |
| Stanbrook Way | MK44 1AX |
| Swineshead Road | MK44 2AT MK44 1BT MK44 1BU |
| The Avenue | MK44 1QD MK44 1QF MK44 1QH MK44 1QQ |
| The Barns | MK44 1SJ |
| The Close | MK44 2DT MK44 2DU |
| The Drive | MK44 1BS |
| The Orchard | MK44 1EB |
| Thurleigh Airfield Business Park | MK44 2YP |
| Thurleigh Road | MK44 1ZY MK44 1QA |
| Top Row | MK44 1QL |
| Trailly Close | MK44 1JH |
| Vicarage Green | MK44 2DR |
| Waldocks Close | MK44 1DS |
| Wells Road | MK44 1DY |
| Whitwick Green Road | MK44 2DD MK44 2DE MK44 2DG |
| Wood End Lane | MK44 2AS |
| Yielden Road | MK44 1BH |
| MK44 1AJ MK44 1AL MK44 1AH MK44 1AQ MK44 1BJ MK44 1BL MK44 1ZZ MK44 2SR |
Transport near Riseley
- FAQ
- Price Paid By Year
- Property Type Price
Frequently asked questions about Riseley
What is the average price for a property for sale in Riseley?
The average price for a property for sale in Riseley is £461,657. This amount is 24% higher than the average price in Bedford. There are 1,135 property listings for sale in Riseley.
What streets have the most expensive properties for sale in Riseley?
The streets with the most expensive properties for sale in Riseley are North End at an average of £1,000,000, Melchbourne Park at an average of £885,000 and Robins Folly at an average of £731,666.
What streets have the most affordable properties for sale in Riseley?
The streets with the most affordable properties for sale in Riseley are Dag Lane at an average of £229,500, Mill Road at an average of £262,833 and Wells Road at an average of £288,000.
Which train stations are available in or near Riseley?
Some of the train stations available in or near Riseley are Bedford Midland, Bedford St.Johns and Wellingborough.
Property Price Paid in Riseley by Year
The average sold property price by year was:
| Year | Average Sold Price | Price Change |
Sold Properties
|
|---|---|---|---|
| 2025 | £487,609 | 7% |
32 Properties |
| 2024 | £453,150 | 1% |
44 Properties |
| 2023 | £450,253 | -19% |
40 Properties |
| 2022 | £537,297 | 16% |
47 Properties |
| 2021 | £451,096 | 12% |
63 Properties |
| 2020 | £397,024 | -4% |
36 Properties |
| 2019 | £414,007 | -2% |
32 Properties |
| 2018 | £421,536 | 22% |
34 Properties |
| 2017 | £327,482 | -15% |
31 Properties |
| 2016 | £375,367 | 11% |
53 Properties |
| 2015 | £333,997 | 10% |
53 Properties |
| 2014 | £300,650 | -5% |
62 Properties |
| 2013 | £315,279 | 16% |
43 Properties |
| 2012 | £266,232 | -19% |
29 Properties |
| 2011 | £316,222 | 17% |
28 Properties |
| 2010 | £263,273 | 7% |
38 Properties |
| 2009 | £245,476 | -18% |
42 Properties |
| 2008 | £288,846 | -4% |
27 Properties |
| 2007 | £301,397 | 8% |
45 Properties |
| 2006 | £278,484 | 10% |
48 Properties |
| 2005 | £251,018 | 8% |
38 Properties |
| 2004 | £231,868 | 9% |
30 Properties |
| 2003 | £210,691 | -2% |
40 Properties |
| 2002 | £215,604 | 7% |
58 Properties |
| 2001 | £199,434 | 20% |
53 Properties |
| 2000 | £160,056 | 7% |
57 Properties |
| 1999 | £149,009 | 7% |
77 Properties |
| 1998 | £138,839 | 26% |
50 Properties |
| 1997 | £103,058 | 13% |
55 Properties |
| 1996 | £89,526 | -11% |
54 Properties |
| 1995 | £99,026 | - |
39 Properties |
Property Price per Property Type in Riseley
Here you can find historic sold price data in order to help with your property search.
The average Property Paid Price for specific property types in the last three years are:
| Property Type | Average Sold Price | Sold Properties |
|---|---|---|
| Semi Detached House | £373,556.00 | 25 Semi Detached Houses |
| Detached House | £542,233.00 | 68 Detached Houses |
| Terraced House | £319,195.00 | 23 Terraced Houses |

