
Houses for sale & to rent in MK45 4JA, The Glebe, Silsoe And Shillington, Bedford
House Prices in MK45 4JA, The Glebe, Silsoe And Shillington
Properties in MK45 4JA have no sales history available within the last 3 years. MK45 4JA is a postcode in The Glebe located in Silsoe And Shillington, an area in Bedford, Bedfordshire, with 6 households².
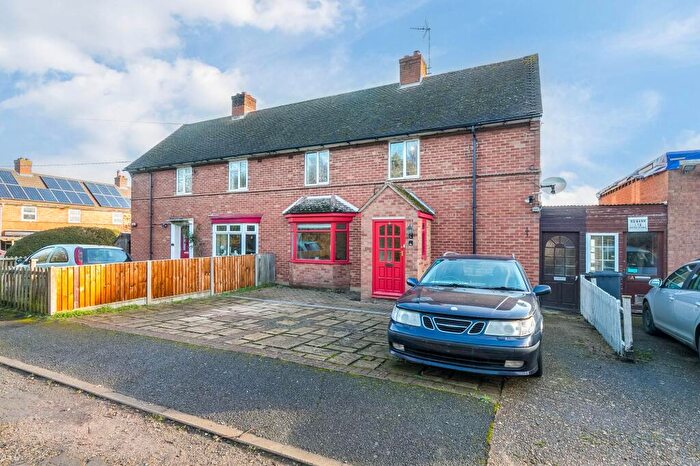
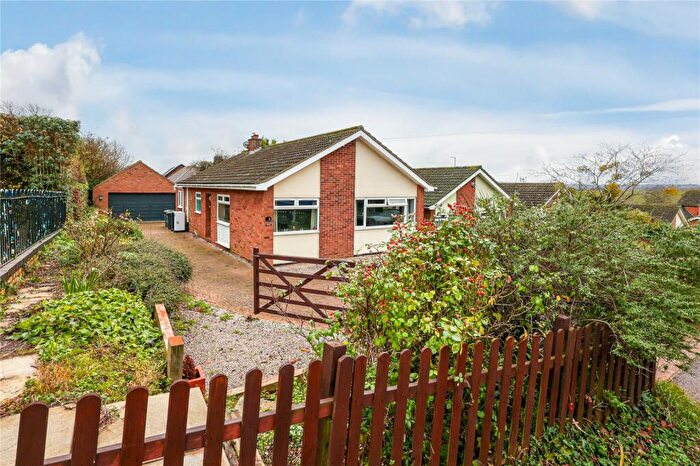
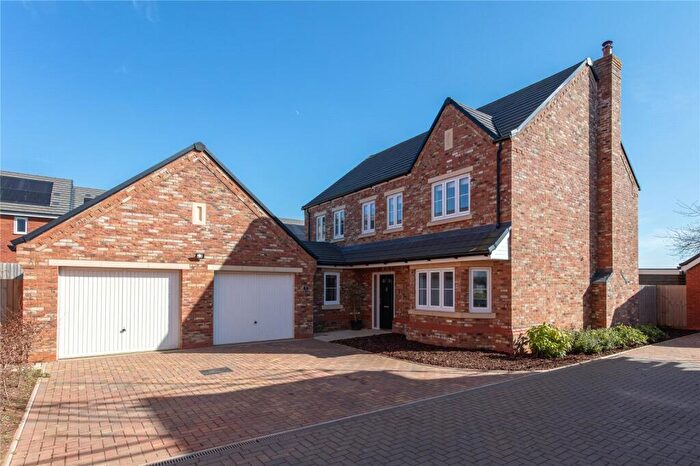
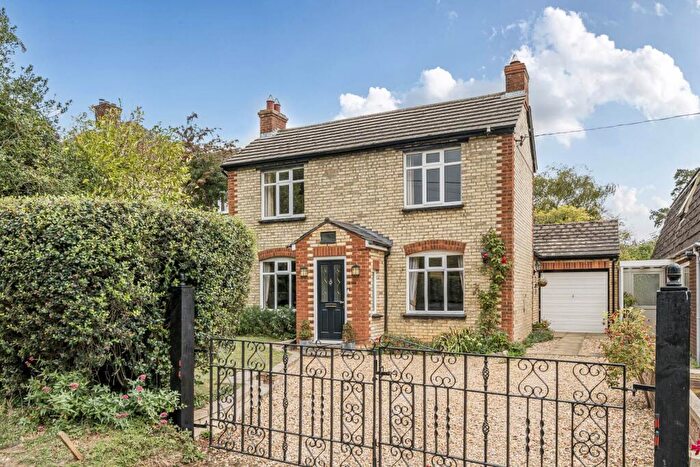
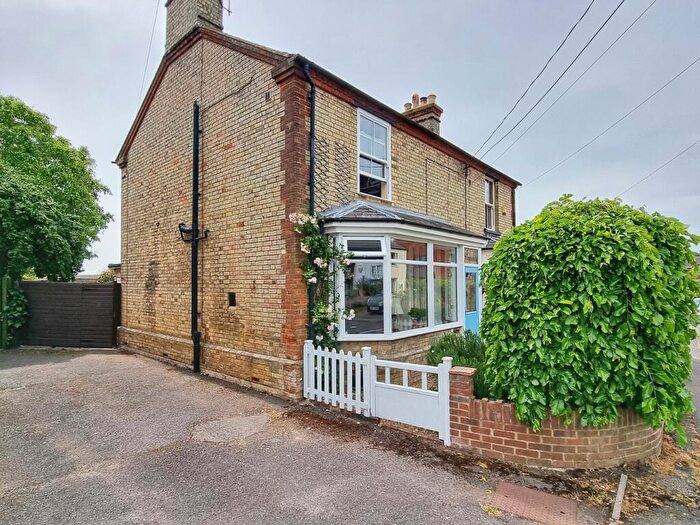
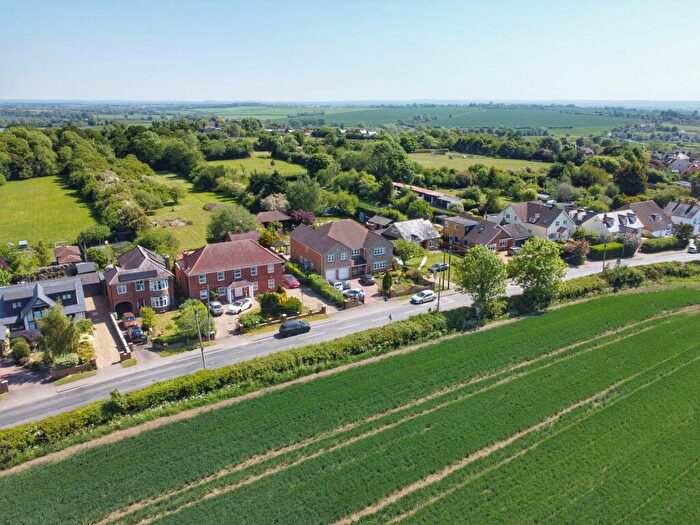
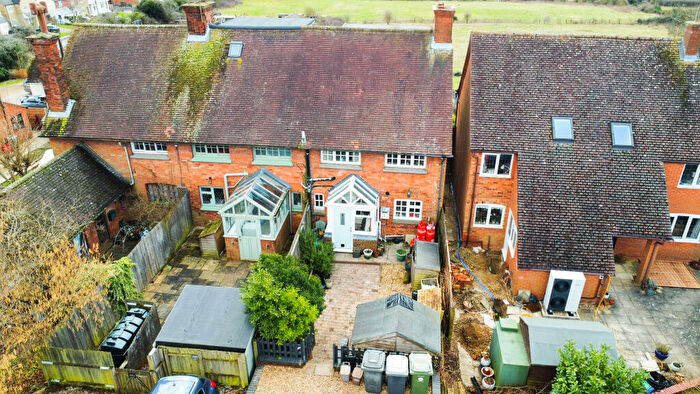
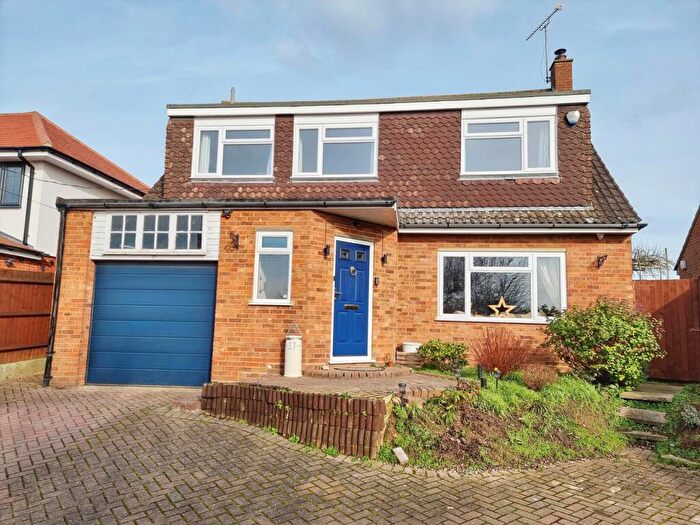
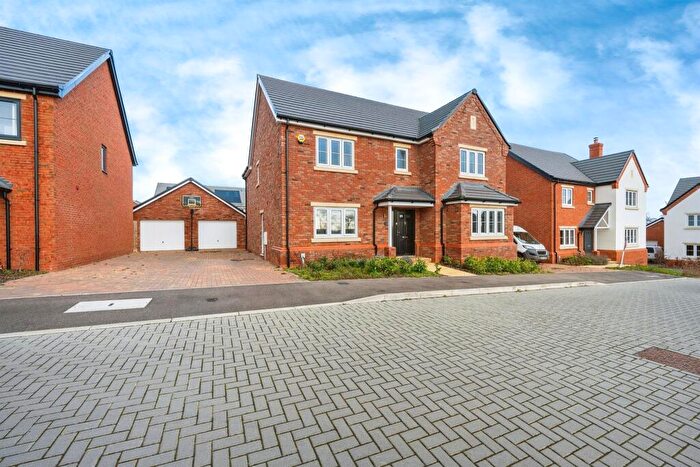
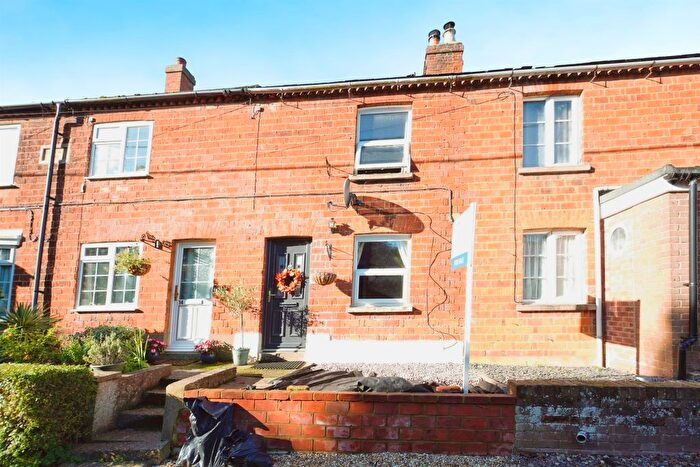
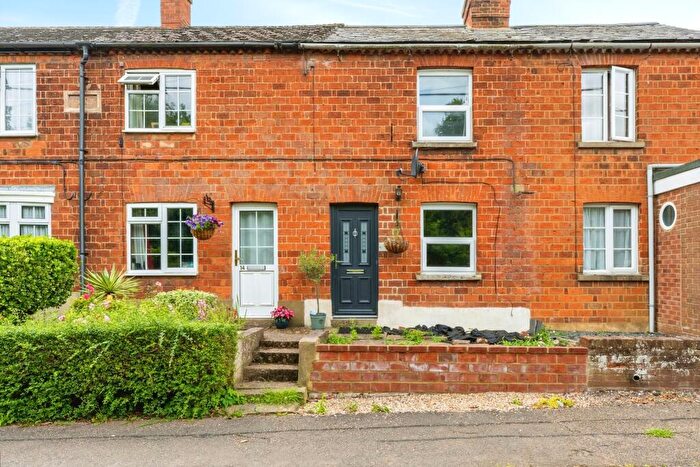
Properties for sale near MK45 4JA, The Glebe
![]()
If you are looking to sell your house, let it out, or receive a property valuation, an expert can help you.
Click the button below to get started.
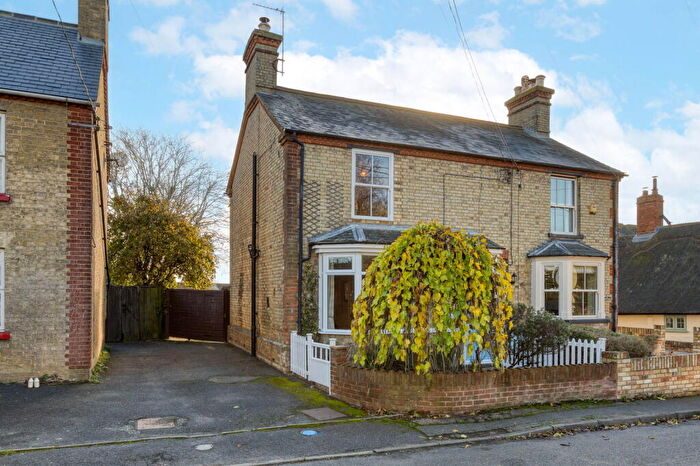
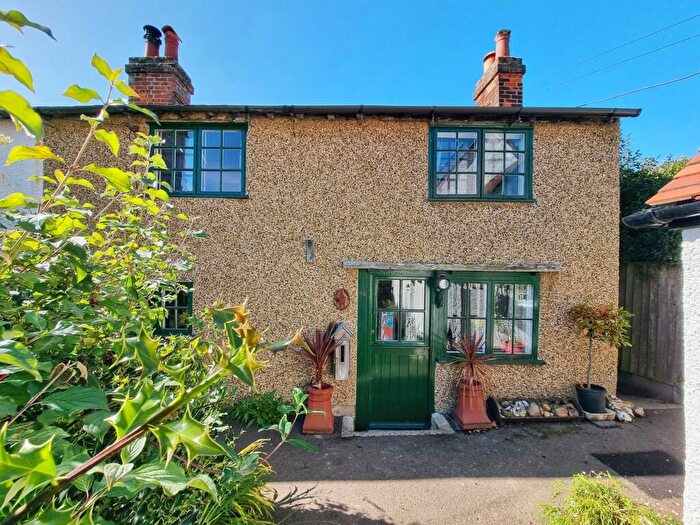
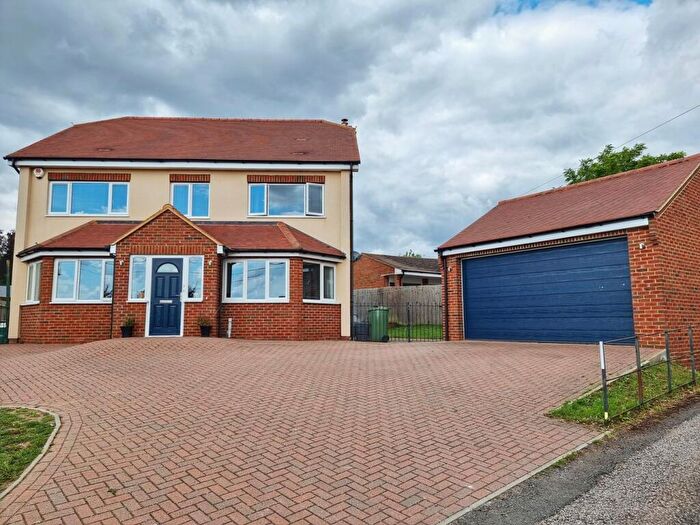
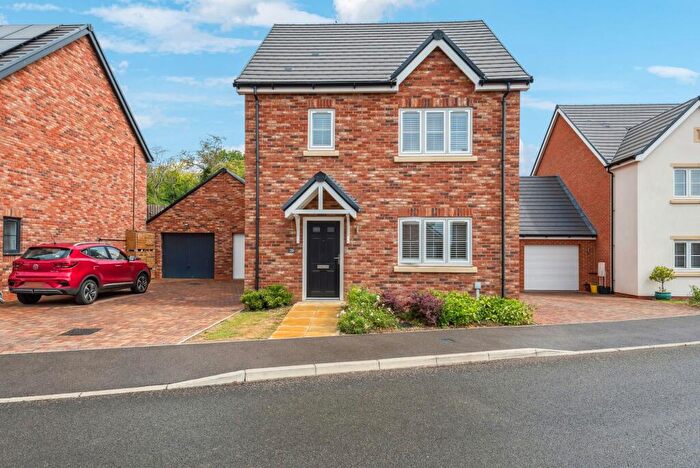
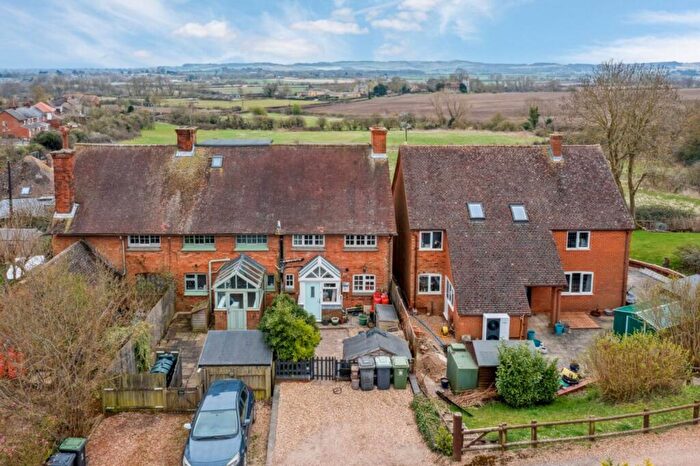
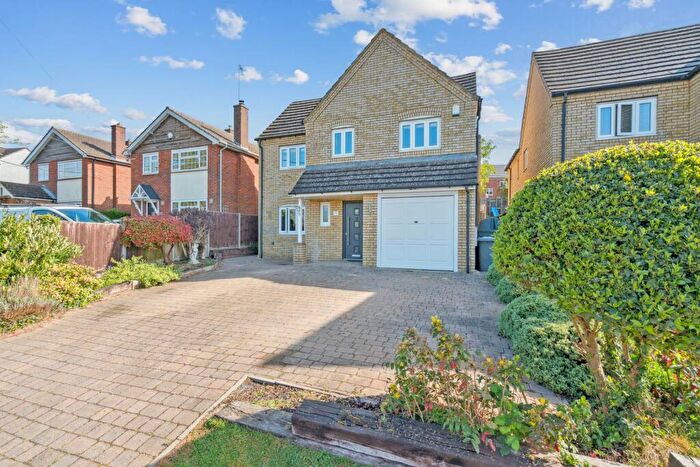
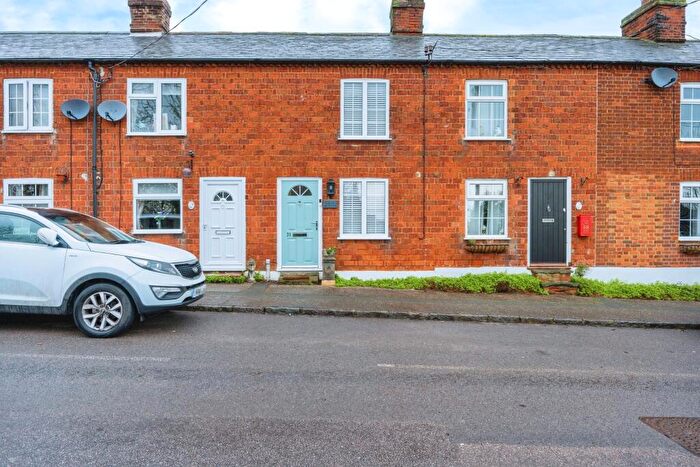
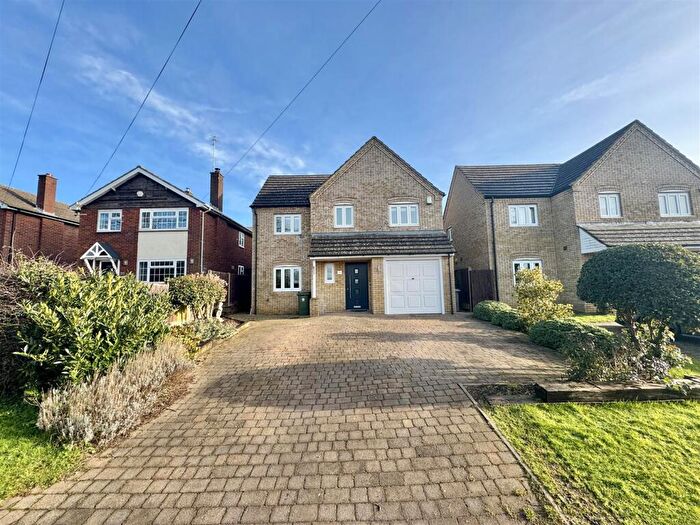
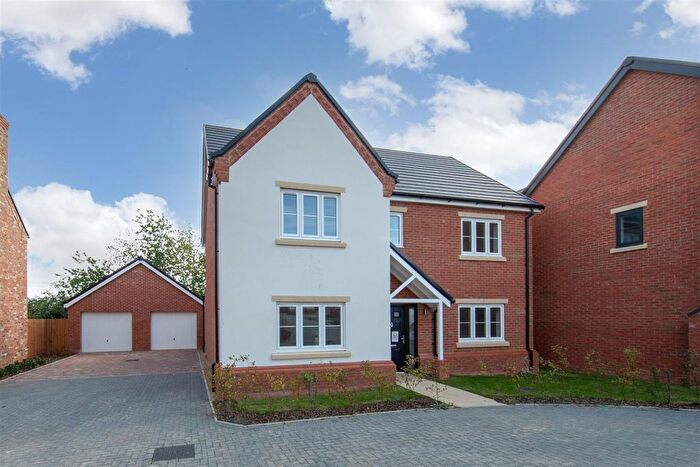
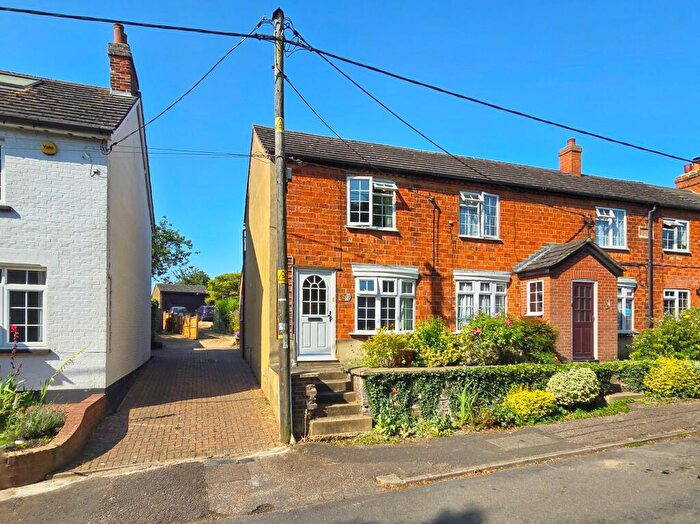
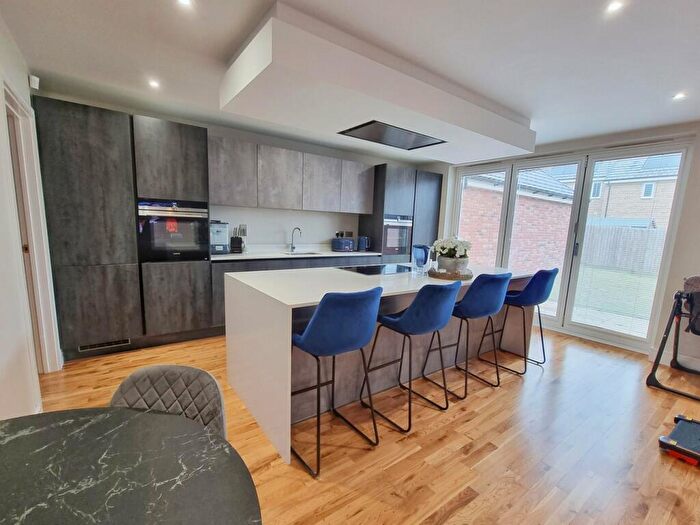
Previously listed properties near MK45 4JA, The Glebe
![]()
If you are looking to sell your house, let it out, or receive a property valuation, an expert can help you.
Click the button below to get started.


Price Paid in The Glebe, MK45 4JA, Silsoe And Shillington
6 The Glebe, MK45 4JA, Silsoe And Shillington Bedford
Property 6 has been sold 2 times. The last time it was sold was in 25/06/2021 and the sold price was £425,000.00.
This terraced house, sold as a freehold on 25/06/2021, is a 155 sqm semi-detached house with an EPC rating of D.
| Date | Price | Property Type | Tenure | Classification |
|---|---|---|---|---|
| 25/06/2021 | £425,000.00 | Terraced House | freehold | Established Building |
| 19/11/2007 | £249,995.00 | Terraced House | freehold | Established Building |
2 The Glebe, MK45 4JA, Silsoe And Shillington Bedford
Property 2 has been sold 2 times. The last time it was sold was in 22/11/2019 and the sold price was £310,000.00.
This semi detached house, sold as a freehold on 22/11/2019, is a 84 sqm semi-detached house with an EPC rating of D.
| Date | Price | Property Type | Tenure | Classification |
|---|---|---|---|---|
| 22/11/2019 | £310,000.00 | Semi Detached House | freehold | Established Building |
| 07/09/2012 | £177,500.00 | Semi Detached House | freehold | Established Building |
Transport near MK45 4JA, The Glebe
-
 Arlesey Station
 -
Flitwick Station
-
Harlington Station
-
Hitchin Station
-
Letchworth Station
-
Biggleswade Station
-
Millbrook (Bedfordshire) Station
-
Stewartby Station
-
Kempston Hardwick Station
-
Lidlington Station
House price paid reports for MK45 4JA, The Glebe
Click on the buttons below to see price paid reports by year or property price:
- Price Paid By Year
Property Price Paid in MK45 4JA, The Glebe by Year
The average sold property price by year was:
| Year | Average Sold Price | Price Change |
Sold Properties
|
|---|---|---|---|
| 2021 | £425,000 | 27% |
1 Property |
| 2019 | £310,000 | 43% |
1 Property |
| 2012 | £177,500 | -41% |
1 Property |
| 2007 | £249,995 | - |
1 Property |