
Houses for sale & to rent in Erdington, Birmingham
House Prices in Erdington
Properties in Erdington have an average house price of £211k and had 921 Property Transactions within the last 3 years¹.
Erdington is an area in Birmingham, Birmingham with 10,000 households², where the most expensive property was sold for £605k.
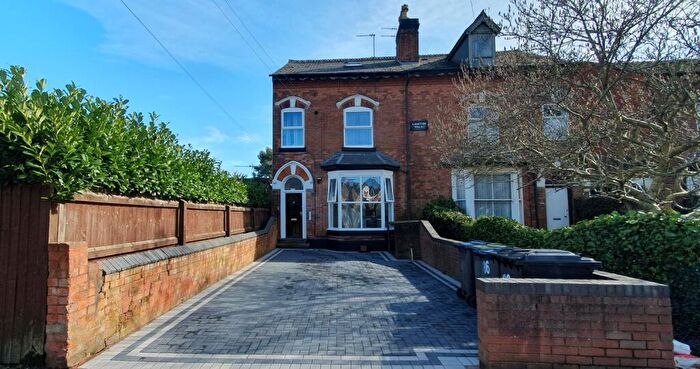
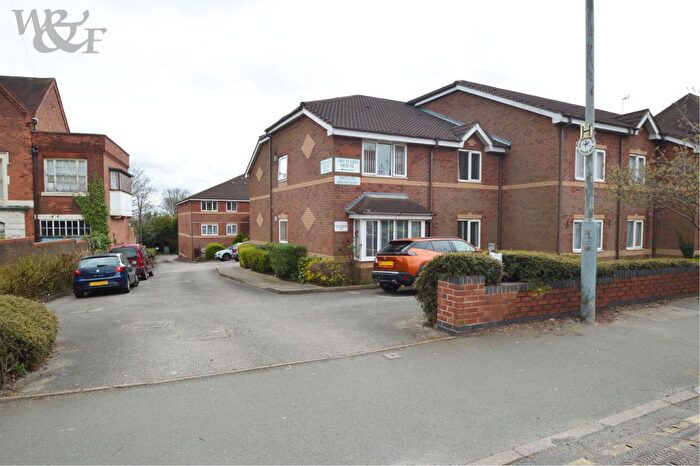
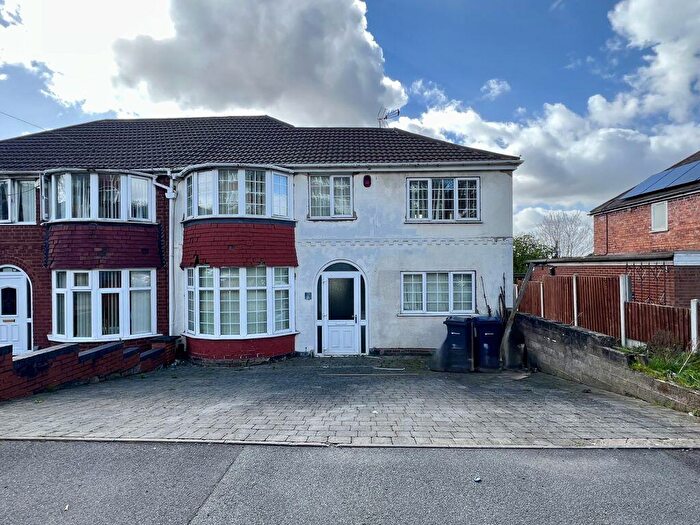
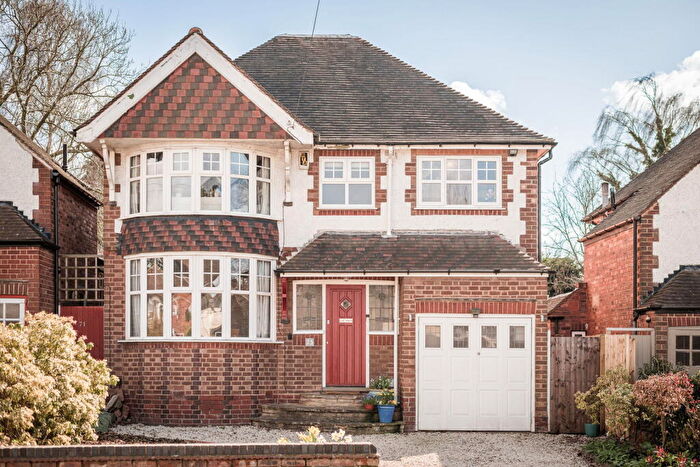
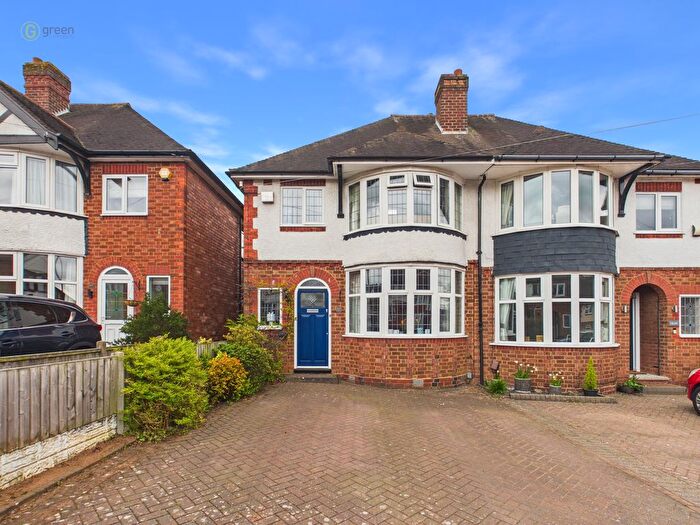
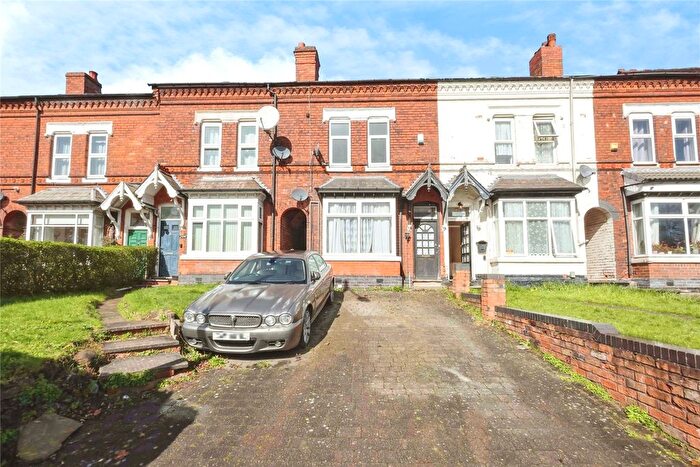
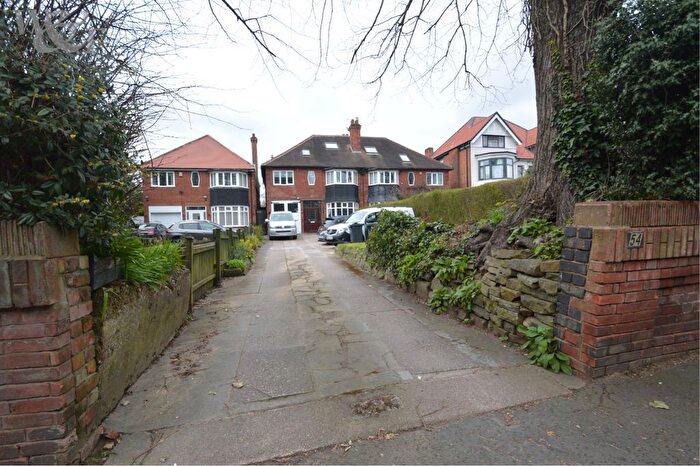
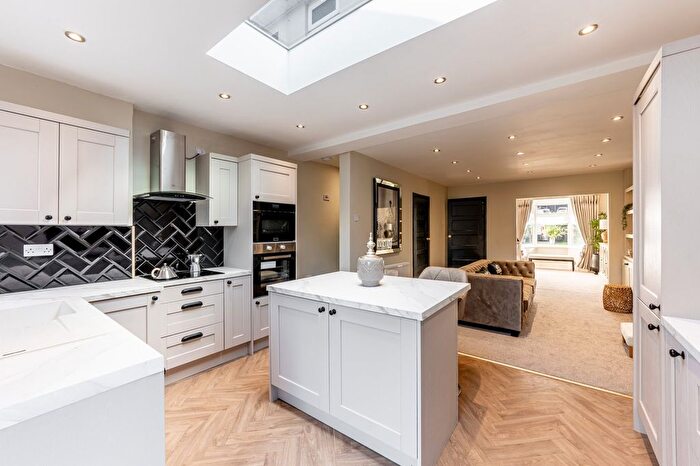
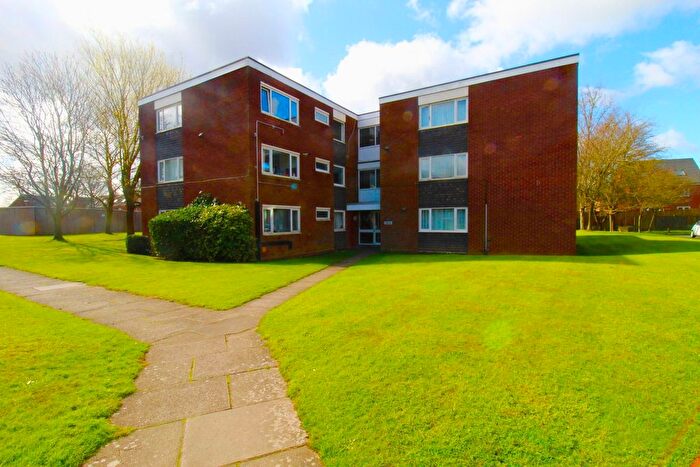
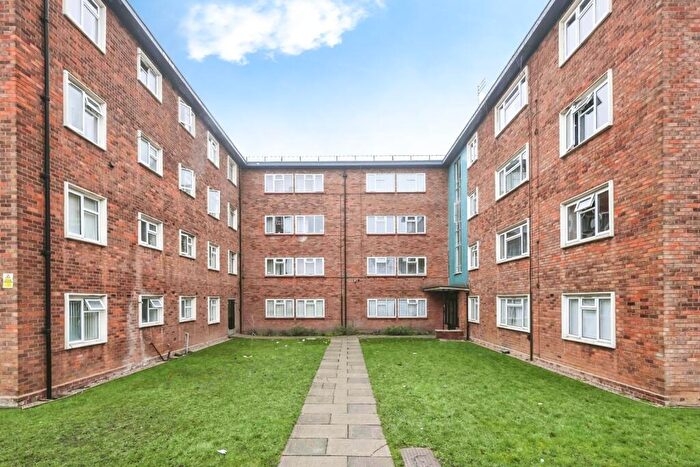
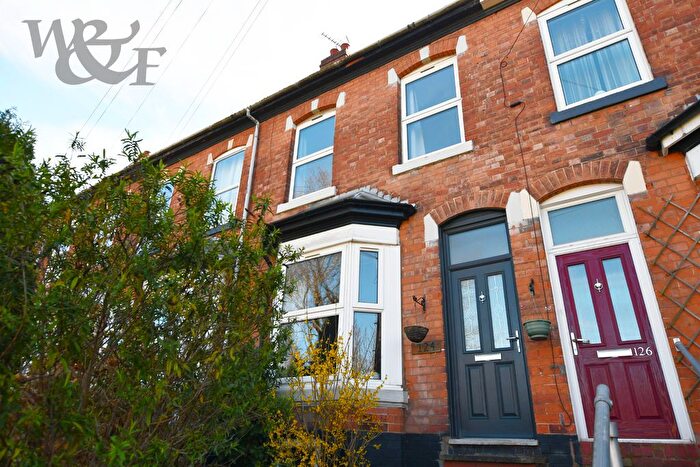
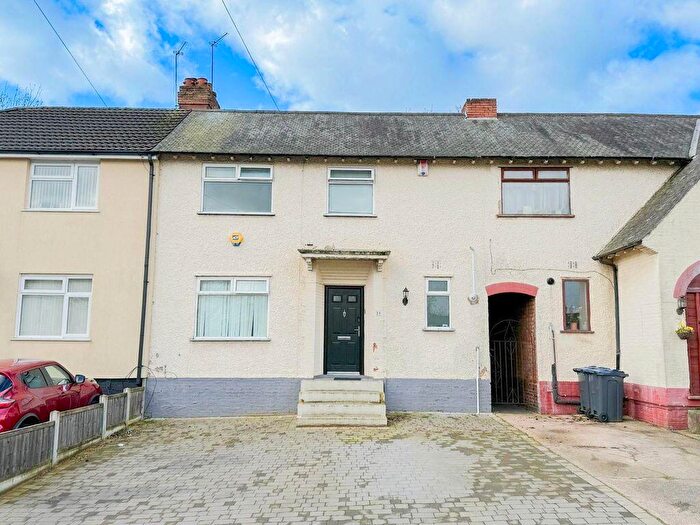
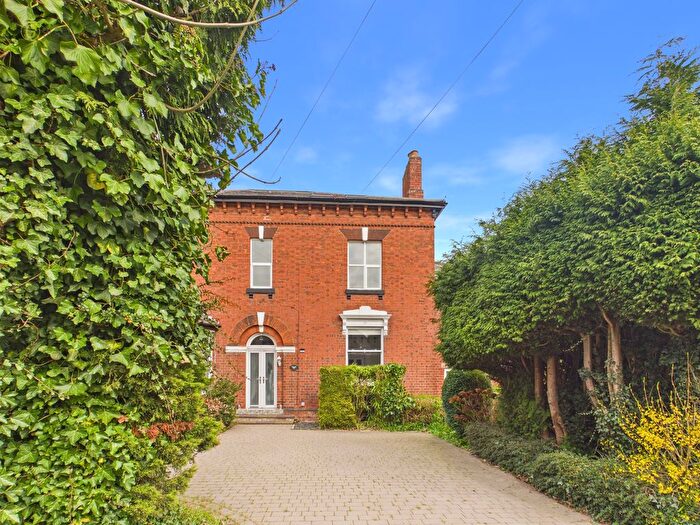
Properties for sale in Erdington
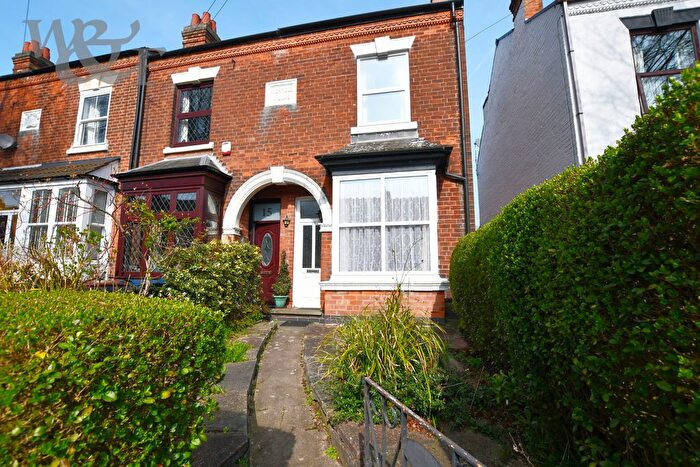
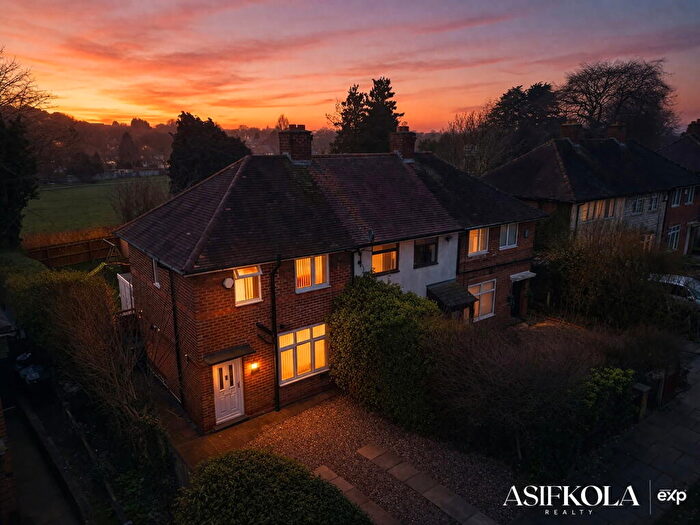
![]()
If you are looking to sell your house, let it out, or receive a property valuation, an expert can help you.
Click the button below to get started.

Roads and Postcodes in Erdington
Navigate through our locations to find the location of your next house in Erdington, Birmingham for sale or to rent.
Transport near Erdington
-
 Erdington Station
 -
Chester Road Station
-
Gravelly Hill Station
-
Wylde Green Station
-
Aston Station
-
Witton Station
-
Sutton Coldfield Station
-
Perry Barr Station
- FAQ
- Price Paid By Year
- Property Type Price
Frequently asked questions about Erdington
What is the average price for a property for sale in Erdington?
The average price for a property for sale in Erdington is £210,548. This amount is 11% lower than the average price in Birmingham. There are 6,723 property listings for sale in Erdington.
What streets have the most expensive properties for sale in Erdington?
The streets with the most expensive properties for sale in Erdington are Poppy Lane at an average of £455,000, Rollason Road at an average of £436,250 and Orchard Road at an average of £389,938.
What streets have the most affordable properties for sale in Erdington?
The streets with the most affordable properties for sale in Erdington are Portfield Grove at an average of £59,333, Swan Gardens at an average of £79,750 and Penndale Close at an average of £90,000.
Which train stations are available in or near Erdington?
Some of the train stations available in or near Erdington are Erdington, Chester Road and Gravelly Hill.
Property Price Paid in Erdington by Year
The average sold property price by year was:
| Year | Average Sold Price | Price Change |
Sold Properties
|
|---|---|---|---|
| 2026 | £282,000 | 23% |
5 Properties |
| 2025 | £216,455 | 2% |
306 Properties |
| 2024 | £211,528 | 4% |
297 Properties |
| 2023 | £202,701 | -6% |
313 Properties |
| 2022 | £215,474 | 2% |
372 Properties |
| 2021 | £210,681 | 12% |
474 Properties |
| 2020 | £184,526 | 9% |
372 Properties |
| 2019 | £168,038 | -4% |
413 Properties |
| 2018 | £174,153 | 4% |
370 Properties |
| 2017 | £167,131 | 14% |
401 Properties |
| 2016 | £144,410 | 1% |
394 Properties |
| 2015 | £143,018 | 10% |
446 Properties |
| 2014 | £128,836 | -8% |
351 Properties |
| 2013 | £138,562 | 8% |
301 Properties |
| 2012 | £128,129 | 5% |
221 Properties |
| 2011 | £121,151 | -8% |
220 Properties |
| 2010 | £130,470 | 6% |
283 Properties |
| 2009 | £123,090 | -9% |
172 Properties |
| 2008 | £134,509 | -3% |
284 Properties |
| 2007 | £138,371 | -0,3% |
521 Properties |
| 2006 | £138,732 | 10% |
494 Properties |
| 2005 | £124,663 | 8% |
439 Properties |
| 2004 | £115,065 | 13% |
507 Properties |
| 2003 | £100,403 | 20% |
486 Properties |
| 2002 | £80,473 | 15% |
538 Properties |
| 2001 | £68,065 | 12% |
507 Properties |
| 2000 | £59,668 | 8% |
476 Properties |
| 1999 | £55,132 | 9% |
466 Properties |
| 1998 | £50,323 | -2% |
393 Properties |
| 1997 | £51,244 | 5% |
437 Properties |
| 1996 | £48,748 | - |
395 Properties |
| 1995 | £48,742 | - |
315 Properties |
Property Price per Property Type in Erdington
Here you can find historic sold price data in order to help with your property search.
The average Property Paid Price for specific property types in the last three years are:
| Property Type | Average Sold Price | Sold Properties |
|---|---|---|
| Semi Detached House | £250,718.00 | 343 Semi Detached Houses |
| Detached House | £345,068.00 | 55 Detached Houses |
| Terraced House | £199,088.00 | 351 Terraced Houses |
| Flat | £110,810.00 | 172 Flats |