
Houses for sale & to rent in Sutton Vesey, Birmingham
House Prices in Sutton Vesey
Properties in Sutton Vesey have an average house price of £184k and had 25 Property Transactions within the last 3 years¹.
Sutton Vesey is an area in Birmingham, Birmingham with 325 households², where the most expensive property was sold for £385k.
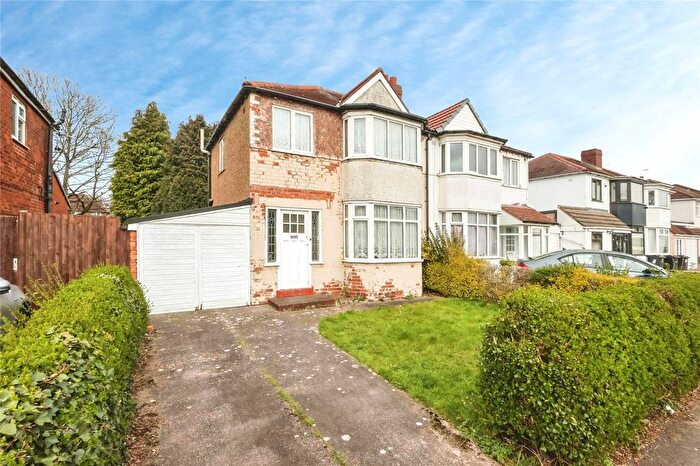
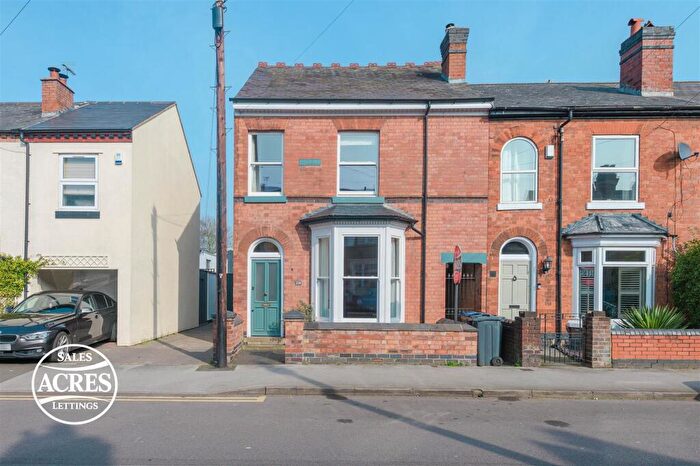
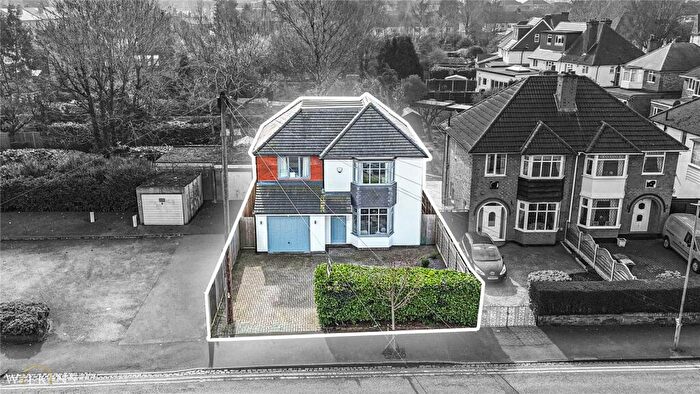
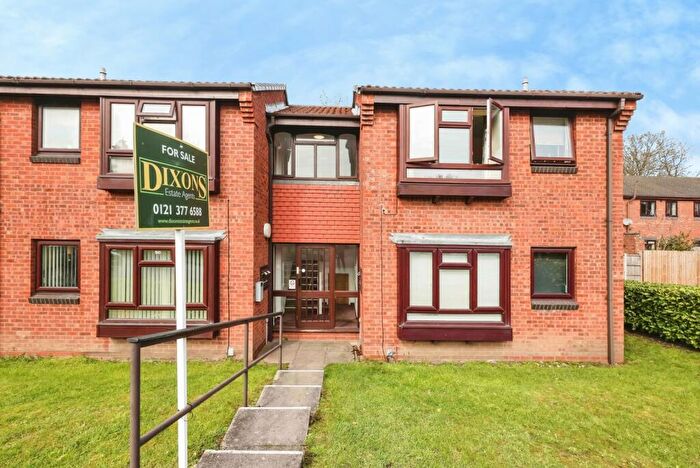
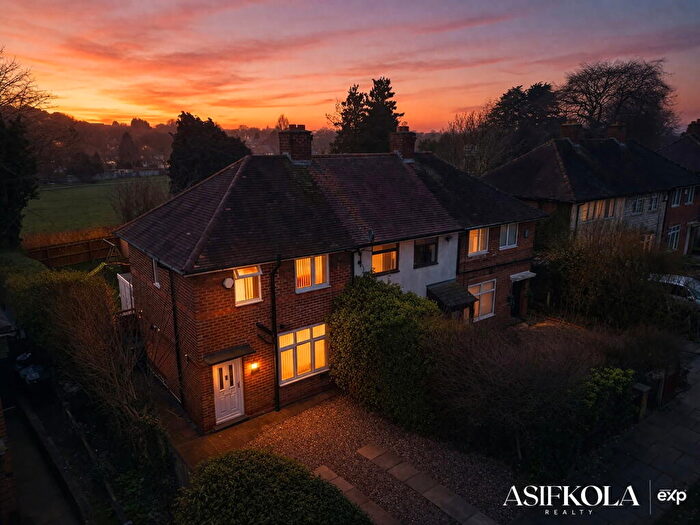
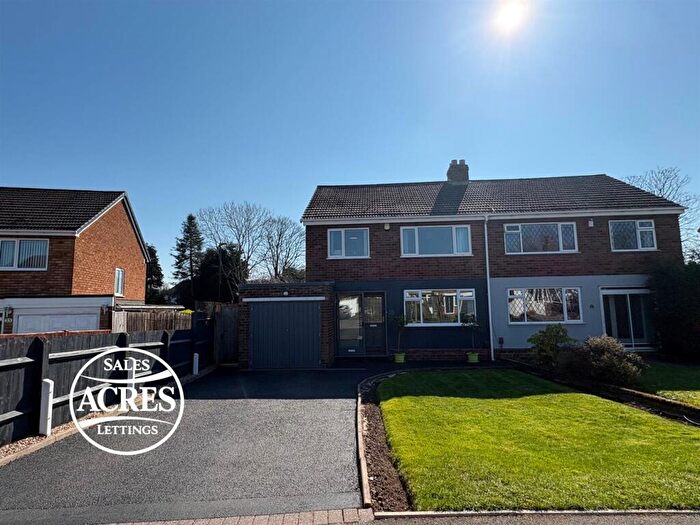
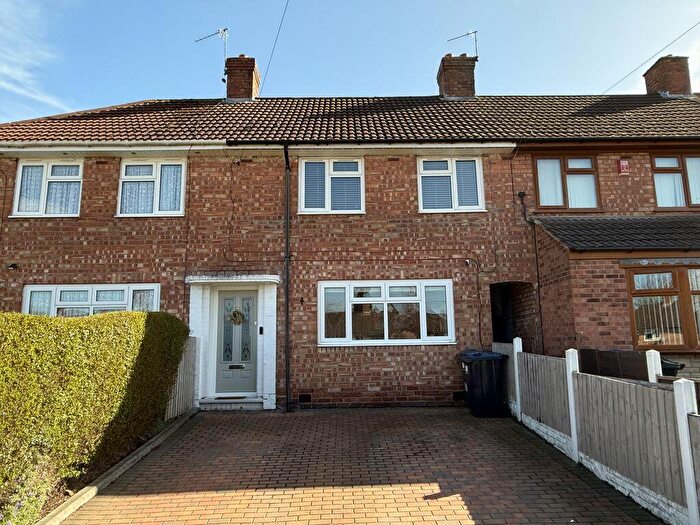
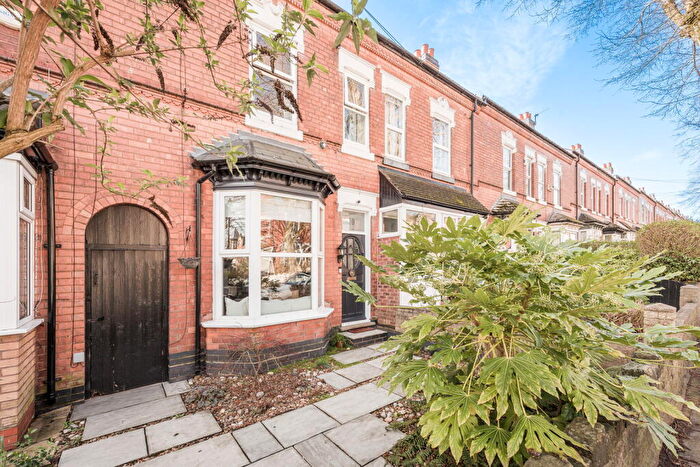
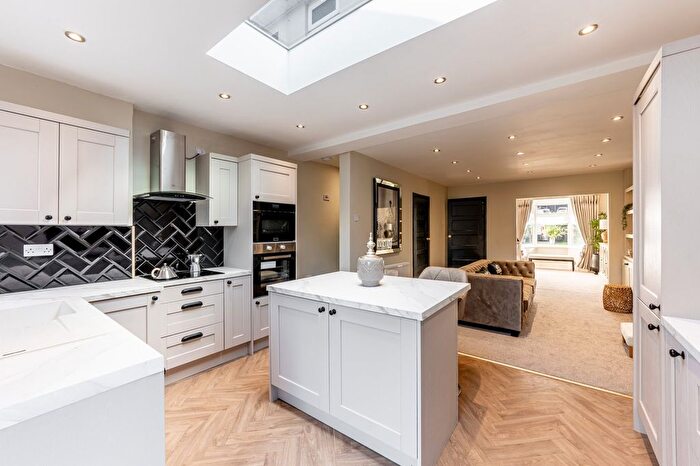
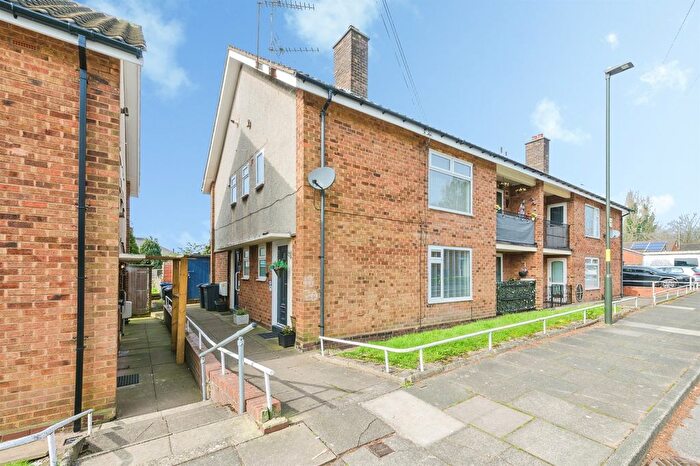
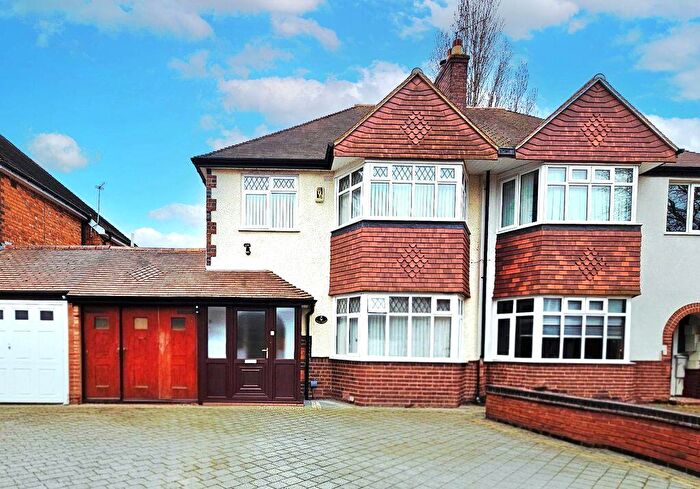
Properties for sale in Sutton Vesey
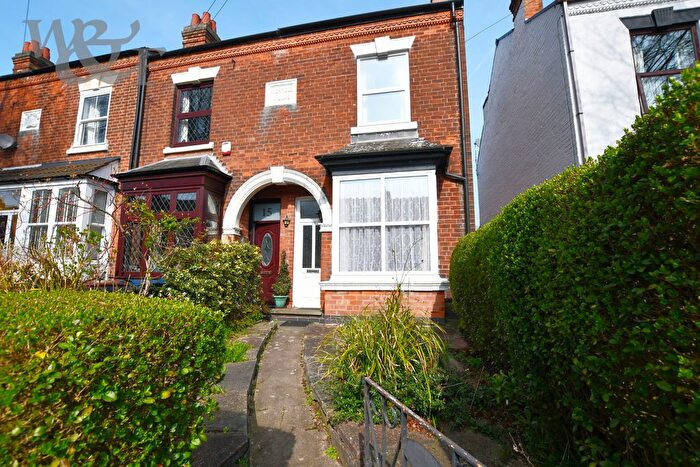
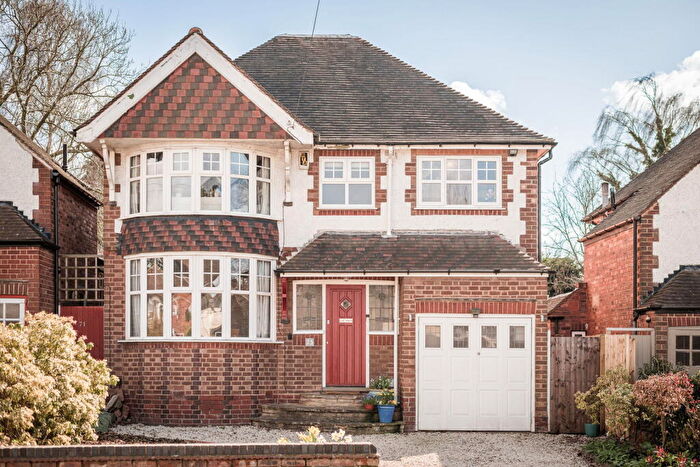
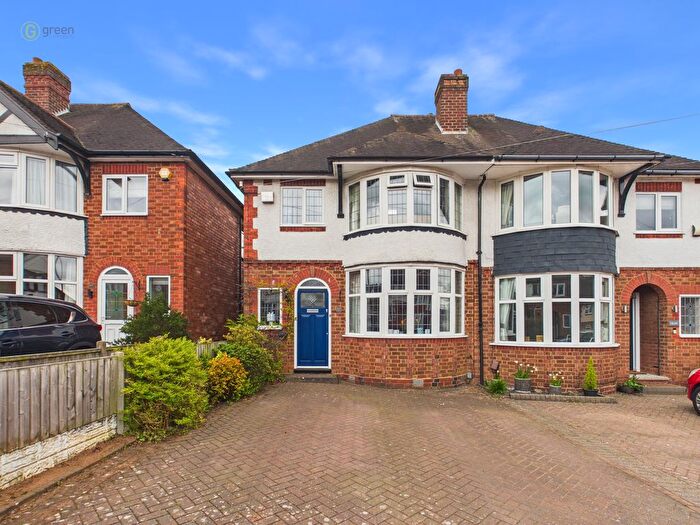
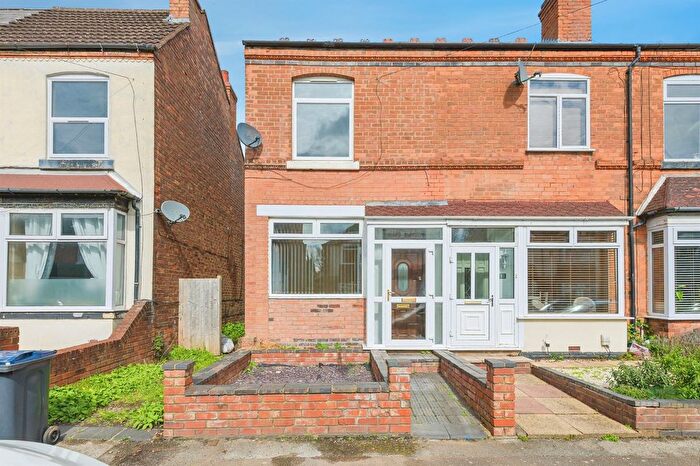
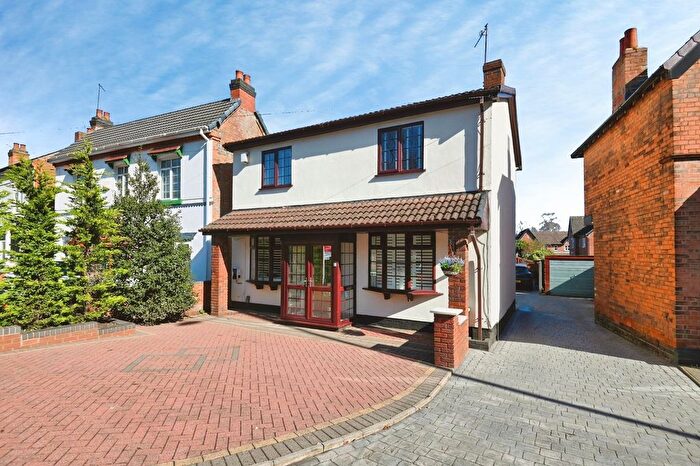
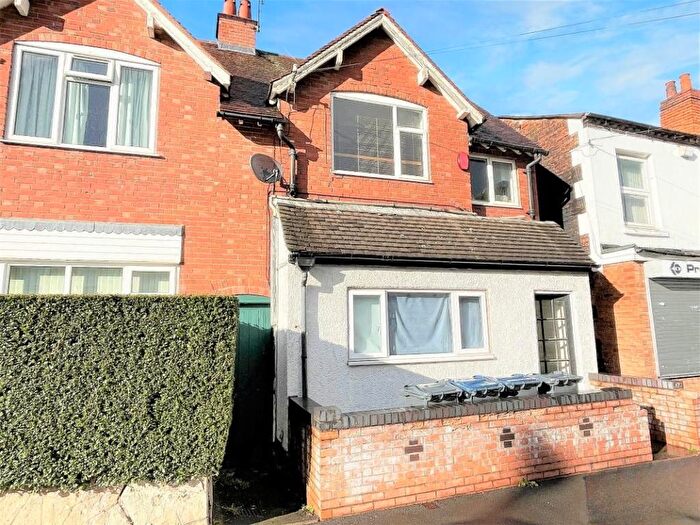
![]()
If you are looking to sell your house, let it out, or receive a property valuation, an expert can help you.
Click the button below to get started.
Roads and Postcodes in Sutton Vesey
Navigate through our locations to find the location of your next house in Sutton Vesey, Birmingham for sale or to rent.
| Streets | Postcodes |
|---|---|
| Beech Road | B23 5QJ B23 5QN |
| Court Lane | B23 5LE |
| Gravelly Lane | B23 5TA |
| Green Leigh | B23 5QL |
| Leamount Drive | B44 0SG |
| Littlecote Drive | B23 5QW B23 5QZ |
| Sycamore Road | B23 5QP |
| Trident Close | B23 5TB B23 5TD |
Transport near Sutton Vesey
-
 Chester Road Station
 -
Wylde Green Station
-
Erdington Station
-
Gravelly Hill Station
-
Sutton Coldfield Station
-
Witton Station
-
Aston Station
-
Four Oaks Station
-
Perry Barr Station
- FAQ
- Price Paid By Year
- Property Type Price
Frequently asked questions about Sutton Vesey
What is the average price for a property for sale in Sutton Vesey?
The average price for a property for sale in Sutton Vesey is £184,324. This amount is 22% lower than the average price in Birmingham. There are 2,223 property listings for sale in Sutton Vesey.
What streets have the most expensive properties for sale in Sutton Vesey?
The streets with the most expensive properties for sale in Sutton Vesey are Beech Road at an average of £307,571, Court Lane at an average of £264,000 and Leamount Drive at an average of £262,600.
What streets have the most affordable properties for sale in Sutton Vesey?
The streets with the most affordable properties for sale in Sutton Vesey are Green Leigh at an average of £68,200, Littlecote Drive at an average of £115,875 and Trident Close at an average of £120,000.
Which train stations are available in or near Sutton Vesey?
Some of the train stations available in or near Sutton Vesey are Chester Road, Wylde Green and Erdington.
Property Price Paid in Sutton Vesey by Year
The average sold property price by year was:
| Year | Average Sold Price | Price Change |
Sold Properties
|
|---|---|---|---|
| 2025 | £221,560 | 36% |
10 Properties |
| 2024 | £141,714 | -24% |
7 Properties |
| 2023 | £175,062 | 6% |
8 Properties |
| 2022 | £165,300 | 9% |
15 Properties |
| 2021 | £149,714 | -13% |
21 Properties |
| 2020 | £169,307 | 23% |
13 Properties |
| 2019 | £130,750 | 4% |
15 Properties |
| 2018 | £125,937 | -8% |
8 Properties |
| 2017 | £135,590 | 18% |
17 Properties |
| 2016 | £111,464 | -4% |
14 Properties |
| 2015 | £115,759 | 4% |
15 Properties |
| 2014 | £111,057 | -17% |
19 Properties |
| 2013 | £129,687 | 43% |
8 Properties |
| 2012 | £73,937 | -42% |
8 Properties |
| 2011 | £105,083 | -32% |
6 Properties |
| 2010 | £138,278 | 36% |
7 Properties |
| 2009 | £88,265 | -19% |
12 Properties |
| 2008 | £105,392 | -1% |
7 Properties |
| 2007 | £106,578 | -2% |
19 Properties |
| 2006 | £108,671 | -11% |
35 Properties |
| 2005 | £120,490 | 11% |
22 Properties |
| 2004 | £107,717 | 31% |
29 Properties |
| 2003 | £74,219 | 25% |
43 Properties |
| 2002 | £55,669 | 9% |
43 Properties |
| 2001 | £50,556 | 3% |
24 Properties |
| 2000 | £48,978 | 13% |
25 Properties |
| 1999 | £42,832 | 12% |
37 Properties |
| 1998 | £37,767 | -7% |
23 Properties |
| 1997 | £40,469 | 0,5% |
18 Properties |
| 1996 | £40,284 | 24% |
23 Properties |
| 1995 | £30,722 | - |
9 Properties |
Property Price per Property Type in Sutton Vesey
Here you can find historic sold price data in order to help with your property search.
The average Property Paid Price for specific property types in the last three years are:
| Property Type | Average Sold Price | Sold Properties |
|---|---|---|
| Semi Detached House | £276,950.00 | 8 Semi Detached Houses |
| Terraced House | £268,100.00 | 5 Terraced Houses |
| Flat | £87,666.00 | 12 Flats |