
Houses for sale & to rent in Harborne, Birmingham
House Prices in Harborne
Properties in Harborne have an average house price of £347k and had 957 Property Transactions within the last 3 years¹.
Harborne is an area in Birmingham, Birmingham with 10,529 households², where the most expensive property was sold for £2.25M.
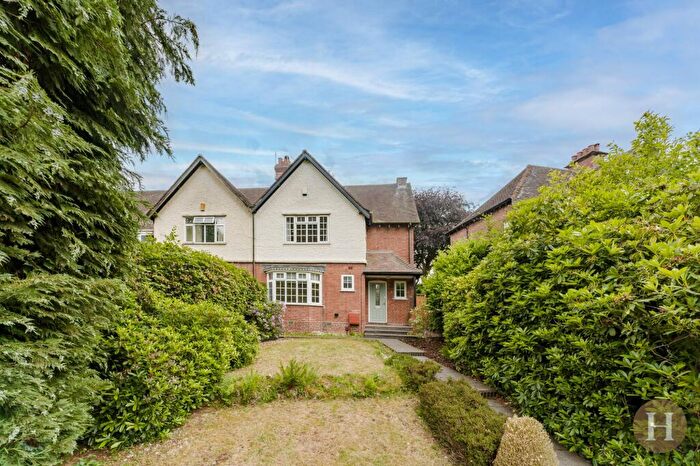
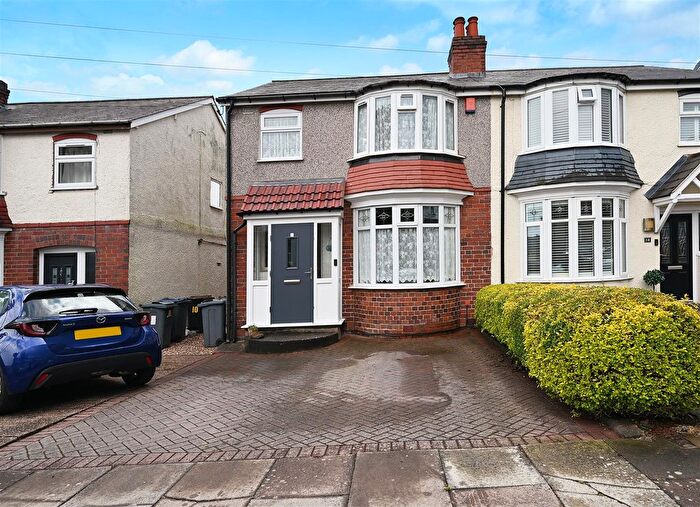
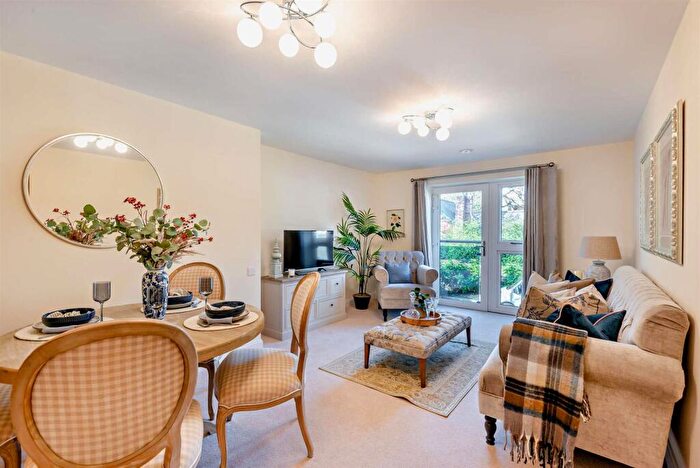
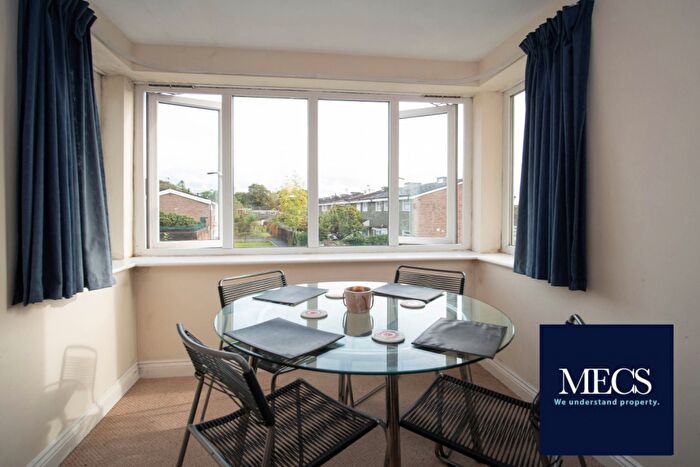
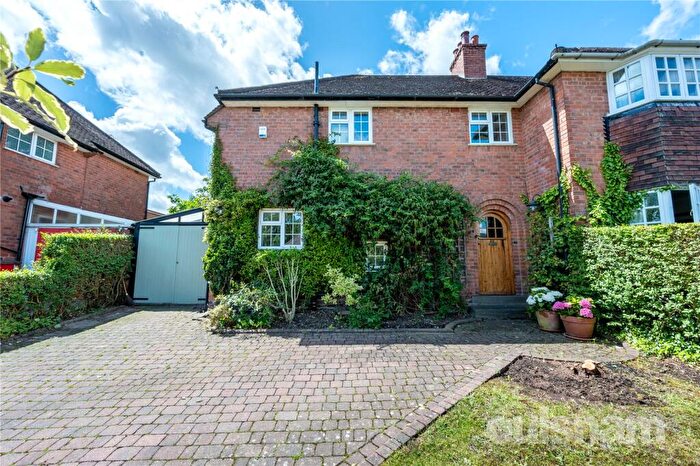
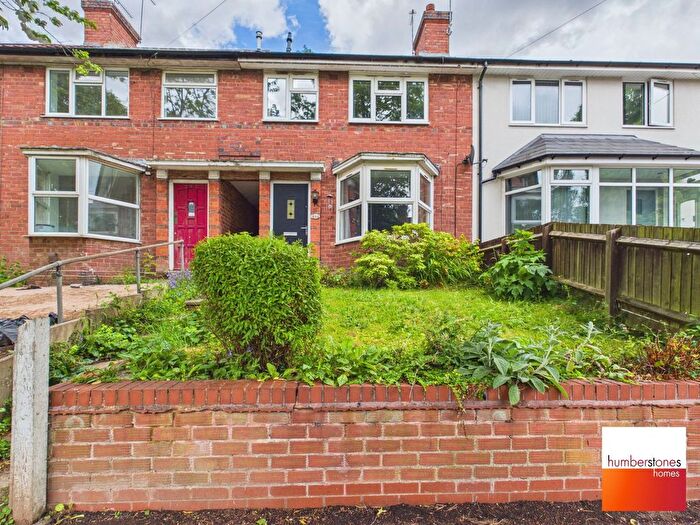
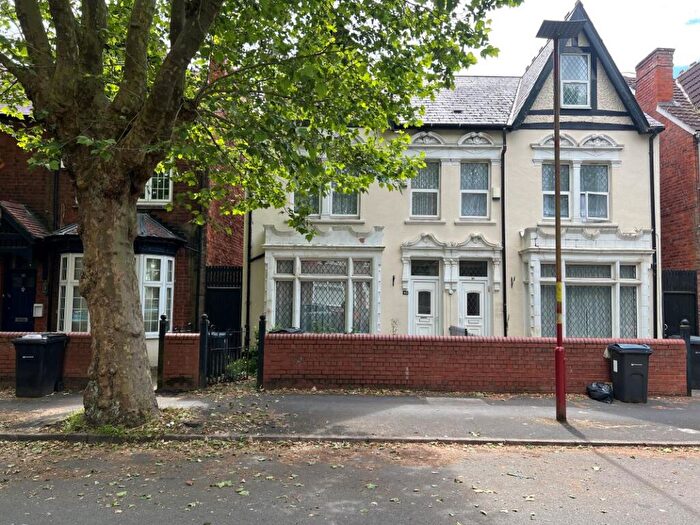
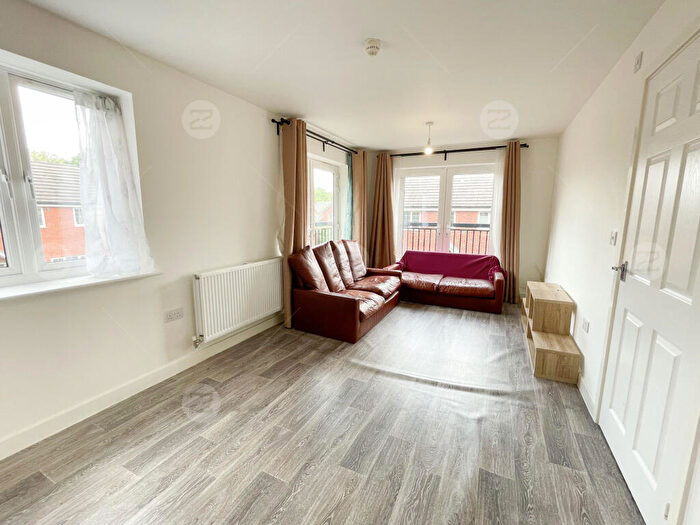
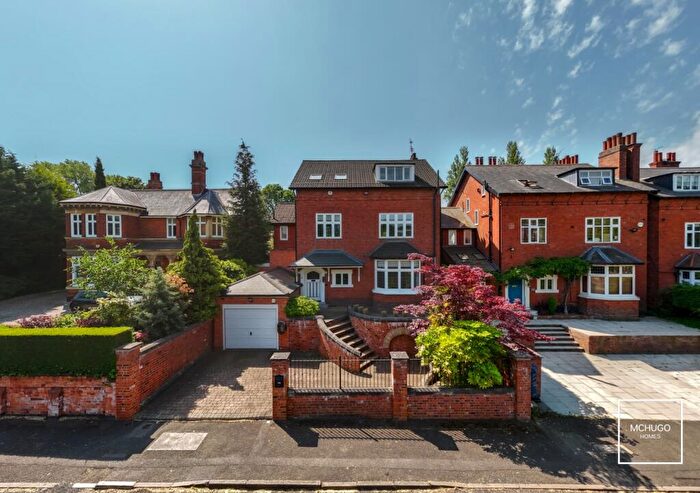
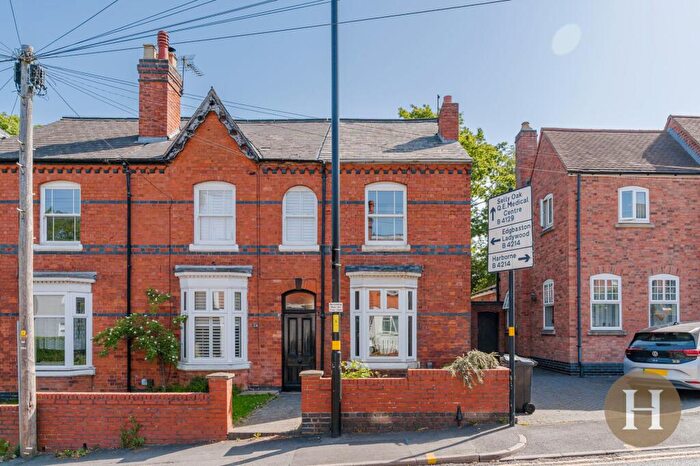
Properties for sale in Harborne

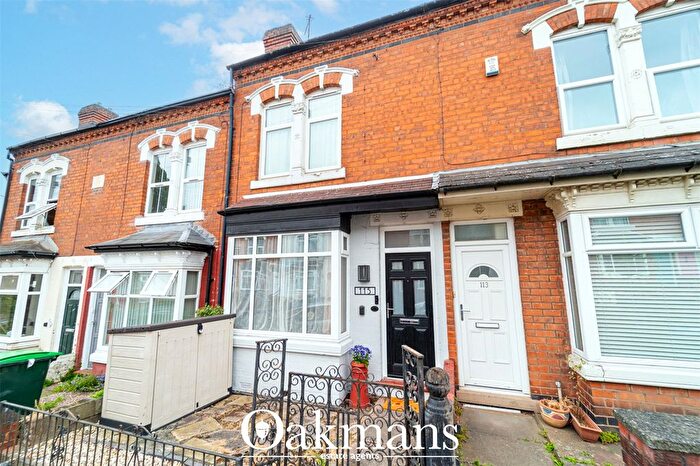
![]()
If you are looking to sell your house, let it out, or receive a property valuation, an expert can help you.
Click the button below to get started.


Roads and Postcodes in Harborne
Navigate through our locations to find the location of your next house in Harborne, Birmingham for sale or to rent.
Transport near Harborne
-
 University Station
 -
Selly Oak Station
-
Five Ways Station
-
Smethwick Rolfe Street Station
-
Bournville Station
-
Birmingham New Street Station
-
Jewellery Quarter Station
-
Birmingham Snow Hill Station
- FAQ
- Price Paid By Year
- Property Type Price
Frequently asked questions about Harborne
What is the average price for a property for sale in Harborne?
The average price for a property for sale in Harborne is £347,482. This amount is 47% higher than the average price in Birmingham. There are 6,343 property listings for sale in Harborne.
What streets have the most expensive properties for sale in Harborne?
The streets with the most expensive properties for sale in Harborne are St Marys Road at an average of £1,485,000, Boundary Avenue at an average of £880,000 and The Oaks at an average of £860,000.
What streets have the most affordable properties for sale in Harborne?
The streets with the most affordable properties for sale in Harborne are Selcroft Avenue at an average of £39,600, Malins Road at an average of £65,750 and Waterward Close at an average of £81,750.
Which train stations are available in or near Harborne?
Some of the train stations available in or near Harborne are University, Selly Oak and Five Ways.
Property Price Paid in Harborne by Year
The average sold property price by year was:
| Year | Average Sold Price | Price Change |
Sold Properties
|
|---|---|---|---|
| 2026 | £396,980 | 6% |
25 Properties |
| 2025 | £371,603 | 12% |
265 Properties |
| 2024 | £327,371 | -6% |
372 Properties |
| 2023 | £346,979 | -7% |
295 Properties |
| 2022 | £372,772 | 5% |
436 Properties |
| 2021 | £353,101 | 11% |
444 Properties |
| 2020 | £313,923 | 6% |
323 Properties |
| 2019 | £295,091 | -14% |
420 Properties |
| 2018 | £335,971 | 3% |
422 Properties |
| 2017 | £326,000 | 19% |
405 Properties |
| 2016 | £262,572 | -3% |
449 Properties |
| 2015 | £269,392 | 11% |
503 Properties |
| 2014 | £239,365 | 0,2% |
497 Properties |
| 2013 | £238,874 | 1% |
363 Properties |
| 2012 | £235,628 | 8% |
290 Properties |
| 2011 | £215,905 | -9% |
292 Properties |
| 2010 | £236,227 | 13% |
366 Properties |
| 2009 | £205,108 | -10% |
262 Properties |
| 2008 | £225,889 | -4% |
290 Properties |
| 2007 | £234,207 | 5% |
533 Properties |
| 2006 | £222,515 | 6% |
572 Properties |
| 2005 | £209,577 | 4% |
478 Properties |
| 2004 | £200,681 | 15% |
523 Properties |
| 2003 | £171,291 | 13% |
577 Properties |
| 2002 | £149,684 | 18% |
576 Properties |
| 2001 | £122,322 | 9% |
647 Properties |
| 2000 | £110,763 | 13% |
527 Properties |
| 1999 | £95,875 | 9% |
560 Properties |
| 1998 | £87,414 | 5% |
498 Properties |
| 1997 | £83,110 | 15% |
559 Properties |
| 1996 | £70,625 | 4% |
492 Properties |
| 1995 | £67,876 | - |
377 Properties |
Property Price per Property Type in Harborne
Here you can find historic sold price data in order to help with your property search.
The average Property Paid Price for specific property types in the last three years are:
| Property Type | Average Sold Price | Sold Properties |
|---|---|---|
| Semi Detached House | £428,394.00 | 242 Semi Detached Houses |
| Detached House | £677,341.00 | 84 Detached Houses |
| Terraced House | £327,935.00 | 403 Terraced Houses |
| Flat | £174,623.00 | 228 Flats |